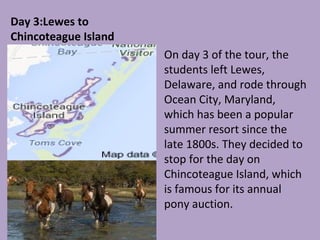
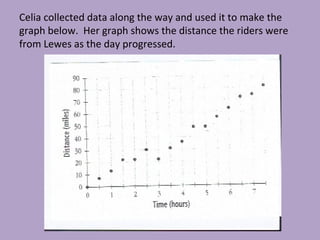
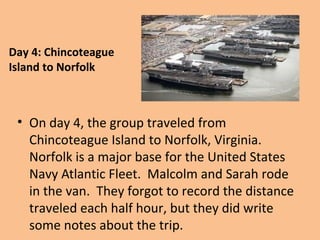
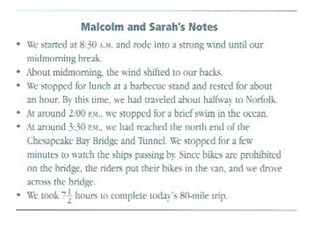
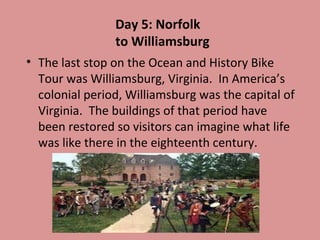
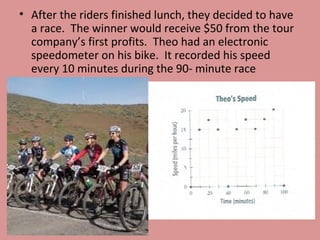
The students traveled from Lewes, Delaware to Chincoteague Island on day 3, stopping in Ocean City, Maryland along the way. On day 4 they traveled from Chincoteague Island to Norfolk, Virginia. Malcolm and Sarah forgot to record the distance traveled each half hour but took notes. On day 5 the last stop was Williamsburg, Virginia, where Theo participated in a 90-minute bike race and had his speed recorded every 10 minutes by his electronic speedometer.
Automating Business Process via MuleSoft Composer | Bangalore MuleSoft Meetup...
New week 4
1. 1. Overview Quiz
2. Review Investigation 2.3
3. Work in Groups and complete 2.3 follow up
4. Introduction into Investigation 2.4
2. Day 3:Lewes to
Chincoteague Island
On day 3 of the tour, the
students left Lewes,
Delaware, and rode through
Ocean City, Maryland,
which has been a popular
summer resort since the
late 1800s. They decided to
stop for the day on
Chincoteague Island, which
is famous for its annual
pony auction.
3. Celia collected data along the way and used it to make the
graph below. Her graph shows the distance the riders were
from Lewes as the day progressed.
4. A. Would it make sense to connect the points on
this graph? Explain.
B. Make a table of (time, distance) data from the
information in the graph.
C. What do you think happened between hours 2
and 4? Between hours 1.5 and 2?
D. Which method of displaying the (time,
distance) data helps you see the changes
better, a table or a graph? Explain your choice.
5. Pre-Algebra Honors
Tuesday/ Wednesday
1. Answer the warm up question in your spiral notebook.
2. Intro 2.4: Day 4
3. In groups of three please complete problems 2.4 in
your spiral notebook.
4. Discuss your answers to problems 2.4
5. Tonight’s Assignment
Complete follow up 2.4
6. Day 4: Chincoteague
Island to Norfolk
• On day 4, the group traveled from
Chincoteague Island to Norfolk, Virginia.
Norfolk is a major base for the United States
Navy Atlantic Fleet. Malcolm and Sarah rode
in the van. They forgot to record the distance
traveled each half hour, but they did write
some notes about the trip.
7.
8. In groups of three complete the
following task…
A. Make a table of (time, distance) data that
reasonably fits the information in Malcolm
and Sarah’s notes.
B. Sketch a coordinate graph that shows the
same information.
9. • Explain how you used each of the six notes to
help you make your table and graph from
yesterday.
10. 1.
Please have your homework on your desk and
ready to correct.
* Follow up 2.4
1.
Intro 2.5: Day 5
2.
As a class discuss Problems 2.5 and take
notes during discussion.
11. Day 5: Norfolk
to Williamsburg
• The last stop on the Ocean and History Bike
Tour was Williamsburg, Virginia. In America’s
colonial period, Williamsburg was the capital of
Virginia. The buildings of that period have
been restored so visitors can imagine what life
was like there in the eighteenth century.
12. • After the riders finished lunch, they decided to have
a race. The winner would receive $50 from the tour
company’s first profits. Theo had an electronic
speedometer on his bike. It recorded his speed
every 10 minutes during the 90- minute race
13. Problem 2.5
1. What was Theo’s fastest recorded speed, and when
did it occur?
2. What was Theo’s slowest recorded speed, and when
did it occur?
3. Describe the changes in Theo’s speed during the race.
4. The graph only shows his speed at 10 minute
intervals, it does not tell us what happen between 10minute marks. The paths below show 5 possibilities
of how his speed may have changed during the first
10 minutes. Explain in writing what each connecting
path would tell about his speed.