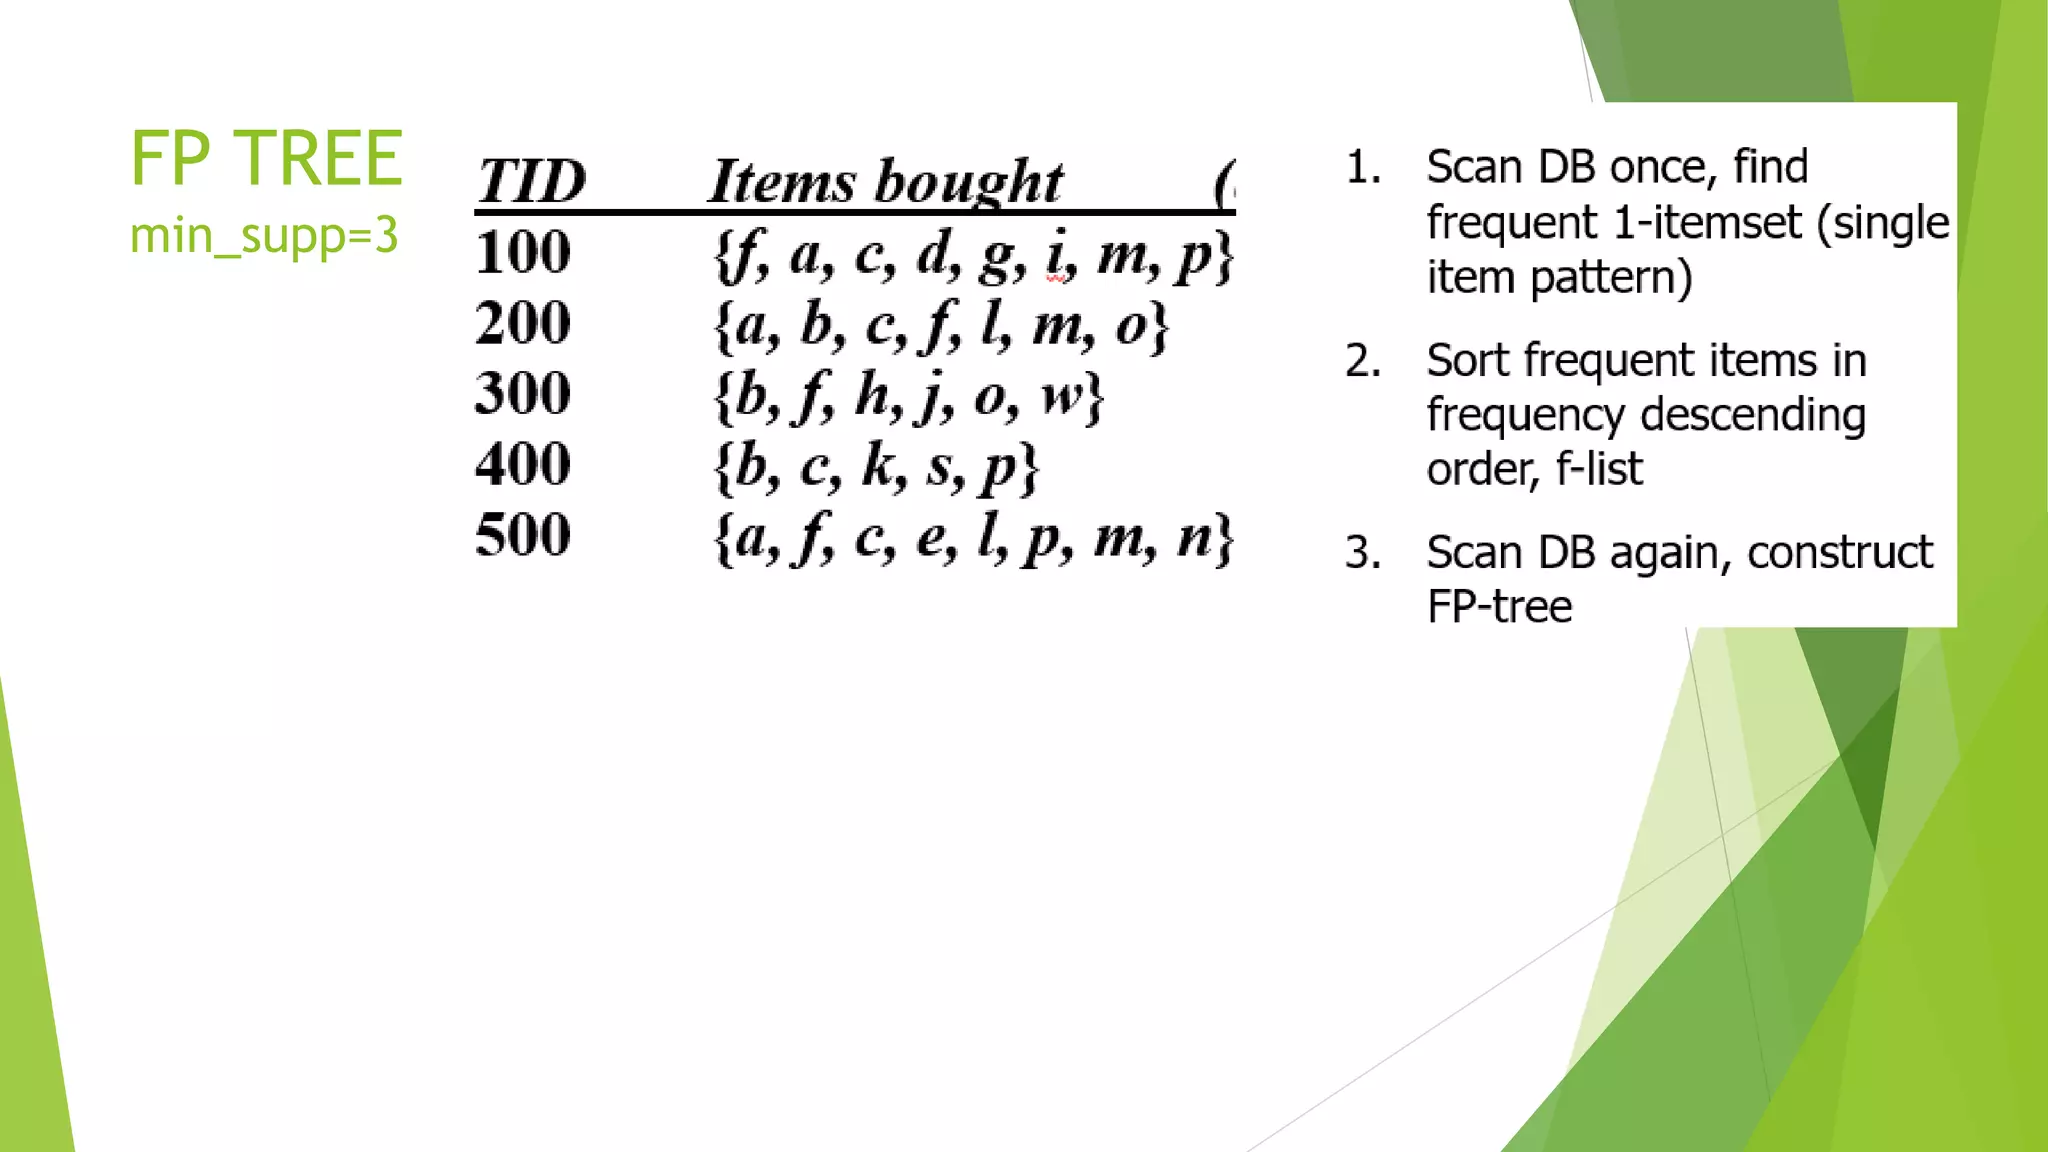
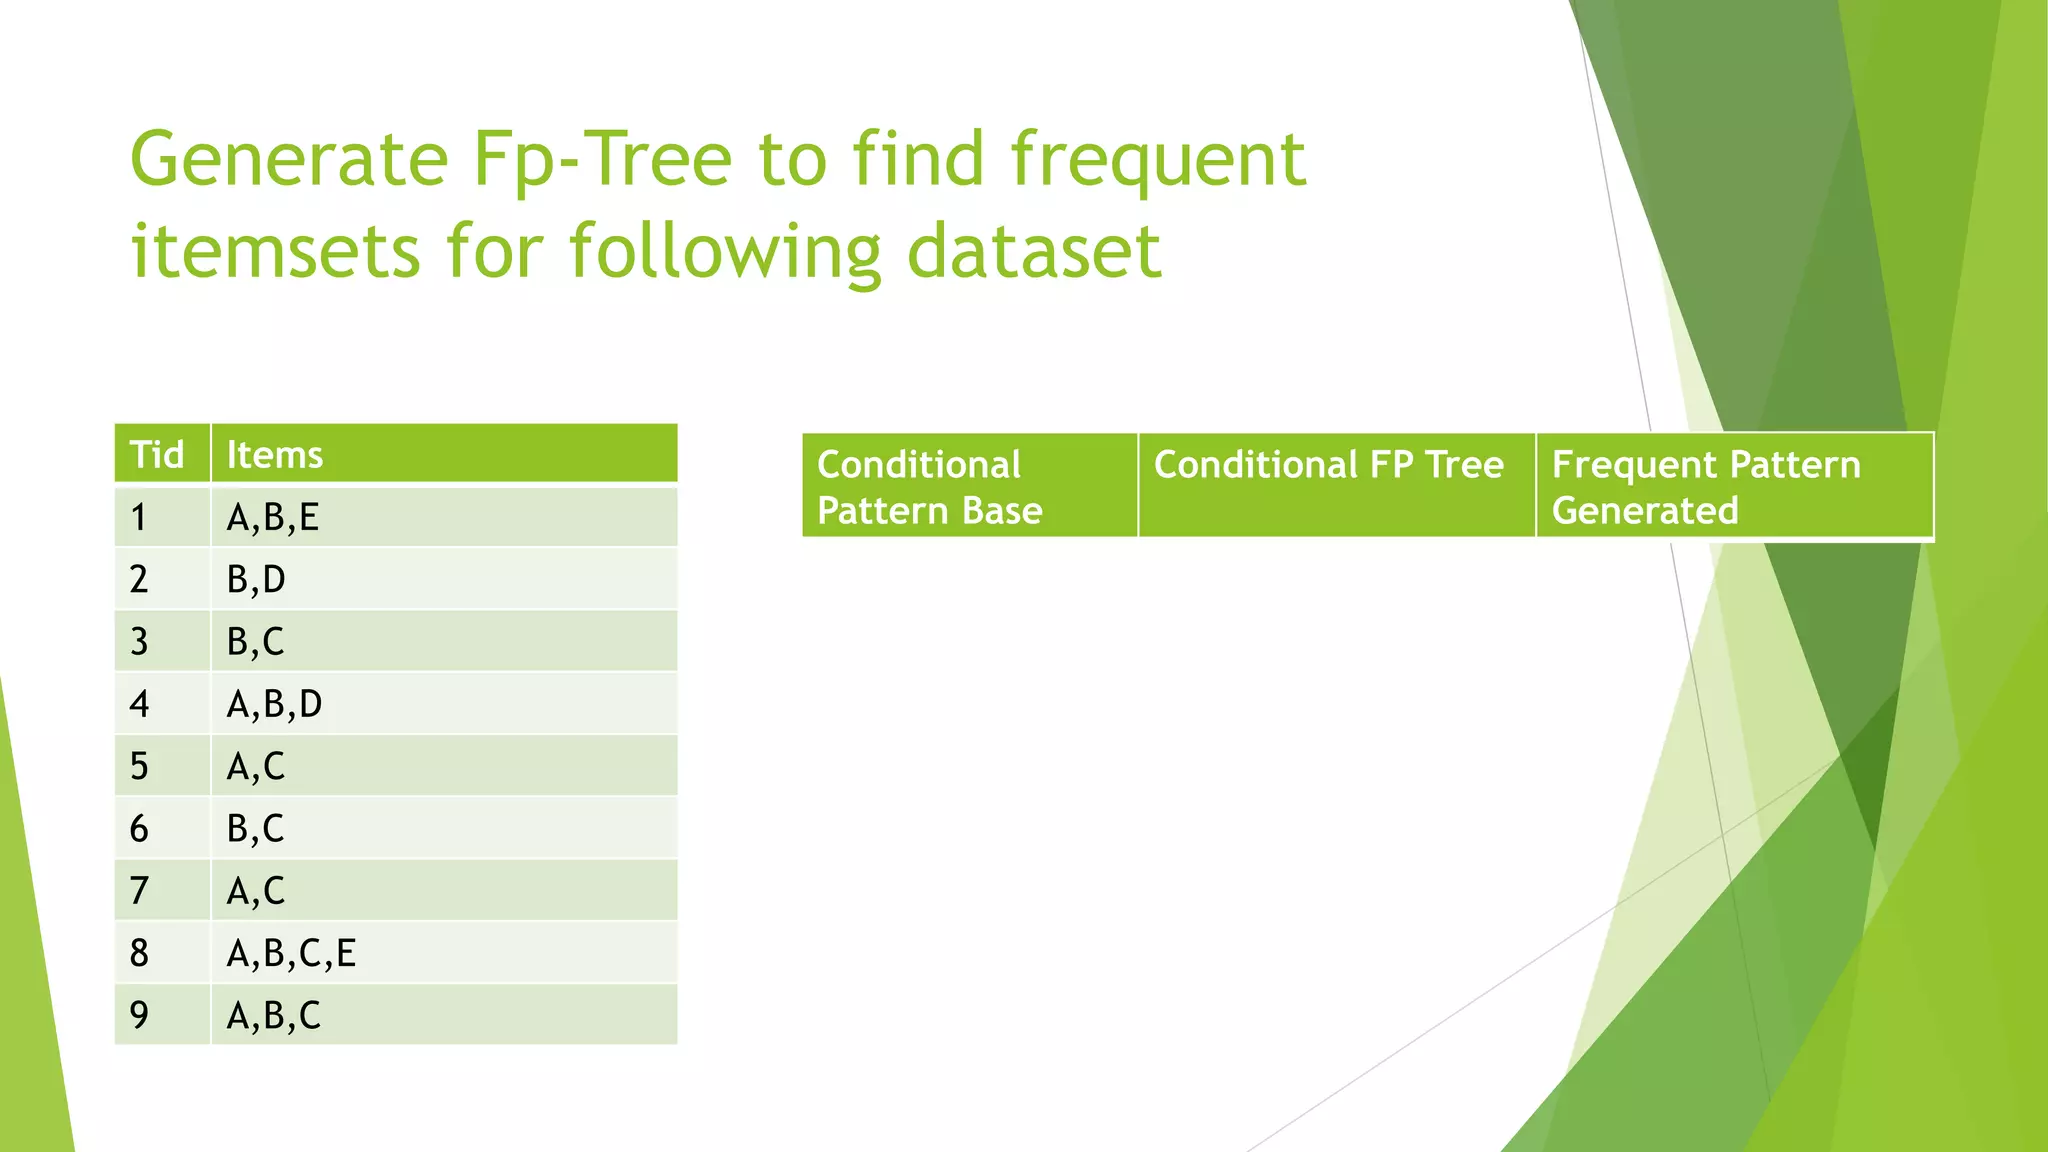
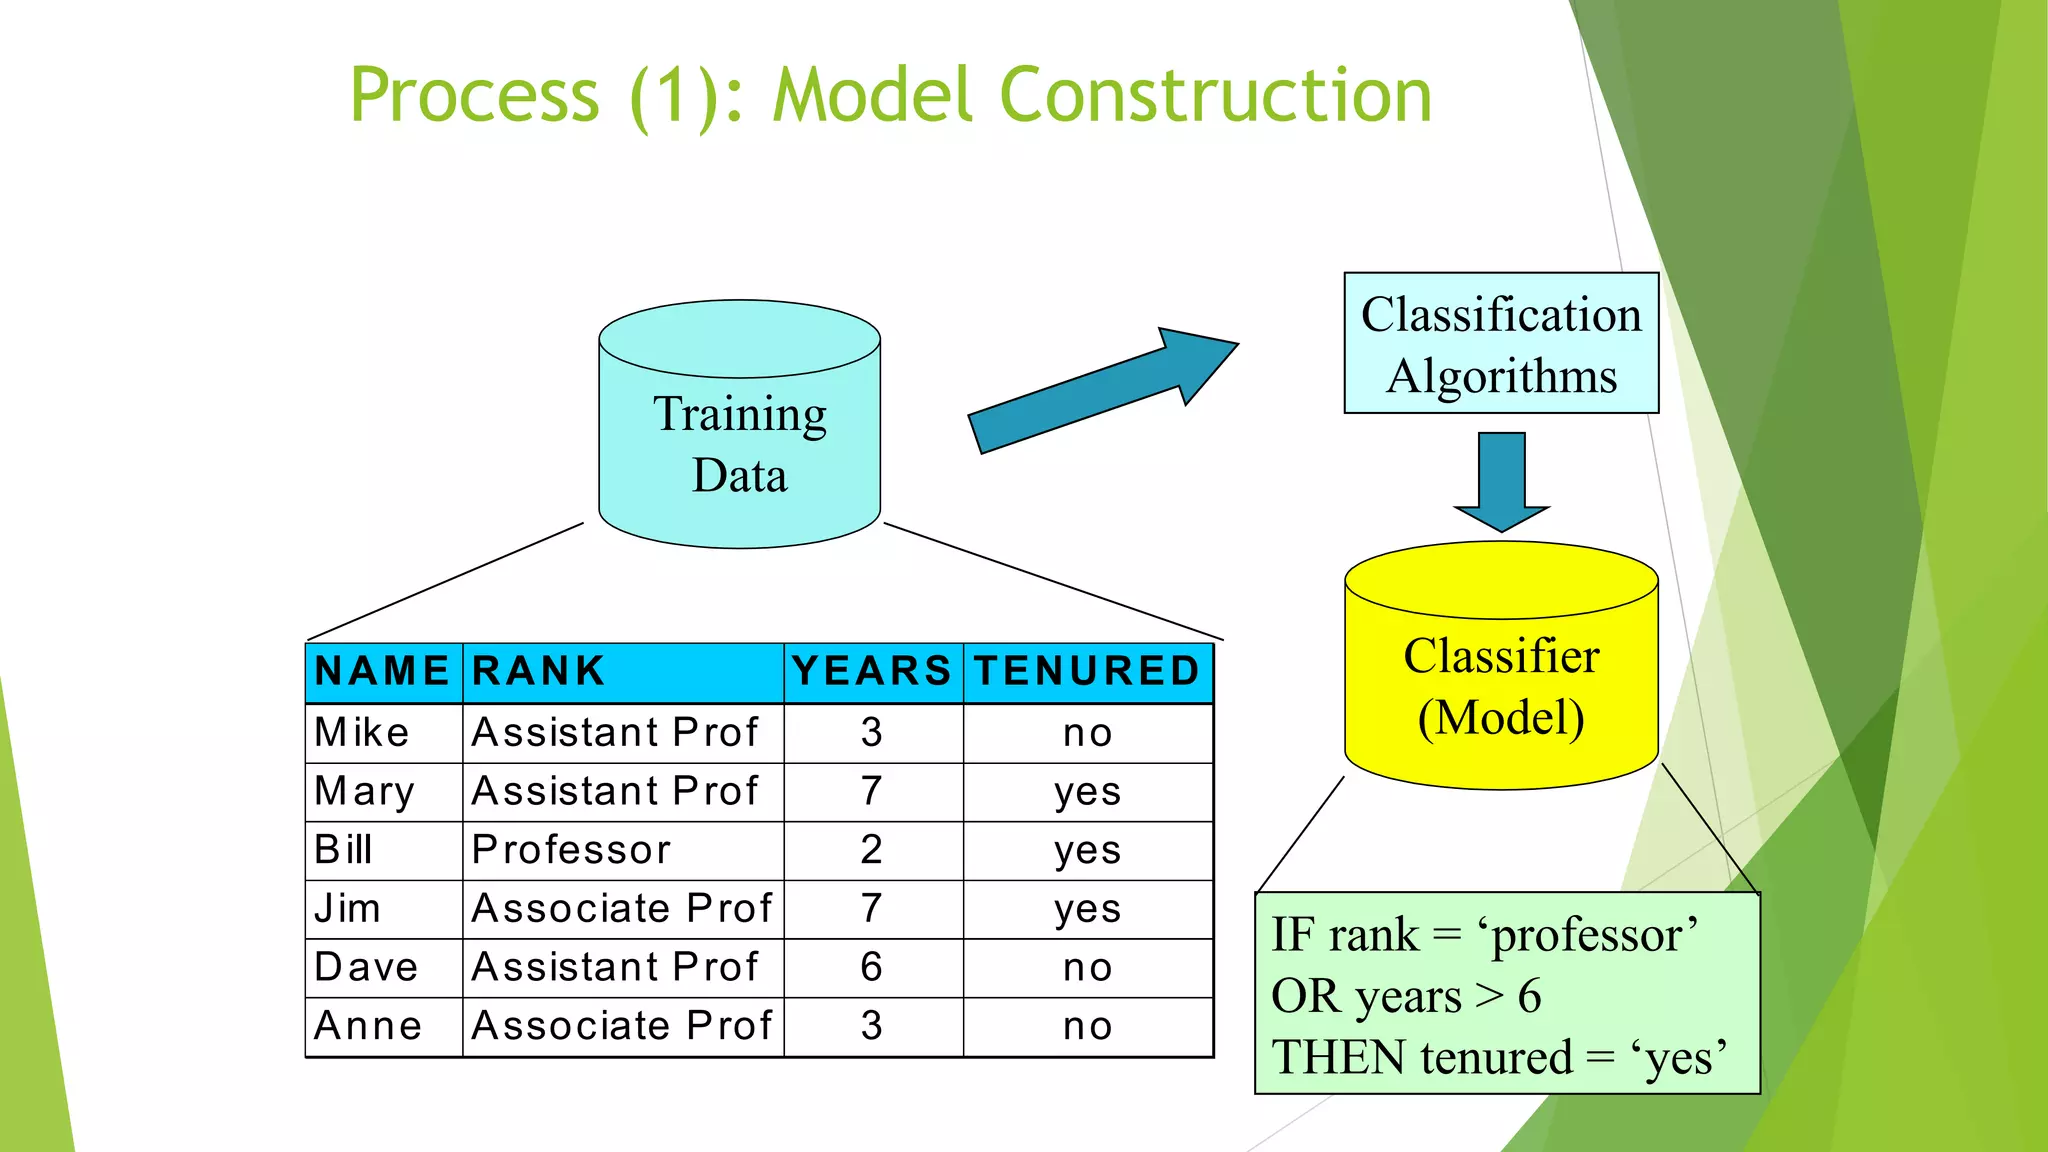
MINING FREQUENT
PATTERNS, ASSOCIATION
RULES
2
What Is Frequent Pattern Analysis?
 Frequent pattern: a pattern (a set of items, subsequences,
substructures, etc.) that occurs frequently in a data set
 First proposed by Agrawal, Imielinski, and Swami [AIS93] in the context
of frequent itemsets and association rule mining
 Motivation: Finding inherent regularities in data
 What products were often purchased together?— Milk and Bread ?!
 What are the subsequent purchases after buying a PC?
 Can we automatically classify web documents?
 Applications
 Basket data analysis, cross-marketing, catalog design, sale campaign
analysis etc
RETAIL-MARKET BASKET ANALYSIS
4
Basic Concepts: Frequent Patterns
 itemset: A set of one or more
items
 k-itemset X = {x1, …, xk}
 (absolute) support, or, support
count of X: Frequency or
occurrence of an itemset X
 (relative) support, s, is the
fraction of transactions that
contains X (i.e., the probability
that a transaction contains X)
 An itemset X is frequent if X’s
support is no less than a minsup
threshold
Customer
buys diaper
Customer
buys both
Customer
buys beer
Tid Items bought
10 Coffee, Nuts, Snacks
20 Milk, Coffee, Diaper
30 Beer, Bread
40 Tea, Sugar, Milk
50 Nuts, Coffee, Sugar, Bread, Milk
5
Basic Concepts: Association Rules
 Find all the rules X  Y with
minimum support and confidence
 support, s, probability that a
transaction contains X and Y
 confidence, c, conditional
probability that a transaction
having X also contains Y
Freq. Pat.: Beer:1, Nuts:2, Diaper:1,
Coffee:3,Milk:3 {Coffee, Milk}:2
 Association rules: (many more!)
 milk  Coffee
 Snacks  Beer
Tid Items bought
10 Coffee, Nuts, Snacks
20 Milk, Coffee, Diaper
30 Beer, Bread
40 Tea, Sugar, Milk
50 Nuts, Coffee, Sugar, Bread, Milk
FIND THE SUPPORT AND CONFIDENCE
7
Scalable Frequent Itemset Mining Methods
 Apriori: A Candidate Generation-and-Test Approach
 FPGrowth: A Frequent Pattern-Growth Approach
8
The Downward Closure Property and Scalable
Mining Methods
 The downward closure property of frequent patterns
 Any subset of a frequent itemset must be frequent
 If {Coffee, Milk, Bread} is frequent, so is {Coffee,
Milk}
 i.e., every transaction having {Coffee, Milk, Bread}
also contains {Coffee, Milk}
9
Apriori: A Candidate Generation & Test Approach
 Method:
 Initially, scan DB once to get frequent 1-itemset
 Generate length (k+1) candidate itemsets from length k
frequent itemsets
 Test the candidates against DB
 Terminate when no frequent or candidate set can be
generated
10
The Apriori Algorithm—An Example
Database TDB
1st scan
C1
L1
L2
C2 C2
2nd scan
C3 L3
3rd scan
Tid Items
10 A, C, D
20 B, C, E
30 A, B, C, E
40 B, E
Itemset sup
{A} 2
{B} 3
{C} 3
{D} 1
{E} 3
Itemset sup
{A} 2
{B} 3
{C} 3
{E} 3
Itemset
{A, B}
{A, C}
{A, E}
{B, C}
{B, E}
{C, E}
Itemset sup
{A, B} 1
{A, C} 2
{A, E} 1
{B, C} 2
{B, E} 3
{C, E} 2
Itemset sup
{A, C} 2
{B, C} 2
{B, E} 3
{C, E} 2
Itemset
{B, C, E}
Itemset sup
{B, C, E} 2
Supmin = 2
CONFIDENCE LEVELS
12
The Apriori Algorithm (Pseudo-Code)
Ck: Candidate itemset of size k
Lk : frequent itemset of size k
L1 = {frequent items};
for (k = 1; Lk !=; k++) do begin
Ck+1 = candidates generated from Lk;
for each transaction t in database do
increment the count of all candidates in Ck+1 that
are contained in t
Lk+1 = candidates in Ck+1 with min_support
end
return k Lk;
13
Implementation of Apriori
 How to generate candidates?
 Step 1: self-joining Lk
 Step 2: pruning
 Example of Candidate-generation
 L3={abc, abd, acd, ace, bcd}
 Self-joining: L3*L3
 abcd from abc and abd
 acde from acd and ace
 Pruning:
 acde is removed because ade is not in L3
 C4 = {abcd}
EXAMPLE MIN SUPP=2
CONFIDENCE
FP TREE
min_supp=3
18
Construct FP-tree from a Transaction Database
{}
f:4 c:1
b:1
p:1
b:1
c:3
a:3
b:1
m:2
p:2 m:1
Header Table
Item frequency head
f 4
c 4
a 3
b 3
m 3
p 3
min_support = 3
TID Items bought (ordered) frequent items
100 {f, a, c, d, g, i, m, p} {f, c, a, m, p}
200 {a, b, c, f, l, m, o} {f, c, a, b, m}
300 {b, f, h, j, o, w} {f, b}
400 {b, c, k, s, p} {c, b, p}
500 {a, f, c, e, l, p, m, n} {f, c, a, m, p}
1. Scan DB once, find
frequent 1-itemset (single
item pattern)
2. Sort frequent items in
frequency descending
order, f-list
3. Scan DB again, construct
FP-tree
21
Find Patterns Having P From P-conditional Database
 Starting at the frequent item header table in the FP-tree
 Traverse the FP-tree by following the link of each frequent item
p
 Accumulate all of transformed prefix paths of item p to form p’s
conditional pattern base
Conditional pattern bases
itemcond. pattern base
c f:3
a fc:3
b fca:1, f:1, c:1
m fca:2, fcab:1
p fcam:2, cb:1
{}
f:4 c:1
b:1
p:1
b:1
c:3
a:3
b:1
m:2
p:2 m:1
Header Table
Item frequency head
f 4
c 4
a 3
b 3
m 3
p 3
Practice Question
Implement and analyse Association rules for the following dataset with
min_support = 60% and confidence =80%
Find all the frequent item sets using Apriori Algorithm. List the strong association
rules.
Generate Fp-Tree to find frequent
itemsets for following dataset
Tid Items
1 A,B,E
2 B,D
3 B,C
4 A,B,D
5 A,C
6 B,C
7 A,C
8 A,B,C,E
9 A,B,C
Conditional
Pattern Base
Conditional FP Tree Frequent Pattern
Generated
24
Benefits of the FP-tree Structure
 Completeness
 Preserve complete information for frequent pattern
mining
 Never break a long pattern of any transaction
 Compactness
 Reduce irrelevant info—infrequent items are gone
 Items in frequency descending order: the more
frequently occurring, the more likely to be shared
 Never be larger than the original database (not count
node-links and the count field)
25
The Frequent Pattern Growth Mining Method
 Idea: Frequent pattern growth
 Recursively grow frequent patterns by pattern and
database partition
 Method
 For each frequent item, construct its conditional
pattern-base, and then its conditional FP-tree
 Repeat the process on each newly created conditional
FP-tree
 Until the resulting FP-tree is empty, or it contains only
one path—single path will generate all the
combinations of its sub-paths, each of which is a
frequent pattern
Supervised vs. Unsupervised Learning
 Supervised learning (classification)
 Supervision: The training data (observations, measurements,
etc.) are accompanied by labels indicating the class of the
observations
 New data is classified based on the training set
 Unsupervised learning (clustering)
 The class labels of training data is unknown
 Given a set of measurements, observations, etc. with the
aim of establishing the existence of classes or clusters in the
data
 Classification
 predicts categorical class labels (discrete or nominal)
 classifies data (constructs a model) based on the training set and
the values (class labels) in a classifying attribute and uses it in
classifying new data
 Numeric Prediction
 models continuous-valued functions, i.e., predicts unknown or
missing values
 Typical applications
 Credit/loan approval:
 Medical diagnosis: if a tumor is cancerous or benign
 Fraud detection: if a transaction is fraudulent
 Web page categorization: which category it is
Prediction Problems: Classification vs. Numeric
Prediction
Classification—A Two-Step Process
 Model construction: describing a set of predetermined classes
 Each tuple/sample is assumed to belong to a predefined class, as determined by
the class label attribute
 The set of tuples used for model construction is training set
 The model is represented as classification rules, decision trees, or mathematical
formulae
 Model usage: for classifying future or unknown objects
 Estimate accuracy of the model
 The known label of test sample is compared with the classified result from
the model
 Accuracy rate is the percentage of test set samples that are correctly
classified by the model
 Test set is independent of training set (otherwise overfitting)
 If the accuracy is acceptable, use the model to classify new data
 Note: If the test set is used to select models, it is called validation (test) set
Process (1): Model Construction
Training
Data
NAME RANK YEARS TENURED
Mike Assistant Prof 3 no
Mary Assistant Prof 7 yes
Bill Professor 2 yes
Jim Associate Prof 7 yes
Dave Assistant Prof 6 no
Anne Associate Prof 3 no
Classification
Algorithms
IF rank = ‘professor’
OR years > 6
THEN tenured = ‘yes’
Classifier
(Model)
Process (2): Using the Model in Prediction
Classifier
Testing
Data
NAME RANK YEARS TENURED
Tom Assistant Prof 2 no
Merlisa Associate Prof 7 no
George Professor 5 yes
Joseph Assistant Prof 7 yes
Unseen Data
(Jeff, Professor, 4)
Tenured?
Bayesian Classification: Why?
 A statistical classifier: performs probabilistic prediction, i.e.,
predicts class membership probabilities
 Foundation: Based on Bayes’ Theorem.
 Performance: A simple Bayesian classifier, naïve Bayesian
classifier, has comparable performance with decision tree and
selected neural network classifiers
 Incremental: Each training example can incrementally
increase/decrease the probability that a hypothesis is correct
— prior knowledge can be combined with observed data
 Standard: Even when Bayesian methods are computationally
intractable, they can provide a standard of optimal decision
making against which other methods can be measured
BAYES THEOREM
 Conditional Probability= p(A|B)=p(A n B)/p(B)
Bayes’ Theorem: Basics
 Total probability Theorem:
 Bayes’ Theorem:
 Let X be a data sample (“evidence”): class label is unknown
 Let H be a hypothesis that X belongs to class C
 Classification is to determine P(H|X), (i.e., posteriori probability):
the probability that the hypothesis holds given the observed data
sample X
 P(H) (prior probability): the initial probability
 E.g., X will buy computer, regardless of age, income, …
 P(X): probability that sample data is observed
 P(X|H) (likelihood): the probability of observing the sample X, given
that the hypothesis holds
 E.g., Given that X will buy computer, the prob. that X is 31..40,
medium income
)
(
)
1
|
(
)
(
i
A
P
M
i i
A
B
P
B
P 


)
(
/
)
(
)
|
(
)
(
)
(
)
|
(
)
|
( X
X
X
X
X P
H
P
H
P
P
H
P
H
P
H
P 


Prediction Based on Bayes’ Theorem
 Given training data X, posteriori probability of a
hypothesis H, P(H|X), follows the Bayes’ theorem
 Informally, this can be viewed as
posteriori = likelihood x prior/evidence
 Predicts X belongs to Ci iff the probability P(Ci|X) is the
highest among all the P(Ck|X) for all the k classes
 Practical difficulty: It requires initial knowledge of many
probabilities, involving significant computational cost
)
(
/
)
(
)
|
(
)
(
)
(
)
|
(
)
|
( X
X
X
X
X P
H
P
H
P
P
H
P
H
P
H
P 


BAYES THEOREM
NAÏVE BAYES EXAMPLE
(OUTLOOK, TEMP)---PLAY(YES/NO)
YES NO P(YES) P(NO)
SUNNY 2 3
OVERCAST 4 0
RAINY 3 2
TOTAL
YES NO P(YES) P(NO)
HOT 2 2
MILD 4 2
COLD 3 1
TOTAL
OUTLOOK
TEMPERATURE
YES 9
NO 5
PLAYS TENNIS YES OR NO
Naïve Bayes Classifier: Training Dataset
Class:
C1:buys_computer = ‘yes’
C2:buys_computer = ‘no’
Data to be classified:
X = (age <=30,
Income = medium,
Student = yes
Credit_rating = Fair)
age income student
credit_rating
buys_computer
<=30 high no fair no
<=30 high no excellent no
31…40 high no fair yes
>40 medium no fair yes
>40 low yes fair yes
>40 low yes excellent no
31…40 low yes excellent yes
<=30 medium no fair no
<=30 low yes fair yes
>40 medium yes fair yes
<=30 medium yes excellent yes
31…40 medium no excellent yes
31…40 high yes fair yes
>40 medium no excellent no
Naïve Bayes Classifier: An Example
 P(Ci): P(buys_computer = “yes”) = 9/14 = 0.643
P(buys_computer = “no”) = 5/14= 0.357
 Compute P(X|Ci) for each class
P(age = “<=30” | buys_computer = “yes”) = 2/9 = 0.222
P(age = “<= 30” | buys_computer = “no”) = 3/5 = 0.6
P(income = “medium” | buys_computer = “yes”) = 4/9 = 0.444
P(income = “medium” | buys_computer = “no”) = 2/5 = 0.4
P(student = “yes” | buys_computer = “yes) = 6/9 = 0.667
P(student = “yes” | buys_computer = “no”) = 1/5 = 0.2
P(credit_rating = “fair” | buys_computer = “yes”) = 6/9 = 0.667
P(credit_rating = “fair” | buys_computer = “no”) = 2/5 = 0.4
 X = (age <= 30 , income = medium, student = yes, credit_rating = fair)
P(X|Ci) : P(X|buys_computer = “yes”) = 0.222 x 0.444 x 0.667 x 0.667 = 0.044
P(X|buys_computer = “no”) = 0.6 x 0.4 x 0.2 x 0.4 = 0.019
P(X|Ci)*P(Ci) : P(X|buys_computer = “yes”) * P(buys_computer = “yes”) = 0.028
P(X|buys_computer = “no”) * P(buys_computer = “no”) = 0.007
Therefore, X belongs to class (“buys_computer = yes”)
age income student
credit_rating
buys_computer
<=30 high no fair no
<=30 high no excellent no
31…40 high no fair yes
>40 medium no fair yes
>40 low yes fair yes
>40 low yes excellent no
31…40 low yes excellent yes
<=30 medium no fair no
<=30 low yes fair yes
>40 medium yes fair yes
<=30 medium yes excellent yes
31…40 medium no excellent yes
31…40 high yes fair yes
>40 medium no excellent no
Decision Tree Induction: An Example
age?
overcast
student? credit rating?
<=30 >40
no yes yes
yes
31..40
fair
excellent
yes
no
age income student credit_rating buys_computer
<=30 high no fair no
<=30 high no excellent no
31…40 high no fair yes
>40 medium no fair yes
>40 low yes fair yes
>40 low yes excellent no
31…40 low yes excellent yes
<=30 medium no fair no
<=30 low yes fair yes
>40 medium yes fair yes
<=30 medium yes excellent yes
31…40 medium no excellent yes
31…40 high yes fair yes
>40 medium no excellent no
 Training data set: Buys_computer
 Resulting tree:
Algorithm for Decision Tree Induction
 Basic algorithm (a greedy algorithm)
 Tree is constructed in a top-down recursive divide-and-conquer
manner
 At start, all the training examples are at the root
 Attributes are categorical (if continuous-valued, they are
discretized in advance)
 Examples are partitioned recursively based on selected
attributes
 Test attributes are selected on the basis of a heuristic or
statistical measure (e.g., information gain)
 Conditions for stopping partitioning
 All samples for a given node belong to the same class
 There are no remaining attributes for further partitioning –
majority voting is employed for classifying the leaf
 There are no samples left
Brief Review of Entropy

m = 2
Attribute Selection Measure:
Information Gain (ID3)
 Select the attribute with the highest information gain
 Let pi be the probability that an arbitrary tuple in D belongs to class Ci,
estimated by |Ci, D|/|D|
 Expected information (entropy) needed to classify a tuple in D:
 Information needed (after using A to split D into v partitions) to classify
D:
 Information gained by branching on attribute A
)
(
log
)
( 2
1
i
m
i
i p
p
D
Info 



)
(
|
|
|
|
)
(
1
j
v
j
j
A D
Info
D
D
D
Info 
 

(D)
Info
Info(D)
Gain(A) A


Unit 3.pptx
Unit 3.pptx
Unit 3.pptx
Unit 3.pptx

Unit 3.pptx

  • 1.
  • 2.
    2 What Is FrequentPattern Analysis?  Frequent pattern: a pattern (a set of items, subsequences, substructures, etc.) that occurs frequently in a data set  First proposed by Agrawal, Imielinski, and Swami [AIS93] in the context of frequent itemsets and association rule mining  Motivation: Finding inherent regularities in data  What products were often purchased together?— Milk and Bread ?!  What are the subsequent purchases after buying a PC?  Can we automatically classify web documents?  Applications  Basket data analysis, cross-marketing, catalog design, sale campaign analysis etc
  • 3.
  • 4.
    4 Basic Concepts: FrequentPatterns  itemset: A set of one or more items  k-itemset X = {x1, …, xk}  (absolute) support, or, support count of X: Frequency or occurrence of an itemset X  (relative) support, s, is the fraction of transactions that contains X (i.e., the probability that a transaction contains X)  An itemset X is frequent if X’s support is no less than a minsup threshold Customer buys diaper Customer buys both Customer buys beer Tid Items bought 10 Coffee, Nuts, Snacks 20 Milk, Coffee, Diaper 30 Beer, Bread 40 Tea, Sugar, Milk 50 Nuts, Coffee, Sugar, Bread, Milk
  • 5.
    5 Basic Concepts: AssociationRules  Find all the rules X  Y with minimum support and confidence  support, s, probability that a transaction contains X and Y  confidence, c, conditional probability that a transaction having X also contains Y Freq. Pat.: Beer:1, Nuts:2, Diaper:1, Coffee:3,Milk:3 {Coffee, Milk}:2  Association rules: (many more!)  milk  Coffee  Snacks  Beer Tid Items bought 10 Coffee, Nuts, Snacks 20 Milk, Coffee, Diaper 30 Beer, Bread 40 Tea, Sugar, Milk 50 Nuts, Coffee, Sugar, Bread, Milk
  • 6.
    FIND THE SUPPORTAND CONFIDENCE
  • 7.
    7 Scalable Frequent ItemsetMining Methods  Apriori: A Candidate Generation-and-Test Approach  FPGrowth: A Frequent Pattern-Growth Approach
  • 8.
    8 The Downward ClosureProperty and Scalable Mining Methods  The downward closure property of frequent patterns  Any subset of a frequent itemset must be frequent  If {Coffee, Milk, Bread} is frequent, so is {Coffee, Milk}  i.e., every transaction having {Coffee, Milk, Bread} also contains {Coffee, Milk}
  • 9.
    9 Apriori: A CandidateGeneration & Test Approach  Method:  Initially, scan DB once to get frequent 1-itemset  Generate length (k+1) candidate itemsets from length k frequent itemsets  Test the candidates against DB  Terminate when no frequent or candidate set can be generated
  • 10.
    10 The Apriori Algorithm—AnExample Database TDB 1st scan C1 L1 L2 C2 C2 2nd scan C3 L3 3rd scan Tid Items 10 A, C, D 20 B, C, E 30 A, B, C, E 40 B, E Itemset sup {A} 2 {B} 3 {C} 3 {D} 1 {E} 3 Itemset sup {A} 2 {B} 3 {C} 3 {E} 3 Itemset {A, B} {A, C} {A, E} {B, C} {B, E} {C, E} Itemset sup {A, B} 1 {A, C} 2 {A, E} 1 {B, C} 2 {B, E} 3 {C, E} 2 Itemset sup {A, C} 2 {B, C} 2 {B, E} 3 {C, E} 2 Itemset {B, C, E} Itemset sup {B, C, E} 2 Supmin = 2
  • 11.
  • 12.
    12 The Apriori Algorithm(Pseudo-Code) Ck: Candidate itemset of size k Lk : frequent itemset of size k L1 = {frequent items}; for (k = 1; Lk !=; k++) do begin Ck+1 = candidates generated from Lk; for each transaction t in database do increment the count of all candidates in Ck+1 that are contained in t Lk+1 = candidates in Ck+1 with min_support end return k Lk;
  • 13.
    13 Implementation of Apriori How to generate candidates?  Step 1: self-joining Lk  Step 2: pruning  Example of Candidate-generation  L3={abc, abd, acd, ace, bcd}  Self-joining: L3*L3  abcd from abc and abd  acde from acd and ace  Pruning:  acde is removed because ade is not in L3  C4 = {abcd}
  • 14.
  • 16.
  • 17.
  • 18.
    18 Construct FP-tree froma Transaction Database {} f:4 c:1 b:1 p:1 b:1 c:3 a:3 b:1 m:2 p:2 m:1 Header Table Item frequency head f 4 c 4 a 3 b 3 m 3 p 3 min_support = 3 TID Items bought (ordered) frequent items 100 {f, a, c, d, g, i, m, p} {f, c, a, m, p} 200 {a, b, c, f, l, m, o} {f, c, a, b, m} 300 {b, f, h, j, o, w} {f, b} 400 {b, c, k, s, p} {c, b, p} 500 {a, f, c, e, l, p, m, n} {f, c, a, m, p} 1. Scan DB once, find frequent 1-itemset (single item pattern) 2. Sort frequent items in frequency descending order, f-list 3. Scan DB again, construct FP-tree
  • 21.
    21 Find Patterns HavingP From P-conditional Database  Starting at the frequent item header table in the FP-tree  Traverse the FP-tree by following the link of each frequent item p  Accumulate all of transformed prefix paths of item p to form p’s conditional pattern base Conditional pattern bases itemcond. pattern base c f:3 a fc:3 b fca:1, f:1, c:1 m fca:2, fcab:1 p fcam:2, cb:1 {} f:4 c:1 b:1 p:1 b:1 c:3 a:3 b:1 m:2 p:2 m:1 Header Table Item frequency head f 4 c 4 a 3 b 3 m 3 p 3
  • 22.
    Practice Question Implement andanalyse Association rules for the following dataset with min_support = 60% and confidence =80% Find all the frequent item sets using Apriori Algorithm. List the strong association rules.
  • 23.
    Generate Fp-Tree tofind frequent itemsets for following dataset Tid Items 1 A,B,E 2 B,D 3 B,C 4 A,B,D 5 A,C 6 B,C 7 A,C 8 A,B,C,E 9 A,B,C Conditional Pattern Base Conditional FP Tree Frequent Pattern Generated
  • 24.
    24 Benefits of theFP-tree Structure  Completeness  Preserve complete information for frequent pattern mining  Never break a long pattern of any transaction  Compactness  Reduce irrelevant info—infrequent items are gone  Items in frequency descending order: the more frequently occurring, the more likely to be shared  Never be larger than the original database (not count node-links and the count field)
  • 25.
    25 The Frequent PatternGrowth Mining Method  Idea: Frequent pattern growth  Recursively grow frequent patterns by pattern and database partition  Method  For each frequent item, construct its conditional pattern-base, and then its conditional FP-tree  Repeat the process on each newly created conditional FP-tree  Until the resulting FP-tree is empty, or it contains only one path—single path will generate all the combinations of its sub-paths, each of which is a frequent pattern
  • 26.
    Supervised vs. UnsupervisedLearning  Supervised learning (classification)  Supervision: The training data (observations, measurements, etc.) are accompanied by labels indicating the class of the observations  New data is classified based on the training set  Unsupervised learning (clustering)  The class labels of training data is unknown  Given a set of measurements, observations, etc. with the aim of establishing the existence of classes or clusters in the data
  • 27.
     Classification  predictscategorical class labels (discrete or nominal)  classifies data (constructs a model) based on the training set and the values (class labels) in a classifying attribute and uses it in classifying new data  Numeric Prediction  models continuous-valued functions, i.e., predicts unknown or missing values  Typical applications  Credit/loan approval:  Medical diagnosis: if a tumor is cancerous or benign  Fraud detection: if a transaction is fraudulent  Web page categorization: which category it is Prediction Problems: Classification vs. Numeric Prediction
  • 28.
    Classification—A Two-Step Process Model construction: describing a set of predetermined classes  Each tuple/sample is assumed to belong to a predefined class, as determined by the class label attribute  The set of tuples used for model construction is training set  The model is represented as classification rules, decision trees, or mathematical formulae  Model usage: for classifying future or unknown objects  Estimate accuracy of the model  The known label of test sample is compared with the classified result from the model  Accuracy rate is the percentage of test set samples that are correctly classified by the model  Test set is independent of training set (otherwise overfitting)  If the accuracy is acceptable, use the model to classify new data  Note: If the test set is used to select models, it is called validation (test) set
  • 29.
    Process (1): ModelConstruction Training Data NAME RANK YEARS TENURED Mike Assistant Prof 3 no Mary Assistant Prof 7 yes Bill Professor 2 yes Jim Associate Prof 7 yes Dave Assistant Prof 6 no Anne Associate Prof 3 no Classification Algorithms IF rank = ‘professor’ OR years > 6 THEN tenured = ‘yes’ Classifier (Model)
  • 30.
    Process (2): Usingthe Model in Prediction Classifier Testing Data NAME RANK YEARS TENURED Tom Assistant Prof 2 no Merlisa Associate Prof 7 no George Professor 5 yes Joseph Assistant Prof 7 yes Unseen Data (Jeff, Professor, 4) Tenured?
  • 32.
    Bayesian Classification: Why? A statistical classifier: performs probabilistic prediction, i.e., predicts class membership probabilities  Foundation: Based on Bayes’ Theorem.  Performance: A simple Bayesian classifier, naïve Bayesian classifier, has comparable performance with decision tree and selected neural network classifiers  Incremental: Each training example can incrementally increase/decrease the probability that a hypothesis is correct — prior knowledge can be combined with observed data  Standard: Even when Bayesian methods are computationally intractable, they can provide a standard of optimal decision making against which other methods can be measured
  • 33.
    BAYES THEOREM  ConditionalProbability= p(A|B)=p(A n B)/p(B)
  • 34.
    Bayes’ Theorem: Basics Total probability Theorem:  Bayes’ Theorem:  Let X be a data sample (“evidence”): class label is unknown  Let H be a hypothesis that X belongs to class C  Classification is to determine P(H|X), (i.e., posteriori probability): the probability that the hypothesis holds given the observed data sample X  P(H) (prior probability): the initial probability  E.g., X will buy computer, regardless of age, income, …  P(X): probability that sample data is observed  P(X|H) (likelihood): the probability of observing the sample X, given that the hypothesis holds  E.g., Given that X will buy computer, the prob. that X is 31..40, medium income ) ( ) 1 | ( ) ( i A P M i i A B P B P    ) ( / ) ( ) | ( ) ( ) ( ) | ( ) | ( X X X X X P H P H P P H P H P H P   
  • 35.
    Prediction Based onBayes’ Theorem  Given training data X, posteriori probability of a hypothesis H, P(H|X), follows the Bayes’ theorem  Informally, this can be viewed as posteriori = likelihood x prior/evidence  Predicts X belongs to Ci iff the probability P(Ci|X) is the highest among all the P(Ck|X) for all the k classes  Practical difficulty: It requires initial knowledge of many probabilities, involving significant computational cost ) ( / ) ( ) | ( ) ( ) ( ) | ( ) | ( X X X X X P H P H P P H P H P H P   
  • 36.
  • 37.
    NAÏVE BAYES EXAMPLE (OUTLOOK,TEMP)---PLAY(YES/NO) YES NO P(YES) P(NO) SUNNY 2 3 OVERCAST 4 0 RAINY 3 2 TOTAL YES NO P(YES) P(NO) HOT 2 2 MILD 4 2 COLD 3 1 TOTAL OUTLOOK TEMPERATURE YES 9 NO 5 PLAYS TENNIS YES OR NO
  • 38.
    Naïve Bayes Classifier:Training Dataset Class: C1:buys_computer = ‘yes’ C2:buys_computer = ‘no’ Data to be classified: X = (age <=30, Income = medium, Student = yes Credit_rating = Fair) age income student credit_rating buys_computer <=30 high no fair no <=30 high no excellent no 31…40 high no fair yes >40 medium no fair yes >40 low yes fair yes >40 low yes excellent no 31…40 low yes excellent yes <=30 medium no fair no <=30 low yes fair yes >40 medium yes fair yes <=30 medium yes excellent yes 31…40 medium no excellent yes 31…40 high yes fair yes >40 medium no excellent no
  • 39.
    Naïve Bayes Classifier:An Example  P(Ci): P(buys_computer = “yes”) = 9/14 = 0.643 P(buys_computer = “no”) = 5/14= 0.357  Compute P(X|Ci) for each class P(age = “<=30” | buys_computer = “yes”) = 2/9 = 0.222 P(age = “<= 30” | buys_computer = “no”) = 3/5 = 0.6 P(income = “medium” | buys_computer = “yes”) = 4/9 = 0.444 P(income = “medium” | buys_computer = “no”) = 2/5 = 0.4 P(student = “yes” | buys_computer = “yes) = 6/9 = 0.667 P(student = “yes” | buys_computer = “no”) = 1/5 = 0.2 P(credit_rating = “fair” | buys_computer = “yes”) = 6/9 = 0.667 P(credit_rating = “fair” | buys_computer = “no”) = 2/5 = 0.4  X = (age <= 30 , income = medium, student = yes, credit_rating = fair) P(X|Ci) : P(X|buys_computer = “yes”) = 0.222 x 0.444 x 0.667 x 0.667 = 0.044 P(X|buys_computer = “no”) = 0.6 x 0.4 x 0.2 x 0.4 = 0.019 P(X|Ci)*P(Ci) : P(X|buys_computer = “yes”) * P(buys_computer = “yes”) = 0.028 P(X|buys_computer = “no”) * P(buys_computer = “no”) = 0.007 Therefore, X belongs to class (“buys_computer = yes”) age income student credit_rating buys_computer <=30 high no fair no <=30 high no excellent no 31…40 high no fair yes >40 medium no fair yes >40 low yes fair yes >40 low yes excellent no 31…40 low yes excellent yes <=30 medium no fair no <=30 low yes fair yes >40 medium yes fair yes <=30 medium yes excellent yes 31…40 medium no excellent yes 31…40 high yes fair yes >40 medium no excellent no
  • 41.
    Decision Tree Induction:An Example age? overcast student? credit rating? <=30 >40 no yes yes yes 31..40 fair excellent yes no age income student credit_rating buys_computer <=30 high no fair no <=30 high no excellent no 31…40 high no fair yes >40 medium no fair yes >40 low yes fair yes >40 low yes excellent no 31…40 low yes excellent yes <=30 medium no fair no <=30 low yes fair yes >40 medium yes fair yes <=30 medium yes excellent yes 31…40 medium no excellent yes 31…40 high yes fair yes >40 medium no excellent no  Training data set: Buys_computer  Resulting tree:
  • 42.
    Algorithm for DecisionTree Induction  Basic algorithm (a greedy algorithm)  Tree is constructed in a top-down recursive divide-and-conquer manner  At start, all the training examples are at the root  Attributes are categorical (if continuous-valued, they are discretized in advance)  Examples are partitioned recursively based on selected attributes  Test attributes are selected on the basis of a heuristic or statistical measure (e.g., information gain)  Conditions for stopping partitioning  All samples for a given node belong to the same class  There are no remaining attributes for further partitioning – majority voting is employed for classifying the leaf  There are no samples left
  • 43.
    Brief Review ofEntropy  m = 2
  • 45.
    Attribute Selection Measure: InformationGain (ID3)  Select the attribute with the highest information gain  Let pi be the probability that an arbitrary tuple in D belongs to class Ci, estimated by |Ci, D|/|D|  Expected information (entropy) needed to classify a tuple in D:  Information needed (after using A to split D into v partitions) to classify D:  Information gained by branching on attribute A ) ( log ) ( 2 1 i m i i p p D Info     ) ( | | | | ) ( 1 j v j j A D Info D D D Info     (D) Info Info(D) Gain(A) A  