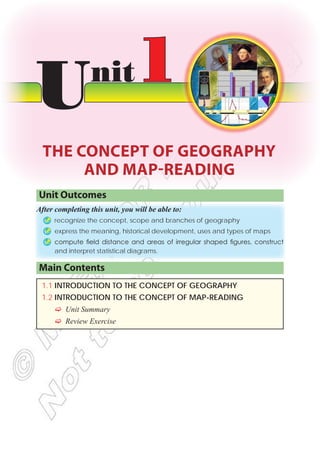
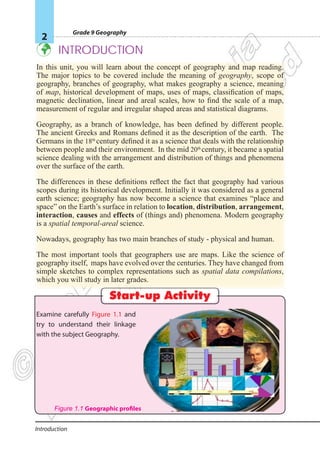
SlideShare a Scribd company logo
1 of 34
Download to read offline
Unit Outcomes
After completing this unit, you will be able to:
Þ
Þ recognize the concept, scope and branches of geography
Þ
Þ express the meaning, historical development, uses and types of maps
Þ
Þ compute field distance and areas of irregular shaped figures, construct
and interpret statistical diagrams.
Main Contents
1.1 INTRODUCTION TO THE CONCEPT OF GEOGRAPHY
1.2 INTRODUCTION TO THE CONCEPT OF MAP-READING
F
F Unit Summary
F
F Review Exercise
Unit1
THE CONCEPT OF GEOGRAPHY
AND MAP-READING
Grade 9 Geography
2
Introduction 
 INTRODUCTION
In this unit, you will learn about the concept of geography and map reading.
The major topics to be covered include the meaning of geography, scope of
geography, branches of geography, what makes geography a science, meaning
of map, historical development of maps, uses of maps, classification of maps,
magnetic declination, linear and areal scales, how to find the scale of a map,
measurement of regular and irregular shaped areas and statistical diagrams.
Geography, as a branch of knowledge, has been defined by different people.
The ancient Greeks and Romans defined it as the description of the earth. The
Germans in the 18th
century defined it as a science that deals with the relationship
between people and their environment. In the mid 20th
century, it became a spatial
science dealing with the arrangement and distribution of things and phenomena
over the surface of the earth.
The differences in these definitions reflect the fact that geography had various
scopes during its historical development. Initially it was considered as a general
earth science; geography has now become a science that examines “place and
space” on the Earth’s surface in relation to location, distribution, arrangement,
interaction, causes and effects of (things and) phenomena. Modern geography
is a spatial temporal-areal science.
Nowadays, geography has two main branches of study - physical and human.
The most important tools that geographers use are maps. Like the science of
geography itself, maps have evolved over the centuries. They have changed from
simple sketches to complex representations such as spatial data compilations,
which you will study in later grades.
Start-up Activity
Examine carefully Figure 1.1 and
try to understand their linkage
with the subject Geography.
Figure 1.1 Geographic profiles
Unit 1: The Concept of Geography and Map-Reading
3
1.1 Introduction To The Concept Of Geography
1.1 INTRODUCTION TO THE CONCEPT OF
GEOGRAPHY
At the end of this section, you will be able to:
Þ
Þ define the term geography;
Þ
Þ describe the development of geography as a discipline;
Þ
Þ determine the scope of geography;
Þ
Þ identify the branches of geography; and
Þ
Þ identify the characteristics that make the subject of geography a science.
Key Terms
³
³ Spatial
³
³ Geography
³
³ Scope
³
³ Development
³
³ Science
1.1.1 Meaning of Geography
What is geography? Do you think that geography has a single universally
accepted definition? Why?
From the ancient Greeks to modern-day geographers, geography has been defined
differently. However, the various definitions share some common ideas.
Here are some of the most important definitions that geographers have proposed:
F
F Eratosthenes (276-196 BC) – Geography is the description of the earth.
F
F Concise Oxford Dictionary (1964) – Geography is the science of the
earth’s surfaces.
F
F Hartshorne, R. (1899-1992) – Geography is a branch of knowledge
that is concerned with the provision of an accurate, orderly and rational
description of distributions on the surface of the earth.
F
F Yeates, M. (1968) – Geography is a science that is concerned with the
rational development and testing of theories that explain and predict
the spatial distribution and locations of (things and) phenomena on the
surface of the earth.
Grade 9 Geography
4
1.1 Introduction To The Concept Of Geography
As you can see, each of these definitions includes the idea that geography studies
the earth. Most of them specify the surface of the earth.
At this level, we will define geography as a branch of science that studies the
earth’s surface and the distribution, arrangement and interaction of natural and
human features and their causes and effects.
1.1.2 The Scope of Geography
What is scope? How wide is geography’s scope?
F
F Scope means the range and variety
of contents which are included in a
subject or field of study. Geography’s
scope is very wide. As the scope is
dynamic, it changes often as new
discoveries and ideas enter the field.
F
F Geography studies a great many
physical and human features of the
world. Its focus includes their causes,
effects, and interactions. As indicated
above, the subjects that geography
examines include features in the
hydrosphere, atmosphere, lithosphere
and biosphere.
Geography has undergone profound changes in its scope and focus:
F
F In ancient times, geography was considered to be the mother of many
other sciences, including philosophy and the earth sciences.
F
F In the 16th
century, geography began to emphasize location, focusing on
questions of where, why and what.
F
F In the mid 18th century, European geographers, especially Germans,
considered the relationship between geography with philosophy. This
approach caused geography to focus on the relationship between human
and the natural environment. Alexander Von Humboldt and Carl Ritter
were among the major contributors to this approach.
F
F In the 19th
century, geographical societies and research groups formed.
They enhanced the role of geography as a discipline.
F
F In the late 20th
century, geography became a spatial science.
Note
The earth’s surface consists of:
Â
 hydrosphere – It includes
all the bodies of water, i.e.,
oceans, rivers, lakes and
others.
Â
 biosphere – This refers to all
living organisms in and on the
earth’s surface.
Â
 atmosphere – It includes all
aspects of air composition
surrounding our planet.
Â
 lithosphere – It is the solid
layer of rocks which covers the
entire surface of the planet.
Unit 1: The Concept of Geography and Map-Reading
5
1.1 Introduction To The Concept Of Geography
1.1.3 Branches of Geography
What are the two branches of geography? Can you list some of the fields of
geography that fall into each of the two branches?
You have studied the definition of geography, and you have considered its scope.
Next you will learn about the main parts of geography – its branches.
They are:
F
F Physical geography
F
F Human geography
					
What does physical geography study?
i Physical Geography: This branch of geography studies the distribution of
the natural features of the world, such as climate, landforms, soil, vegetation,
and drainage systems. Physical geography also considers causes, effects
and interactions of these features.
Physical geography includes the following specialized fields of study:
F
F Climatology: studies factors that create climate and examines the
variation and distribution of climate and related causes and effects.
F
F Geomorphology: studies the distribution of landforms (such as
mountains and plains) and the forces that change them.
F
F Soilgeography:studiesthedistributionofsoilsandtheircharacteristics.
Climatology
Geomorphology
Soil geography
Oceanography
Cultural geography
Population geography
Urban geography
Human geography
Physical geography
Branches
of
Geography
Biogeography
Historical geography
Political geography
Economic geography
Grade 9 Geography
6
1.1 Introduction To The Concept Of Geography
F
F Biogeography: studies the distribution of plants and animals in relation
to the environments that they inhabit.
F
F Oceanography: studies the location, causes and effects of ocean
currents, waves and tides.
What does human geography study? Do you know the sub-branches of human
geography?
ii Human Geography: This branch of geography studies the distribution and
influence of human aspects of our world, including cultures, population
settlement, economic activities and political systems.
Human geography includes these specialized fields of study:
F
F Cultural geography: studies the distribution and interactions of
cultures, including peoples’ beliefs and customs. It also examines the
movement, expansion and interaction of cultures on the surface of the
earth.
F
F Population geography: studies the distribution, growth and structure
of population.
F
F Economic geography: studies production, consumption and exchange and
the spatial distribution of goods and services and factors affecting them.
F
F Political geography: studies the distribution of political systems and
the ways people use them to exercise power and make decisions.
F
F Urban geography: studies the development and characteristics of
towns, cities and other urban centers.
F
F Historical geography: is the study of the geography of the past and how
places or regions change over time.
Activity 1.1
Discuss the following in small groups.
1 Geography studies the distribution and influence of human aspects of our
world including cultures, population, economic activities and political systems.
Do you agree or disagree with this statement? Why?
2 Some people say geography is concerned only with the study of place names.
DO you agree or disagree to such idea? Why?
3 Some people say geography has a limited scope. Do you agree or disagree with
such idea? Why?
Unit 1: The Concept of Geography and Map-Reading
7
1.1 Introduction To The Concept Of Geography
1.1.4 Geography as a Science
What is science? What makes geography a science?
Science is a system of acquiring knowledge through scientific methods.
These methods involve observation, identification, description, experimental
investigation, and theoretical explanation of phenomena.
Geography investigates facts and relationships related to physical and social
phenomena, and examines their distribution across the world and changes over
time.
The main tools geography uses to gather and analyze information are observation,
systematic description, systematic recording and mapping. As you can see from
its subject matter and methodologies, geography is a subject that bridges the
natural and social sciences.
Activity 1.2
In pairs, discuss the following questions:
1 Do you appreciate learning geography? Why?
2 Is geography a science? Why?
3 What are the areas of the study of geography?
4 Write a short report on the relationships between geography and natural and
social science.
 Exercise 1.1
I Determine which of the sentences is True or False.
1 Geography studies physical and human features of the world.
2 Cultural geography studies the distribution of population and factors that
affect their distribution.
3 Human geography deals with human-made features on the earth’s surface,
such as settlements, economic activities and conservation measures.
4 The scope of geography means the extent of geography as a field of study.
Grade 9 Geography
8
1.2 Introduction To The Concept Of Map-reading
II Choose the correct answer.
5 The branch of geography that studies landforms and the forces that shape
them is known as:
A Biogeography
B Oceanography
C Geomorphology
D Soil geography
6 It is the solid layer of rocks which covers the entire surface of the planet.
A Hydrosphere
B Atmosphere
C Biosphere
D Lithosphere
7 One of the following is not a branch of human geography
A Political geography
B Urban geography
C Biogeography
D Historical geography
8 It is a branch of human geography that studies the distribution, growth and
structure of population.
A Cultural geography
B Historical geography
C Political geography
D None of the above
9 One of the following is a branch of physical geography:
A Climatology
B Soil geography
C Oceanography
D All are correct
III Give short answers to the following questions.
10 What are the two major branches of geography?
11 What is the serious concern of geographical study?
12 Which branch of geography studies the distribution of plants and animals
in relation to the environments that they inhabit?
13 What does political geography study?
14 What does physical geography study?
1.2 INTRODUCTION TO THE CONCEPT OF
MAP-READING
At the end of this section, you will be able to:
Þ
Þ explain the meaning of a map;
Þ
Þ appreciate the historical development of maps;
Þ
Þ state the basic uses of maps;
Unit 1: The Concept of Geography and Map-Reading
9
1.2 Introduction To The Concept Of Map-reading
Þ
Þ categorise maps based on scales and purposes;
Þ
Þ distinguish the conventional signs and symbols used to represent different
features on maps;
Þ
Þ identify some of the marginal information given on maps;
Þ
Þ convert linear scale to areal scale;
Þ
Þ calculate the scale of a map;
Þ
Þ calculate the areas of regular and irregular shaped figures by referring to
the scale of a map;
Þ
Þ construct statistical diagrams using simple line graphs, bar graphs and pie
charts based on the provided data.
Key Terms
³
³ Latitude
³
³ International Grid Reference (IGR)
³
³ National Grid Reference (NGR)
³
³ Magnetic declination
³
³ Remote sensing
³
³ Global Positioning System (GPS)
³
³ Geographical Information System (GIS)
³
³ Longitude
Start-up Activity
What is the actual distance between points X and Y?
Figure 1.2 Map of Africa
Grade 9 Geography
10
1.2 Introduction To The Concept Of Map-reading
1.2.1 Meaning of Map
What is a map? Do you remember what you have learned in previous grades
about map?
Here is a simple definition:
A map is a simplified, diminished, plain representation of all or part of the
earth’s surface as viewed from vertically above.
Here are the main features of maps:
F
F A map represents all or part of the earth’s surface.
For example, a map might show a city such as Addis Ababa, the entire
world, or a section of a garden.
F
F A map is a two-dimensional (plane) representation.
For example, a map might be printed on a piece of paper.
F
F Maps show the earth’s surface as if it were seen from directly above.
This view is called a bird’s-eye view.
F
F All maps are smaller than the area they represent.
F
F Maps are drawn to scale. In other words, the features shown on a map
have the same relative proportions as they do in reality.
For example, if one mountain’s diameter is twice as large as that of
another mountain, the first mountain would be shown on a map as twice
as large as the second.
F
F Maps are simplified representations.
F
F Most maps use generally accepted symbols to represent natural,
artificial or cultural features of the area they represent. They also use
conventional notations to provide background information such as the
map’s title, date and scale.
Activity 1.3
Discuss the following question and perform the following tasks in your group.
1 What does this mean:“A map is a two-dimensional plane representation”?
2 Compare and contrast maps and globes.
3 Prepare sketch map of your locality and show on the map the settlement
pattern in the locality.
Unit 1: The Concept of Geography and Map-Reading
11
1.2 Introduction To The Concept Of Map-reading
1.2.2 Historical Development of Maps
Describe the historical development of maps. How do traditional and modern
map-making differ from each other?
Maps are among our oldest tools. People created maps even in primitive times.
For instance, men and women sketched their routes to hunting, fishing and
gathering grounds.
Today, we also prepare maps, for many purposes. However, map-making has
passed through many stages of development since its beginning. The two main
stages of the historical development of map-making are:
Â
 Traditional map-making
Â
 Modern map-making
A Traditional map-making
What are the major features of traditional map-making? How did people
represent the environment on maps in the past?
The art of traditional map-making is as old as the human race. Traditional maps
have been made in many ways. For example, early map materials included sticks,
shells, clay tablets, parchment, paper and solid plates of silver.
Many traditional maps were locational. For example, they have shown the
locations of water holes and hunting grounds and have included paths that led to
these places.
Focus
In traditional map-making, collecting measurements of distances,
directions, areas and locations was one of the greatest challenges. Each
measurement was be made by hand, through field work in the area being
mapped. This process was laborious and tiresome. Often the accuracy of
the resulting information is imperfect and therefore not fully dependable.
Another main difference between traditional and modern maps is that a
traditional map might include drawings of three-dimensional objects. As a result,
Grade 9 Geography
12
1.2 Introduction To The Concept Of Map-reading
a traditional map might be somewhat pictographic (or physiographic) rather than
strictly diagrammatic. Most traditional maps are sketch maps. For example, look
at this ancient world map that Eratosthenes drew.
B Modern map-making
When did modern map-making start? What features characterize modern
map-making? What is the role of GIS in modern map-making?
The modern science of map-making has its basis in the 17th
century. The various
developments that took place during the Renaissance gave way to accurate map-
making (cartography). Furthermore, advancements in science and technology
resulted in the invention of better cameras and airplanes specially designed to
take aerial photographs. Today, map-makers have diverse opportunities to acquire
spatial information. In addition to aerial photography, satellite imagery provides
a wealth of information.
Nowadays, computers have come to be “close friends” of map-makers. This is
because they have become in valuable in making maps. In the last three decades
of the 20th
century computers have been seen as integral part at almost every stage
of the cartographic process. They play roles in the collection, storage, analysis,
and presentation of data, and even in the mapping and reproduction of maps.
This makes the Geographic Information System (GIS) indispensable to modern
map-making.
Eratosthenes (276 BC-194 BC)
EratostheneswasaGreekmathematician,
geographer and astronomer.
In 200 BC, Erastosthenes adopted a word
geography, which means a description
of the earth.
Figure 1.3 Eratosthenes’map
Unit 1: The Concept of Geography and Map-Reading
13
1.2 Introduction To The Concept Of Map-reading
AGIS needs a geographic database of, for example, a digital record of geographic
information. The first step in developing a GIS is to create the geographic database
from such sources as maps, field surveys, aerial photographs, satellite imagery,
and so forth.
Generally, modern map-making is fast and uses modern ways and means of
collecting information, such as specially designed airplanes, remote sensors and
the Global Positioning System (GPS).
Activity 1.4
In a small group, discuss the following questions.
1 What are the major characteristics of modern map-making?
2 What are the components of GIS?
1.2.3 Uses of Maps
Why are maps very important in geography? What are the major uses of maps?
As you know, the map is geography’s most important tool. It is also one of the
most flexible tools in terms of the information it presents and the uses we can
make of it. For example, it can present very simple information or highly detailed
results from a complicated geographical investigation. Maps are basically used
for identifying locations, distance, area and direction.
Location: With the help of a map it is possible to locate a place in reference to
another place. For example, Ethiopia’s location can be expressed in terms of its
neighbouring countries, external land masses and water bodies.
It is also possible to locate a place using astronomical grid references – parallels
and meridians. For example, the absolute location of Ethiopia is 3o
N-15o
N latitude
and 33o
E-48o
E longitude.
Distance: It is possible to calculate the distance between two or more places on
a map. This is done by using the scale of the map. For example, the air distance
between Bahir Dar andAddisAbaba can be calculated by using a map of Ethiopia.
Area: The area of a place, a country, a region, a continent, a sub-continent or the
whole world can be calculated from a map. This is done by measuring the length
and the width of the given place on the map and by converting them to ground
distances with the help of the scale of the map.
Grade 9 Geography
14
1.2 Introduction To The Concept Of Map-reading
Direction: A map can enable us to identify the direction and bearing of any place
on the map. This is accomplished by referring to another place. For example,
a map of Ethiopia can help us to find the direction and bearing of Mekele by
referring to Addis Ababa.
In addition to these, maps can be used to:
F
F Show the distribution of physical and human phenomena on the
earth’s surface: distribution maps show the locations of phenomena on
the earth’s surface. For example, we use distribution maps for Ethiopia
to show the presence of human and animal populations, minerals, and
vegetation. Similarly, we use distribution maps to show patterns of
settlement, temperature, and health conditions.
F
F Show surface configuration: topographic maps give information
about variations in height on the earth’s surface. For example, they
show heights and depths of valleys, plains and mountains.
F
F Offer visual comparisons: because the earth’s surface is vast, it
is difficult to compare places by direct observation. For example, it
would be difficult to compare the distribution of landforms in Ethiopia
and Kenya, even from an airplane. However, by offering us relatively
small but accurate representations of the two countries, maps solve this
problem completely.
F
F Support development planning: Maps can provide planners with
vital information to plan for the future. For example, maps can show
current conditions and ongoing trends, and they can help us predict a
nation’s socioeconomic conditions. Such information is invaluable to
the country’s planners as they analyze possibilities and livelihoods and
then prepare for the future.
Activity 1.5
Look at the map in Figure 1.2 and perform the following tasks and answer the
following question.
1 Write down the relative location of Ethiopia.
2 Which neighbouring country is located south of Ethiopia?
Unit 1: The Concept of Geography and Map-Reading
15
1.2 Introduction To The Concept Of Map-reading
1.2.4 Classification of Maps
How many types of maps do you know? Do you think that all maps are one and
the same? Why?
Although most maps have similar characteristics, they can differ from one another
in many ways.
This topic teaches you how to classify maps in terms of the following features:
F
F Focus and level of detail (purpose) – the amount of information they
present about their subjects, especially their ability to show small
details.
F
F Scale – the size of the area for which they give information and,
therefore, the scope of the information that they give about these areas.
Classification Based on Purpose:
Maps can be classified as general-purpose or specific-purpose.
General-Purpose Maps
What are general-purpose maps? What are they used for? List uses of
topographic maps.
A general-purpose map is a map that shows the features of a place in a relatively
general way. It provides a wide range of information about the place it represents.
General-purpose maps are not topical. Instead, they tend to contain a little of many
kinds of information at a relatively low level of detail. Topographic information
of each kind in lesser detail. A topographic map is a good example of this. It can
illustrate both physical and human-made features of the earth.
Focus
General-purpose maps are prepared to provide a wide range of information
about different features of an area. They contain a little information of
each kind about the area they represent. Their ability to provide different
information is their advantage, whereas their weakness is to show limited
detailed information.
Grade 9 Geography
16
1.2 Introduction To The Concept Of Map-reading
Specific−Purpose Maps
What kind of map is a specific-purpose map? How does it differ from a general-
purpose map?
Specific-purpose maps are often called thematic maps or topical maps. We use
these terms because specific-purpose maps emphasize on a single topic. These
maps show detailed information about their subjects. Thematic maps can show
almost any kind of information that varies from place to place, such as population
distribution, rainfall and temperature patterns, and the distribution of types of soil
or vegetation.
F
F Soil maps
F
F Vegetation maps
F
F Climate maps
Focus
Specific-purpose maps are thematic/topical maps. They usually show a
high level of detail and have a deep focus on their subjects. Many specific-
purpose maps are created for specialists in particular subjects.
Classification by Scale
Scale is a ratio that shows the degree to which the area that is mapped has been
reduced. Based on scale differences, maps can be classified into:
F
F Large-scale maps
F
F Medium-scale maps
F
F Small-scale maps
Let us now consider each of these types of map in more detail.
Large-Scale Maps ≥ 1:50,000
What are large scale maps?
Large-scale maps present small areas in detail with great accuracy.
Large-scales are greater than or equal to 1:50,000. A large-scale map, such as the
map of Addis Ababa, shows the city in considerable detail.
Unit 1: The Concept of Geography and Map-Reading
17
1.2 Introduction To The Concept Of Map-reading
Large scale maps present a relatively small area and show its features in consider-
able detail. For example, at a scale of 1:5,000, a map of a city can include many
features – such as buildings. The map can also include many details, such as the
bends in highways.
Medium-Scale Maps 1:50,000 - 1:250,000
What are medium-scale maps?
These are maps that are prepared with scales that range between 1:50,000 and
1:250,000. Medium-scale maps cover wider areas than large scale maps, but
cover smaller areas than small-scale maps. They are also able to present more
detailed information than small-scale maps but are less detailed than large-scale
ones.
Small-Scale Maps ≤ 1:250,000
What are small-scale maps?
Small-scale maps are those which are prepared with scales less than or equal to
1:250,000. These small–scale maps cover wider areas than large and medium
scale maps.
Focus
Large-Scale maps 		 Small-Scale Maps
Â
 Scale: ≥ 1: 50,000
Â
 Cover small areas
Â
 Contain highly detailed information
Â
 Scale: ≤ 1:250,000
Â
 Cover large areas
Â
 Contain less-detailed information
Medium-Scale Maps
Â
 Scale: between 1:50,000 and 1:250,000
Â
 Cover medium sized areas
Â
 Contain moderately detailed information
Grade 9 Geography
18
1.2 Introduction To The Concept Of Map-reading
Activity 1.6
In pairs, discuss the following questions.
1 Do you know how a map-maker can reduce the size of ground objects while
making maps?
2 Compare and contrast large and small scale map?
3 Compare the scale of 1 : 25,000 with 1 : 250,000. Which one is a smaller scale?
Why?
1.2.5 Marginal Information of Maps
What is a map’s margin? What are the most common types of information that
are found in the margin of a map?
Maps are used to convey information. To read maps effectively, map users need
information about the map. Such information is presented in the map’s margins
and is known as marginal information.
Marginal information includes:
F
F Title of the map: Gives the map’s name. For example, “Soil Map”
explains that the map presents information about soil.
F
F Year of publication: identifies the year in which the map was published.
Because this information tells you how old the map is, you might be able
to judge whether the map’s contents are current or might be out of date.
F
F Author: identifies the copyright owner of the map and indicates who (or
what organization) has prepared the map.
F
F Place of publication and publisher: tells where the map was published
and identifies the organization that published the map.
F
F Scale: This information indicates the extent to which the area that is
represented in the map has been reduced.
F
F Legend/Key: explains the meaning of the signs and symbols used in the
map.
F
F Type of projection: tells the kind of projection used in making the map.
F
F Direction or orientation (North) arrow: Shows the north direction on
the map.
F
F The magnetic declination (variation): is the difference between
Magnetic North and True North. This will be explained later in this
unit.
Unit 1: The Concept of Geography and Map-Reading
19
1.2 Introduction To The Concept Of Map-reading
Conventional Signs and Symbols
How do maps show different features of the earth? What do map-makers use
to represent the different physical and human features on maps?
Geographers have developed a standard set of symbols and other graphic
conventional signs to represent features shown on maps. Conventional signs and
symbols are those signs and symbols that are used on maps through the agreement
of all map-makers of the world. They are used to represent the same detail on a
map in all the countries of the world.
Signs and symbols help the map reader to understand maps. Therefore, the map
reader has to look first at the key or legend of the map.
When you create a map, the symbols you select should satisfy the following
requirements.
F
F They should be uniform throughout the map.
F
F They should be easy to read and understand.
F
F The space occupation, orientation and size of the symbols should be
constant.
Here are some of the symbols and conventional signs that are widely used and
understood worldwide:
F
F cities and towns are indicated by dots or patches of shading;
F
F streams and bodies of water are often printed in blue; and
F
F political boundaries are shown by dot lines/solid lines.
Table 1.1: Conventional signs and symbols
Symbol Description
All-weather road
Bridge
Permanent lake
Plantation
Mine
Grade 9 Geography
20
1.2 Introduction To The Concept Of Map-reading
Map Scale
What is map scale? Why do we need map scales?
The scale of a map is the ratio between the measurement of distance on the map
and the corresponding measurement on the earth’s surface.
For instance, the ratio of the map distance between two cities on a map and
the actual distance between the two corresponding cities on the earth is
the scale to which that map is drawn.
Grid References
What is a grid reference? Why is it important? What is the difference between
a geographic grid and a national grid reference?
A map grid is a set of imaginary lines that divides the earth’s surface into regular
grids.
There are two major map grid systems:
Â
 International (Geographic) Grid System
Â
 National Grid System
The International (Geographic) Grid System shows the absolute locations of
places on the surface of the earth.
Its references are made up of:
F
F parallels or lines of latitude – define locations north and south of the
equator. They are horizontal lines of the grid.
F
F meridians or lines of longitude – define locations east and west of an
imaginary north-south map line called the Prime Meridian. They are
vertical lines of the grid.
Latitude: When looking at a map, latitude lines run horizontally. Lines of latitude
are also known as parallels since they are parallel and are an equal distant from
each other. Each degree of latitude is approximately 111 km apart. Degrees of
latitude are numbered from 0° to 90° north and south. Zero degree is the equator,
the imaginary line which divides our planet into the northern and southern
hemispheres. 90° north is the North Pole and 90° south is the South Pole.
Unit 1: The Concept of Geography and Map-Reading
21
1.2 Introduction To The Concept Of Map-reading
Longitude: The vertical lines of longitude are also known as meridians. They
converge at the poles and are widest at the equator (about 111 km apart). Zero
degrees longitude is located at Greenwich (0°). The degrees continue 180° east
and 180° west where they meet and form the International Date Line in the Pacific
Ocean.
Parallels and meridians are imaginary lines. Latitudes are angular distances
measured to the north and south of the equator in degrees, minutes and seconds.
Longitudes are also angular distances, but they are measured to the east and west
of the Greenwich meridian.
Try to explore how lines of latitudes and longitudes create a grid network on the
following map.
The National Grid Systems: is used on maps of individual countries and regions
within them. Its references differ from those of the International (Geographic)
Grid System.
The National Grid System uses eastings and northings. Eastings are lines that are
drawn from north to south. Northings are lines that are drawn from east to west.
0O
30O
W
60O
W
90O
W
120O
W
150O
W
180O
W 30O
E 60O
E 90O
E 120O
E 150O
E 180O
E
0O
30O
N
30O
S
60O
N
90O
N
60O
S
90O
S
Figure 1.4 The Geographic Grid System
Grade 9 Geography
22
1.2 Introduction To The Concept Of Map-reading
Eastings and northings in the National Grid System originate from the “False
Grid Origin” that lies at the southwestern corner of the place they cover. While
the values of eastings increase eastwards, the values of northings increase
northwards. Eastings and northings are measured in kilometres.
In Ethiopia, there are two ways of giving national grid reference. They are four-
digit and six-digit grid reference. Eastings are always given before northings.
For example, the six-digit grid reference of letter A is 490970.
97
0000
98
0000
99
0000
95
0000
470000
480000
490000
500000
470000
480000
490000
500000
96
0000
97
0000
98
0000
99
0000
95
0000
96
0000
A
Figure 1.5 Map of Addis Ababa
Unit 1: The Concept of Geography and Map-Reading
23
1.2 Introduction To The Concept Of Map-reading
Magnetic Declination
What is magnetic declination? What is magnetic north? What about true north?
The earth has north and south geographic poles at the northern and southern
convergence points of the meridians. It also has north and south magnetic poles.
Magnetic compasses that are used in navigation point towards the north magnetic
pole, rather than the geographic North Pole.
Magnetic declination is the difference between magnetic north and true north. It
is the angle between magnetic north and true north from a particular point on the
earth’s surface.
The position of the north magnetic pole moves over time. Therefore, the
declination factor must be updated from time to time. However, a relatively new
navigation device, the gyrocompass, is adjusted so that it points to the geographic
North Pole directly that it does not need this compensating factor.
The amount, direction, and annual change of the variation for most localities on
the surface of the earth has been determined, and this data is recorded.
Figure 1.6 Magnetic Declination
Grade 9 Geography
24
1.2 Introduction To The Concept Of Map-reading
Activity 1.7
Perform the following tasks in your group.
1 Find a political map of Ethiopia and discuss the marginal information in the
class.
2 Sketch a map of your school compound. Use a scale and symbols.
1.2.6 The Relationship Between Linear and
Areal Scale
What is linear scale? What about areal scale? Is it possible to convert one into
the other? How?
F
F Map scale can be linear or areal.
F
F Linear scale expresses the ratio of map distance to ground distance. It
is the most common scale type.
F
F Areal scale shows the relationship between map area and ground area.
Areal scale is the square of linear scale. For example, if a map has a linear scale
of 1 cm to 6 km, then the areal scale of the map is (1 cm)2
to (6 km)2
, which means
1 cm2
to 36 km2
.
To calculate linear scale from areal scale, you put the areal scale into a square
root. For instance, if the areal scale of a map is 1 cm2
to 36 km2
, then the linear
scale of the map is the square root of the given areal scale, as shown below.
Areal Scale = =
(Linear Scale)
2
2
Distance on the map
Distance on the Ground
( )
Linear Scale = Areal scale=
Map Area
Ground Area
= 2
2
km
36
1 cm
= 1 cm to 6 km
Unit 1: The Concept of Geography and Map-Reading
25
1.2 Introduction To The Concept Of Map-reading
Focus
Areal scale is the square of linear scale. On the other hand, linear scale is
the square root of areal scale. Therefore, if a certain linear scale is doubled,
then its areal scale equivalent would be four times larger than its original
scale.
Activity 1.8
Perform the following tasks.
1 Find the areal scale for the following:
a 1 cm to 2 km
b 1 : 100,000
c 5 cm to 25 km
d 3 cm to 9 km
2 Find the linear scale for the following:
a 4 cm2
to 400 km2
b 4 cm2
to 16 km2
c 5 cm2
to 500 m2
d 1 cm2
to 4 km2
1.2.7 How to Find the Scale of a Map
Is it possible to calculate the scale of a map when it is not given? How?
In principle, every map should show the scale to which it has been drawn. If the
scale is not shown, we can calculate it.
There are two ways of finding a map scale, if it is not given:
A By using the known distance between two points on the map
This method is used if the ground distance between two points or places shown
on the map is given. Then use the following procedure to obtain the scale:
i Measure the distance between the two points on the map in centimeters.
ii Divide the obtained distance on the map by the ground distance to obtain
the ratio between the two. This gives you the scale of the map.
Grade 9 Geography
26
1.2 Introduction To The Concept Of Map-reading
To understand this better see the following example.
Let us say, if the straight-line distance betweenAddisAbaba and Mekele is 555 km.
Using Figure 1.7, calculate the scale of the map:
Â
 Using the distance between Addis Ababa and Mekele:
i Measure the distance between Addis Ababa and Mekele by using a
ruler approximately 3 cm.
The given air distance between the two places is 555 km.
ii Find the ratio between the distance on map and the actual distance.
This is the scale.
3 cm to 555 km = 1 cm to 185 km = 1 : 18,500,000.
B By using latitudes
In this method, the scale of the map can be obtained by using the values of
latitudes.
Figure 1.7 Map of Ethiopia
Scale =
Ground distance
Distance measured on the map
Unit 1: The Concept of Geography and Map-Reading
27
1.2 Introduction To The Concept Of Map-reading
For example, let us calculate the scale of Figure 1.7 by using the 5o
and 10o
N
latitude lines:
1 The degree difference between the two latitudes is 5o
(10o
– 5o
).
2 The distance that 5o
represents is 555 km (111 km × 5).
3 The distance between the two latitudes on the map is approximately 3 cm.
4 The scale of the map is, therefore:
Focus
1o
latitude is about 111 km
This relationship is derived from the circumference of
the earth – 40,000 km.
If 360o
= 40,000 km
1o
= ?
= 111 km
Activity 1.9
Answer the following questions in your group.
1 Thegrounddistancebetweentwoplacesis100km.Ifthisdistanceisrepresented
by 5 cm on a map, what is the scale of the map?
2 If two places on the ground that are located 5o
north and 10o
north are shown
10 cm apart on a given map, what is the scale of the map?
Scale =
Distance on the Map
Ground Distance
=
km
555
cm
3
= 1 cm to 185 km
1: 18,500,000
o
o
1 40,000kms
360
×
=
Grade 9 Geography
28
1.2 Introduction To The Concept Of Map-reading
1.2.8 The Measurement of Regular and
Irregular Shaped Areas
Do you think that we can tell how large an area is from a map? If so, how can
we measure it?
Some areas have regular or geometric shapes, such as rectangles, triangles, circles
and squares. Others have irregular or non-geometric shapes.
This procedure is important for measuring areas on maps:
1 Measure the area of the feature on the map;
2 If the map scale is linear, convert it to areal;
3 Using the areal scale, convert the area on the map to actual ground
area by using cross multiplication.
Measuring Regular-Shaped Areas
A regular shape is a geometrical shape such as a circle, triangle or square. If you
are measuring an area with a regular shape, use the mathematical formula for its
geometric shape. Then calculate the ground area by using the map’s areal scale.
The following table gives you some of geometric formulae for calculating the
areas of regular shapes.
Table 1.2: Geometrical formula
Regular-shaped areas Mathematical formula
Square
A = S2
;
where A = area, and S = side
Rectangle
A = l × w;
where A = area, l = length, and w = width
Right angle triangle
A = ½ bh;
where A = area, b = base, and h = height
Circle
A = πr2
;
where A = area, and r = radius. (π = 3.14 )
Unit 1: The Concept of Geography and Map-Reading
29
1.2 Introduction To The Concept Of Map-reading
What is the ground area of the farmland?
In the above sketch, the farm has a regular shape.
F
F Measure the length and width of the rectangle on the map. Obtain
its area on the map by multiplying the length by the width (area of
rectangle = l × w ). This gives you the area of the farm on the map.
F
F Change the linear scale, which is 1 cm to 2 km, into areal scale by
squaring it. This gives you the areal scale :1 cm2
to 4 km2
.
F
F Convert the map area into ground area by using cross multiplication.
In other words, if 1 cm2
is to 4 km2
, then what will 8 cm2
be?
This gives you the ground area of the farm 32 km2
.
Without changing the given linear scale into areal scale, it is possible to calculate
the area.
2cm 2km
L 4km
1cm
×
= = and
4cm 2km
W 8km
1cm
×
= =
Area = L × W
Area = 4 km × 8 km
= 32 km2
Therefore, the area of the farm land is 32 km2
.
Measuring Irregular-Shaped Areas
If the feature to be measured has an irregular shape, its area cannot be directly
calculated by using mathematical formulae. For example, the lake in Figure 1.9 has
an irregular shape. In such cases, we can use the grid square method to measure
the area of the lake on the map.
Figure 1.8 A sketch map of a farm
Farm land
2
cm
4 cm
Scale = 1 cm to 2 km
Grade 9 Geography
30
1.2 Introduction To The Concept Of Map-reading
To better understand this, let us see how the area of the lake is measured. (See
Figure 1.9)
In order to find the area of the lake, we follow the following steps:
1 Copy the boundary of the lake.
2 Draw grid lines at a uniform interval (for example, 1 cm apart) over
the lake.
3 Count the number of grid squares within the lake:
K
K number of full squares = 4
K
K number of ¾ squares = 5 × ¾
K
K number of ½ squares = 4 × ½
K
K number of ¼ squares = 1 × ¼
Thus, total number of squares = 4 + 5 × ¾ + 4 × ½ + 1 × ¼ = 10
4 Calculate the approximate area of the lake.
a First, find the area of one square by using the scale.
			area = S2
= 1 cm × 1 cm = 1 cm2
or 2 km × 2 km = 4 km2
b Then, calculate the total area of the lake.
			 If one square = 4 km2
10 square = ?
		 The approximate area of the lake is 40 km square.
Activity 1.10
Answer the following questions in your group.
1 The base and height of a right angle triangle are 3 cm and 6 cm, respectively.
The scale is 1 cm to 2 km. What is the ground area of the right angle triangle?
2 The radius of a circle is 4 cm. The scale is 1 cm to 5 km. What is the ground area
of the circle.
Scale = 1 cm to 2 km
Lake
Figure 1.9 A sketch map of a lake
Unit 1: The Concept of Geography and Map-Reading
31
1.2 Introduction To The Concept Of Map-reading
1.2.9 Statistical Diagrams
What is “statistics”? What are statistical diagrams?
Statistics is a branch of mathematics that deals with the collection, organization,
and analysis of numerical data. “Statistics” also refers to a collection of numerical
information about a particular feature. Information such as the amount of crop
that is produced, the growth rate of population, or the number of unemployed
people in an area are all statistical figures because they present situations in terms
of numbers.
In geography, such statistical figures are presented by using statistical diagrams.
Statistical diagrams are pictorial representations of numerical information. Charts,
graphs and diagrams are examples of statistical diagrams. By using statistical diagrams,
geographers make information easier to present and understand. It is easier to make
comparisons, see trends (changes over time) and draw conclusions. Statistical diagrams
are particularly important tools for presenting large amounts of statistical data.
In this section, you will learn about some of these statistical diagrams:
Â
 Simple line graphs
Â
 Simple bar graphs
Â
 Pie charts
Simple Line Graph
What is a line graph?
A line graph uses lines to show changes over time. It is also used to show the
relationship between two sets of information/phenomena.
The line graph shown in Figure 1.10, illustrates the data presented in Table 1.3. It
shows the changes in population size of Africa from 1750 to 2050.
The graph can also help you to compare periods of actual and projected population
growth on the African continent.
In the graph, the x-axis represents years, and the y-axis represents population
size.
Steps used to draw a line graph:
1 The horizontal axis is normally used to represent an independent variable,
i.e. time, while the vertical axis to represent dependent variable, such as
temperature and other qualities or values.
Grade 9 Geography
32
1.2 Introduction To The Concept Of Map-reading
2 The base of the vertical scale should be at zero, and the top should be
slightly higher than the maximum value to be recorded on it.
3 Use small crosses or dots to mark values, when plotting the graph.
Table 1.3: Growth of the African Population (1750-2050)
Year 1750 1800 1850 1900 1950 2000 2050
Population
(x millions)
106 107 111 133 228 797 1,846
Source: Microsoft Encarta (2008)
As we have already indicated, similar line graphs can be used to present a variety
of data in relation to time – for example, changes in temperature, employment,
and production.
Simple Bar Graph
What is a bar graph?
A bar graph is another graphical tool for displaying statistical data. It uses
horizontal or vertical bars to show different amounts of the same item or different
values for the same phenomenon. The heights or lengths of the bars on a graph
are proportional to the quantities they represent.
Such a graph might show how amounts or values differ from place to place or as
they change over time.
0
500
1000
1500
2000
1750
1800
1850
1900
1950
2000
2050
Growth of the African Population
(1750 - 2050)
Year
Population
size
Figure 1.10 Growth of the African Population (1750 - 2050)
Unit 1: The Concept of Geography and Map-Reading
33
1.2 Introduction To The Concept Of Map-reading
For example, a bar graph can be used to show the number of people living in each
continent or to show how rainfall varies from month to month in a certain place.
The following bar graph has been prepared based on the data given in Table 1.4.
It shows how the world’s population is distributed in six regions of the world.
Steps used to draw a simple bar graph.
1 The horizontal scale usually represent the independent variable, more
specifically when the time element is of significant, such as when graphing
mean monthly rainfall or annual production.
2 All bars must start at zero and bar graphs drawn for the purposes of
comparison must be drawn on the same scale.
3 When vertical bars are drawn, the time sequence should be from left to right.
4 The width of the bar is a matter of choice. However, avoid bars that are too
thick or too thin.
5 The value of each bar can be assessed more easily if a space or gap is left
between each bar.
Table 1.4: World Population by Region (2009)
Region Africa Asia Europe
L. America and
the Caribbean
N. America Oceania
Population
(in millions)
999 4,117 738 580 341 36
Source: Population Reference Bureau (2009)
0
500
1000
1500
2000
2500
3000
3500
4000
4500
World Population Distribution
by Region (2009)
Population
in
million
Region
Figure 1.11 World population by region (2009)
Grade 9 Geography
34
1.2 Introduction To The Concept Of Map-reading
As indicated earlier, bar graphs, like the one in the previous example, let you
compare a single feature as it exists in different places or as it changes over time.
For example, they can represent such statistical data as annual rainfall distribution
on a monthly basis. The mean monthly distribution of rainfall in Addis Ababa can
be shown as follows. The graph in Figure 1.12 has been drawn using the data
given in Table 1.5.
Table 1.5: Monthly average rainfall of Addis Ababa, 2009
Month J F M A M J J A S O N D
Rainfall (mm) 21.3 2.7 28.4 80.6 58.9 82.6 349.9 388.3 112.9 45.8 44.4 0.0
Source: CSA Ethiopian Statistical Abstract, 2009
Using the graph, you can identify which months are the wettest and which are
the driest.
Pie Chart
What is a pie chart? What are they used for?
Pie charts are circle graphs. They use segments of the circle to show the sizes of
the items that make up its subject. The segments are shaped like the slices of a
pie.
0
100
200
300
400
J F M A M J J A S O N D
Monthly Distribution of
Rainfall in Addis Ababa, 2009.
Months of the year
Rainfall
(mm)
Figure 1.12 Monthly Average Rainfall of Addis Ababa

More Related Content

Similar to Unit 1 geography map reading for children.pdf

What is Geography, Branches of Geography and Scope of Geography.
What is Geography, Branches of Geography and Scope of Geography.What is Geography, Branches of Geography and Scope of Geography.
What is Geography, Branches of Geography and Scope of Geography.Muhammad Saad
 
Geography - Definition, history and types
Geography - Definition, history and typesGeography - Definition, history and types
Geography - Definition, history and typesMuhammad Yousaf
 
Week 2_Introduction to Physical Geography.pptx
Week 2_Introduction to Physical Geography.pptxWeek 2_Introduction to Physical Geography.pptx
Week 2_Introduction to Physical Geography.pptxRalphNavelino2
 
Pedagogy of School Subject Geography
Pedagogy of School Subject GeographyPedagogy of School Subject Geography
Pedagogy of School Subject GeographyMonika Tayade
 
Physical Geography-Course 1. Natural.pptx
Physical Geography-Course 1. Natural.pptxPhysical Geography-Course 1. Natural.pptx
Physical Geography-Course 1. Natural.pptxAbdinasirAhmedMohame2
 
SF Nyambi Geography Introduction. (1)(1).pptx
SF Nyambi Geography Introduction. (1)(1).pptxSF Nyambi Geography Introduction. (1)(1).pptx
SF Nyambi Geography Introduction. (1)(1).pptxSikhulekile Nyambi
 
Dichotomy and Dualism
Dichotomy and DualismDichotomy and Dualism
Dichotomy and DualismDeepuRoy9
 
Ncert11geog1
Ncert11geog1Ncert11geog1
Ncert11geog1jethuweb
 
5 themes of geography
 5 themes of geography 5 themes of geography
5 themes of geographyRoi Fernandez
 
file_1622440466657.pdf
file_1622440466657.pdffile_1622440466657.pdf
file_1622440466657.pdfhabtamu292245
 
312 introduction to geog f1
312 introduction to geog f1312 introduction to geog f1
312 introduction to geog f1michaelnjogu
 
Relationship of Geography with Other Disciplines
Relationship  of  Geography  with  Other Disciplines Relationship  of  Geography  with  Other Disciplines
Relationship of Geography with Other Disciplines Lyn Gile Facebook
 

Similar to Unit 1 geography map reading for children.pdf (20)

BEED322-TeaSoc2-Geography.pptx
BEED322-TeaSoc2-Geography.pptxBEED322-TeaSoc2-Geography.pptx
BEED322-TeaSoc2-Geography.pptx
 
What is Geography, Branches of Geography and Scope of Geography.
What is Geography, Branches of Geography and Scope of Geography.What is Geography, Branches of Geography and Scope of Geography.
What is Geography, Branches of Geography and Scope of Geography.
 
Presentation thouth
Presentation thouthPresentation thouth
Presentation thouth
 
Basic geography
Basic geographyBasic geography
Basic geography
 
Geography - Definition, history and types
Geography - Definition, history and typesGeography - Definition, history and types
Geography - Definition, history and types
 
What Is Geography
What Is GeographyWhat Is Geography
What Is Geography
 
Week 2_Introduction to Physical Geography.pptx
Week 2_Introduction to Physical Geography.pptxWeek 2_Introduction to Physical Geography.pptx
Week 2_Introduction to Physical Geography.pptx
 
Pedagogy of School Subject Geography
Pedagogy of School Subject GeographyPedagogy of School Subject Geography
Pedagogy of School Subject Geography
 
Geography discussion
Geography discussionGeography discussion
Geography discussion
 
Physical Geography-Course 1. Natural.pptx
Physical Geography-Course 1. Natural.pptxPhysical Geography-Course 1. Natural.pptx
Physical Geography-Course 1. Natural.pptx
 
SF Nyambi Geography Introduction. (1)(1).pptx
SF Nyambi Geography Introduction. (1)(1).pptxSF Nyambi Geography Introduction. (1)(1).pptx
SF Nyambi Geography Introduction. (1)(1).pptx
 
Dichotomy and Dualism
Dichotomy and DualismDichotomy and Dualism
Dichotomy and Dualism
 
Geography
GeographyGeography
Geography
 
GEOGRAPHY
GEOGRAPHYGEOGRAPHY
GEOGRAPHY
 
Ncert11geog1
Ncert11geog1Ncert11geog1
Ncert11geog1
 
5 themes of geography
 5 themes of geography 5 themes of geography
5 themes of geography
 
file_1622440466657.pdf
file_1622440466657.pdffile_1622440466657.pdf
file_1622440466657.pdf
 
312 introduction to geog f1
312 introduction to geog f1312 introduction to geog f1
312 introduction to geog f1
 
GE-101 (1).pdf
GE-101 (1).pdfGE-101 (1).pdf
GE-101 (1).pdf
 
Relationship of Geography with Other Disciplines
Relationship  of  Geography  with  Other Disciplines Relationship  of  Geography  with  Other Disciplines
Relationship of Geography with Other Disciplines
 

Recently uploaded

Presiding Officer Training module 2024 lok sabha elections
Presiding Officer Training module 2024 lok sabha electionsPresiding Officer Training module 2024 lok sabha elections
Presiding Officer Training module 2024 lok sabha electionsanshu789521
 
CARE OF CHILD IN INCUBATOR..........pptx
CARE OF CHILD IN INCUBATOR..........pptxCARE OF CHILD IN INCUBATOR..........pptx
CARE OF CHILD IN INCUBATOR..........pptxGaneshChakor2
 
MARGINALIZATION (Different learners in Marginalized Group
MARGINALIZATION (Different learners in Marginalized GroupMARGINALIZATION (Different learners in Marginalized Group
MARGINALIZATION (Different learners in Marginalized GroupJonathanParaisoCruz
 
How to Make a Pirate ship Primary Education.pptx
How to Make a Pirate ship Primary Education.pptxHow to Make a Pirate ship Primary Education.pptx
How to Make a Pirate ship Primary Education.pptxmanuelaromero2013
 
Enzyme, Pharmaceutical Aids, Miscellaneous Last Part of Chapter no 5th.pdf
Enzyme, Pharmaceutical Aids, Miscellaneous Last Part of Chapter no 5th.pdfEnzyme, Pharmaceutical Aids, Miscellaneous Last Part of Chapter no 5th.pdf
Enzyme, Pharmaceutical Aids, Miscellaneous Last Part of Chapter no 5th.pdfSumit Tiwari
 
भारत-रोम व्यापार.pptx, Indo-Roman Trade,
भारत-रोम व्यापार.pptx, Indo-Roman Trade,भारत-रोम व्यापार.pptx, Indo-Roman Trade,
भारत-रोम व्यापार.pptx, Indo-Roman Trade,Virag Sontakke
 
How to Configure Email Server in Odoo 17
How to Configure Email Server in Odoo 17How to Configure Email Server in Odoo 17
How to Configure Email Server in Odoo 17Celine George
 
Hierarchy of management that covers different levels of management
Hierarchy of management that covers different levels of managementHierarchy of management that covers different levels of management
Hierarchy of management that covers different levels of managementmkooblal
 
Organic Name Reactions for the students and aspirants of Chemistry12th.pptx
Organic Name Reactions  for the students and aspirants of Chemistry12th.pptxOrganic Name Reactions  for the students and aspirants of Chemistry12th.pptx
Organic Name Reactions for the students and aspirants of Chemistry12th.pptxVS Mahajan Coaching Centre
 
Introduction to AI in Higher Education_draft.pptx
Introduction to AI in Higher Education_draft.pptxIntroduction to AI in Higher Education_draft.pptx
Introduction to AI in Higher Education_draft.pptxpboyjonauth
 
Alper Gobel In Media Res Media Component
Alper Gobel In Media Res Media ComponentAlper Gobel In Media Res Media Component
Alper Gobel In Media Res Media ComponentInMediaRes1
 
EPANDING THE CONTENT OF AN OUTLINE using notes.pptx
EPANDING THE CONTENT OF AN OUTLINE using notes.pptxEPANDING THE CONTENT OF AN OUTLINE using notes.pptx
EPANDING THE CONTENT OF AN OUTLINE using notes.pptxRaymartEstabillo3
 
Interactive Powerpoint_How to Master effective communication
Interactive Powerpoint_How to Master effective communicationInteractive Powerpoint_How to Master effective communication
Interactive Powerpoint_How to Master effective communicationnomboosow
 
ECONOMIC CONTEXT - PAPER 1 Q3: NEWSPAPERS.pptx
ECONOMIC CONTEXT - PAPER 1 Q3: NEWSPAPERS.pptxECONOMIC CONTEXT - PAPER 1 Q3: NEWSPAPERS.pptx
ECONOMIC CONTEXT - PAPER 1 Q3: NEWSPAPERS.pptxiammrhaywood
 
DATA STRUCTURE AND ALGORITHM for beginners
DATA STRUCTURE AND ALGORITHM for beginnersDATA STRUCTURE AND ALGORITHM for beginners
DATA STRUCTURE AND ALGORITHM for beginnersSabitha Banu
 
call girls in Kamla Market (DELHI) 🔝 >༒9953330565🔝 genuine Escort Service 🔝✔️✔️
call girls in Kamla Market (DELHI) 🔝 >༒9953330565🔝 genuine Escort Service 🔝✔️✔️call girls in Kamla Market (DELHI) 🔝 >༒9953330565🔝 genuine Escort Service 🔝✔️✔️
call girls in Kamla Market (DELHI) 🔝 >༒9953330565🔝 genuine Escort Service 🔝✔️✔️9953056974 Low Rate Call Girls In Saket, Delhi NCR
 
Painted Grey Ware.pptx, PGW Culture of India
Painted Grey Ware.pptx, PGW Culture of IndiaPainted Grey Ware.pptx, PGW Culture of India
Painted Grey Ware.pptx, PGW Culture of IndiaVirag Sontakke
 
Employee wellbeing at the workplace.pptx
Employee wellbeing at the workplace.pptxEmployee wellbeing at the workplace.pptx
Employee wellbeing at the workplace.pptxNirmalaLoungPoorunde1
 

Recently uploaded (20)

Presiding Officer Training module 2024 lok sabha elections
Presiding Officer Training module 2024 lok sabha electionsPresiding Officer Training module 2024 lok sabha elections
Presiding Officer Training module 2024 lok sabha elections
 
CARE OF CHILD IN INCUBATOR..........pptx
CARE OF CHILD IN INCUBATOR..........pptxCARE OF CHILD IN INCUBATOR..........pptx
CARE OF CHILD IN INCUBATOR..........pptx
 
MARGINALIZATION (Different learners in Marginalized Group
MARGINALIZATION (Different learners in Marginalized GroupMARGINALIZATION (Different learners in Marginalized Group
MARGINALIZATION (Different learners in Marginalized Group
 
How to Make a Pirate ship Primary Education.pptx
How to Make a Pirate ship Primary Education.pptxHow to Make a Pirate ship Primary Education.pptx
How to Make a Pirate ship Primary Education.pptx
 
Enzyme, Pharmaceutical Aids, Miscellaneous Last Part of Chapter no 5th.pdf
Enzyme, Pharmaceutical Aids, Miscellaneous Last Part of Chapter no 5th.pdfEnzyme, Pharmaceutical Aids, Miscellaneous Last Part of Chapter no 5th.pdf
Enzyme, Pharmaceutical Aids, Miscellaneous Last Part of Chapter no 5th.pdf
 
भारत-रोम व्यापार.pptx, Indo-Roman Trade,
भारत-रोम व्यापार.pptx, Indo-Roman Trade,भारत-रोम व्यापार.pptx, Indo-Roman Trade,
भारत-रोम व्यापार.pptx, Indo-Roman Trade,
 
How to Configure Email Server in Odoo 17
How to Configure Email Server in Odoo 17How to Configure Email Server in Odoo 17
How to Configure Email Server in Odoo 17
 
Hierarchy of management that covers different levels of management
Hierarchy of management that covers different levels of managementHierarchy of management that covers different levels of management
Hierarchy of management that covers different levels of management
 
Organic Name Reactions for the students and aspirants of Chemistry12th.pptx
Organic Name Reactions  for the students and aspirants of Chemistry12th.pptxOrganic Name Reactions  for the students and aspirants of Chemistry12th.pptx
Organic Name Reactions for the students and aspirants of Chemistry12th.pptx
 
Introduction to AI in Higher Education_draft.pptx
Introduction to AI in Higher Education_draft.pptxIntroduction to AI in Higher Education_draft.pptx
Introduction to AI in Higher Education_draft.pptx
 
Alper Gobel In Media Res Media Component
Alper Gobel In Media Res Media ComponentAlper Gobel In Media Res Media Component
Alper Gobel In Media Res Media Component
 
EPANDING THE CONTENT OF AN OUTLINE using notes.pptx
EPANDING THE CONTENT OF AN OUTLINE using notes.pptxEPANDING THE CONTENT OF AN OUTLINE using notes.pptx
EPANDING THE CONTENT OF AN OUTLINE using notes.pptx
 
Interactive Powerpoint_How to Master effective communication
Interactive Powerpoint_How to Master effective communicationInteractive Powerpoint_How to Master effective communication
Interactive Powerpoint_How to Master effective communication
 
Model Call Girl in Bikash Puri Delhi reach out to us at 🔝9953056974🔝
Model Call Girl in Bikash Puri  Delhi reach out to us at 🔝9953056974🔝Model Call Girl in Bikash Puri  Delhi reach out to us at 🔝9953056974🔝
Model Call Girl in Bikash Puri Delhi reach out to us at 🔝9953056974🔝
 
OS-operating systems- ch04 (Threads) ...
OS-operating systems- ch04 (Threads) ...OS-operating systems- ch04 (Threads) ...
OS-operating systems- ch04 (Threads) ...
 
ECONOMIC CONTEXT - PAPER 1 Q3: NEWSPAPERS.pptx
ECONOMIC CONTEXT - PAPER 1 Q3: NEWSPAPERS.pptxECONOMIC CONTEXT - PAPER 1 Q3: NEWSPAPERS.pptx
ECONOMIC CONTEXT - PAPER 1 Q3: NEWSPAPERS.pptx
 
DATA STRUCTURE AND ALGORITHM for beginners
DATA STRUCTURE AND ALGORITHM for beginnersDATA STRUCTURE AND ALGORITHM for beginners
DATA STRUCTURE AND ALGORITHM for beginners
 
call girls in Kamla Market (DELHI) 🔝 >༒9953330565🔝 genuine Escort Service 🔝✔️✔️
call girls in Kamla Market (DELHI) 🔝 >༒9953330565🔝 genuine Escort Service 🔝✔️✔️call girls in Kamla Market (DELHI) 🔝 >༒9953330565🔝 genuine Escort Service 🔝✔️✔️
call girls in Kamla Market (DELHI) 🔝 >༒9953330565🔝 genuine Escort Service 🔝✔️✔️
 
Painted Grey Ware.pptx, PGW Culture of India
Painted Grey Ware.pptx, PGW Culture of IndiaPainted Grey Ware.pptx, PGW Culture of India
Painted Grey Ware.pptx, PGW Culture of India
 
Employee wellbeing at the workplace.pptx
Employee wellbeing at the workplace.pptxEmployee wellbeing at the workplace.pptx
Employee wellbeing at the workplace.pptx
 

Unit 1 geography map reading for children.pdf

  • 1. Unit Outcomes After completing this unit, you will be able to: Þ Þ recognize the concept, scope and branches of geography Þ Þ express the meaning, historical development, uses and types of maps Þ Þ compute field distance and areas of irregular shaped figures, construct and interpret statistical diagrams. Main Contents 1.1 INTRODUCTION TO THE CONCEPT OF GEOGRAPHY 1.2 INTRODUCTION TO THE CONCEPT OF MAP-READING F F Unit Summary F F Review Exercise Unit1 THE CONCEPT OF GEOGRAPHY AND MAP-READING
  • 2. Grade 9 Geography 2 Introduction   INTRODUCTION In this unit, you will learn about the concept of geography and map reading. The major topics to be covered include the meaning of geography, scope of geography, branches of geography, what makes geography a science, meaning of map, historical development of maps, uses of maps, classification of maps, magnetic declination, linear and areal scales, how to find the scale of a map, measurement of regular and irregular shaped areas and statistical diagrams. Geography, as a branch of knowledge, has been defined by different people. The ancient Greeks and Romans defined it as the description of the earth. The Germans in the 18th century defined it as a science that deals with the relationship between people and their environment. In the mid 20th century, it became a spatial science dealing with the arrangement and distribution of things and phenomena over the surface of the earth. The differences in these definitions reflect the fact that geography had various scopes during its historical development. Initially it was considered as a general earth science; geography has now become a science that examines “place and space” on the Earth’s surface in relation to location, distribution, arrangement, interaction, causes and effects of (things and) phenomena. Modern geography is a spatial temporal-areal science. Nowadays, geography has two main branches of study - physical and human. The most important tools that geographers use are maps. Like the science of geography itself, maps have evolved over the centuries. They have changed from simple sketches to complex representations such as spatial data compilations, which you will study in later grades. Start-up Activity Examine carefully Figure 1.1 and try to understand their linkage with the subject Geography. Figure 1.1 Geographic profiles
  • 3. Unit 1: The Concept of Geography and Map-Reading 3 1.1 Introduction To The Concept Of Geography 1.1 INTRODUCTION TO THE CONCEPT OF GEOGRAPHY At the end of this section, you will be able to: Þ Þ define the term geography; Þ Þ describe the development of geography as a discipline; Þ Þ determine the scope of geography; Þ Þ identify the branches of geography; and Þ Þ identify the characteristics that make the subject of geography a science. Key Terms ³ ³ Spatial ³ ³ Geography ³ ³ Scope ³ ³ Development ³ ³ Science 1.1.1 Meaning of Geography What is geography? Do you think that geography has a single universally accepted definition? Why? From the ancient Greeks to modern-day geographers, geography has been defined differently. However, the various definitions share some common ideas. Here are some of the most important definitions that geographers have proposed: F F Eratosthenes (276-196 BC) – Geography is the description of the earth. F F Concise Oxford Dictionary (1964) – Geography is the science of the earth’s surfaces. F F Hartshorne, R. (1899-1992) – Geography is a branch of knowledge that is concerned with the provision of an accurate, orderly and rational description of distributions on the surface of the earth. F F Yeates, M. (1968) – Geography is a science that is concerned with the rational development and testing of theories that explain and predict the spatial distribution and locations of (things and) phenomena on the surface of the earth.
  • 4. Grade 9 Geography 4 1.1 Introduction To The Concept Of Geography As you can see, each of these definitions includes the idea that geography studies the earth. Most of them specify the surface of the earth. At this level, we will define geography as a branch of science that studies the earth’s surface and the distribution, arrangement and interaction of natural and human features and their causes and effects. 1.1.2 The Scope of Geography What is scope? How wide is geography’s scope? F F Scope means the range and variety of contents which are included in a subject or field of study. Geography’s scope is very wide. As the scope is dynamic, it changes often as new discoveries and ideas enter the field. F F Geography studies a great many physical and human features of the world. Its focus includes their causes, effects, and interactions. As indicated above, the subjects that geography examines include features in the hydrosphere, atmosphere, lithosphere and biosphere. Geography has undergone profound changes in its scope and focus: F F In ancient times, geography was considered to be the mother of many other sciences, including philosophy and the earth sciences. F F In the 16th century, geography began to emphasize location, focusing on questions of where, why and what. F F In the mid 18th century, European geographers, especially Germans, considered the relationship between geography with philosophy. This approach caused geography to focus on the relationship between human and the natural environment. Alexander Von Humboldt and Carl Ritter were among the major contributors to this approach. F F In the 19th century, geographical societies and research groups formed. They enhanced the role of geography as a discipline. F F In the late 20th century, geography became a spatial science. Note The earth’s surface consists of: Â Â hydrosphere – It includes all the bodies of water, i.e., oceans, rivers, lakes and others. Â Â biosphere – This refers to all living organisms in and on the earth’s surface. Â Â atmosphere – It includes all aspects of air composition surrounding our planet. Â Â lithosphere – It is the solid layer of rocks which covers the entire surface of the planet.
  • 5. Unit 1: The Concept of Geography and Map-Reading 5 1.1 Introduction To The Concept Of Geography 1.1.3 Branches of Geography What are the two branches of geography? Can you list some of the fields of geography that fall into each of the two branches? You have studied the definition of geography, and you have considered its scope. Next you will learn about the main parts of geography – its branches. They are: F F Physical geography F F Human geography What does physical geography study? i Physical Geography: This branch of geography studies the distribution of the natural features of the world, such as climate, landforms, soil, vegetation, and drainage systems. Physical geography also considers causes, effects and interactions of these features. Physical geography includes the following specialized fields of study: F F Climatology: studies factors that create climate and examines the variation and distribution of climate and related causes and effects. F F Geomorphology: studies the distribution of landforms (such as mountains and plains) and the forces that change them. F F Soilgeography:studiesthedistributionofsoilsandtheircharacteristics. Climatology Geomorphology Soil geography Oceanography Cultural geography Population geography Urban geography Human geography Physical geography Branches of Geography Biogeography Historical geography Political geography Economic geography
  • 6. Grade 9 Geography 6 1.1 Introduction To The Concept Of Geography F F Biogeography: studies the distribution of plants and animals in relation to the environments that they inhabit. F F Oceanography: studies the location, causes and effects of ocean currents, waves and tides. What does human geography study? Do you know the sub-branches of human geography? ii Human Geography: This branch of geography studies the distribution and influence of human aspects of our world, including cultures, population settlement, economic activities and political systems. Human geography includes these specialized fields of study: F F Cultural geography: studies the distribution and interactions of cultures, including peoples’ beliefs and customs. It also examines the movement, expansion and interaction of cultures on the surface of the earth. F F Population geography: studies the distribution, growth and structure of population. F F Economic geography: studies production, consumption and exchange and the spatial distribution of goods and services and factors affecting them. F F Political geography: studies the distribution of political systems and the ways people use them to exercise power and make decisions. F F Urban geography: studies the development and characteristics of towns, cities and other urban centers. F F Historical geography: is the study of the geography of the past and how places or regions change over time. Activity 1.1 Discuss the following in small groups. 1 Geography studies the distribution and influence of human aspects of our world including cultures, population, economic activities and political systems. Do you agree or disagree with this statement? Why? 2 Some people say geography is concerned only with the study of place names. DO you agree or disagree to such idea? Why? 3 Some people say geography has a limited scope. Do you agree or disagree with such idea? Why?
  • 7. Unit 1: The Concept of Geography and Map-Reading 7 1.1 Introduction To The Concept Of Geography 1.1.4 Geography as a Science What is science? What makes geography a science? Science is a system of acquiring knowledge through scientific methods. These methods involve observation, identification, description, experimental investigation, and theoretical explanation of phenomena. Geography investigates facts and relationships related to physical and social phenomena, and examines their distribution across the world and changes over time. The main tools geography uses to gather and analyze information are observation, systematic description, systematic recording and mapping. As you can see from its subject matter and methodologies, geography is a subject that bridges the natural and social sciences. Activity 1.2 In pairs, discuss the following questions: 1 Do you appreciate learning geography? Why? 2 Is geography a science? Why? 3 What are the areas of the study of geography? 4 Write a short report on the relationships between geography and natural and social science.  Exercise 1.1 I Determine which of the sentences is True or False. 1 Geography studies physical and human features of the world. 2 Cultural geography studies the distribution of population and factors that affect their distribution. 3 Human geography deals with human-made features on the earth’s surface, such as settlements, economic activities and conservation measures. 4 The scope of geography means the extent of geography as a field of study.
  • 8. Grade 9 Geography 8 1.2 Introduction To The Concept Of Map-reading II Choose the correct answer. 5 The branch of geography that studies landforms and the forces that shape them is known as: A Biogeography B Oceanography C Geomorphology D Soil geography 6 It is the solid layer of rocks which covers the entire surface of the planet. A Hydrosphere B Atmosphere C Biosphere D Lithosphere 7 One of the following is not a branch of human geography A Political geography B Urban geography C Biogeography D Historical geography 8 It is a branch of human geography that studies the distribution, growth and structure of population. A Cultural geography B Historical geography C Political geography D None of the above 9 One of the following is a branch of physical geography: A Climatology B Soil geography C Oceanography D All are correct III Give short answers to the following questions. 10 What are the two major branches of geography? 11 What is the serious concern of geographical study? 12 Which branch of geography studies the distribution of plants and animals in relation to the environments that they inhabit? 13 What does political geography study? 14 What does physical geography study? 1.2 INTRODUCTION TO THE CONCEPT OF MAP-READING At the end of this section, you will be able to: Þ Þ explain the meaning of a map; Þ Þ appreciate the historical development of maps; Þ Þ state the basic uses of maps;
  • 9. Unit 1: The Concept of Geography and Map-Reading 9 1.2 Introduction To The Concept Of Map-reading Þ Þ categorise maps based on scales and purposes; Þ Þ distinguish the conventional signs and symbols used to represent different features on maps; Þ Þ identify some of the marginal information given on maps; Þ Þ convert linear scale to areal scale; Þ Þ calculate the scale of a map; Þ Þ calculate the areas of regular and irregular shaped figures by referring to the scale of a map; Þ Þ construct statistical diagrams using simple line graphs, bar graphs and pie charts based on the provided data. Key Terms ³ ³ Latitude ³ ³ International Grid Reference (IGR) ³ ³ National Grid Reference (NGR) ³ ³ Magnetic declination ³ ³ Remote sensing ³ ³ Global Positioning System (GPS) ³ ³ Geographical Information System (GIS) ³ ³ Longitude Start-up Activity What is the actual distance between points X and Y? Figure 1.2 Map of Africa
  • 10. Grade 9 Geography 10 1.2 Introduction To The Concept Of Map-reading 1.2.1 Meaning of Map What is a map? Do you remember what you have learned in previous grades about map? Here is a simple definition: A map is a simplified, diminished, plain representation of all or part of the earth’s surface as viewed from vertically above. Here are the main features of maps: F F A map represents all or part of the earth’s surface. For example, a map might show a city such as Addis Ababa, the entire world, or a section of a garden. F F A map is a two-dimensional (plane) representation. For example, a map might be printed on a piece of paper. F F Maps show the earth’s surface as if it were seen from directly above. This view is called a bird’s-eye view. F F All maps are smaller than the area they represent. F F Maps are drawn to scale. In other words, the features shown on a map have the same relative proportions as they do in reality. For example, if one mountain’s diameter is twice as large as that of another mountain, the first mountain would be shown on a map as twice as large as the second. F F Maps are simplified representations. F F Most maps use generally accepted symbols to represent natural, artificial or cultural features of the area they represent. They also use conventional notations to provide background information such as the map’s title, date and scale. Activity 1.3 Discuss the following question and perform the following tasks in your group. 1 What does this mean:“A map is a two-dimensional plane representation”? 2 Compare and contrast maps and globes. 3 Prepare sketch map of your locality and show on the map the settlement pattern in the locality.
  • 11. Unit 1: The Concept of Geography and Map-Reading 11 1.2 Introduction To The Concept Of Map-reading 1.2.2 Historical Development of Maps Describe the historical development of maps. How do traditional and modern map-making differ from each other? Maps are among our oldest tools. People created maps even in primitive times. For instance, men and women sketched their routes to hunting, fishing and gathering grounds. Today, we also prepare maps, for many purposes. However, map-making has passed through many stages of development since its beginning. The two main stages of the historical development of map-making are:   Traditional map-making   Modern map-making A Traditional map-making What are the major features of traditional map-making? How did people represent the environment on maps in the past? The art of traditional map-making is as old as the human race. Traditional maps have been made in many ways. For example, early map materials included sticks, shells, clay tablets, parchment, paper and solid plates of silver. Many traditional maps were locational. For example, they have shown the locations of water holes and hunting grounds and have included paths that led to these places. Focus In traditional map-making, collecting measurements of distances, directions, areas and locations was one of the greatest challenges. Each measurement was be made by hand, through field work in the area being mapped. This process was laborious and tiresome. Often the accuracy of the resulting information is imperfect and therefore not fully dependable. Another main difference between traditional and modern maps is that a traditional map might include drawings of three-dimensional objects. As a result,
  • 12. Grade 9 Geography 12 1.2 Introduction To The Concept Of Map-reading a traditional map might be somewhat pictographic (or physiographic) rather than strictly diagrammatic. Most traditional maps are sketch maps. For example, look at this ancient world map that Eratosthenes drew. B Modern map-making When did modern map-making start? What features characterize modern map-making? What is the role of GIS in modern map-making? The modern science of map-making has its basis in the 17th century. The various developments that took place during the Renaissance gave way to accurate map- making (cartography). Furthermore, advancements in science and technology resulted in the invention of better cameras and airplanes specially designed to take aerial photographs. Today, map-makers have diverse opportunities to acquire spatial information. In addition to aerial photography, satellite imagery provides a wealth of information. Nowadays, computers have come to be “close friends” of map-makers. This is because they have become in valuable in making maps. In the last three decades of the 20th century computers have been seen as integral part at almost every stage of the cartographic process. They play roles in the collection, storage, analysis, and presentation of data, and even in the mapping and reproduction of maps. This makes the Geographic Information System (GIS) indispensable to modern map-making. Eratosthenes (276 BC-194 BC) EratostheneswasaGreekmathematician, geographer and astronomer. In 200 BC, Erastosthenes adopted a word geography, which means a description of the earth. Figure 1.3 Eratosthenes’map
  • 13. Unit 1: The Concept of Geography and Map-Reading 13 1.2 Introduction To The Concept Of Map-reading AGIS needs a geographic database of, for example, a digital record of geographic information. The first step in developing a GIS is to create the geographic database from such sources as maps, field surveys, aerial photographs, satellite imagery, and so forth. Generally, modern map-making is fast and uses modern ways and means of collecting information, such as specially designed airplanes, remote sensors and the Global Positioning System (GPS). Activity 1.4 In a small group, discuss the following questions. 1 What are the major characteristics of modern map-making? 2 What are the components of GIS? 1.2.3 Uses of Maps Why are maps very important in geography? What are the major uses of maps? As you know, the map is geography’s most important tool. It is also one of the most flexible tools in terms of the information it presents and the uses we can make of it. For example, it can present very simple information or highly detailed results from a complicated geographical investigation. Maps are basically used for identifying locations, distance, area and direction. Location: With the help of a map it is possible to locate a place in reference to another place. For example, Ethiopia’s location can be expressed in terms of its neighbouring countries, external land masses and water bodies. It is also possible to locate a place using astronomical grid references – parallels and meridians. For example, the absolute location of Ethiopia is 3o N-15o N latitude and 33o E-48o E longitude. Distance: It is possible to calculate the distance between two or more places on a map. This is done by using the scale of the map. For example, the air distance between Bahir Dar andAddisAbaba can be calculated by using a map of Ethiopia. Area: The area of a place, a country, a region, a continent, a sub-continent or the whole world can be calculated from a map. This is done by measuring the length and the width of the given place on the map and by converting them to ground distances with the help of the scale of the map.
  • 14. Grade 9 Geography 14 1.2 Introduction To The Concept Of Map-reading Direction: A map can enable us to identify the direction and bearing of any place on the map. This is accomplished by referring to another place. For example, a map of Ethiopia can help us to find the direction and bearing of Mekele by referring to Addis Ababa. In addition to these, maps can be used to: F F Show the distribution of physical and human phenomena on the earth’s surface: distribution maps show the locations of phenomena on the earth’s surface. For example, we use distribution maps for Ethiopia to show the presence of human and animal populations, minerals, and vegetation. Similarly, we use distribution maps to show patterns of settlement, temperature, and health conditions. F F Show surface configuration: topographic maps give information about variations in height on the earth’s surface. For example, they show heights and depths of valleys, plains and mountains. F F Offer visual comparisons: because the earth’s surface is vast, it is difficult to compare places by direct observation. For example, it would be difficult to compare the distribution of landforms in Ethiopia and Kenya, even from an airplane. However, by offering us relatively small but accurate representations of the two countries, maps solve this problem completely. F F Support development planning: Maps can provide planners with vital information to plan for the future. For example, maps can show current conditions and ongoing trends, and they can help us predict a nation’s socioeconomic conditions. Such information is invaluable to the country’s planners as they analyze possibilities and livelihoods and then prepare for the future. Activity 1.5 Look at the map in Figure 1.2 and perform the following tasks and answer the following question. 1 Write down the relative location of Ethiopia. 2 Which neighbouring country is located south of Ethiopia?
  • 15. Unit 1: The Concept of Geography and Map-Reading 15 1.2 Introduction To The Concept Of Map-reading 1.2.4 Classification of Maps How many types of maps do you know? Do you think that all maps are one and the same? Why? Although most maps have similar characteristics, they can differ from one another in many ways. This topic teaches you how to classify maps in terms of the following features: F F Focus and level of detail (purpose) – the amount of information they present about their subjects, especially their ability to show small details. F F Scale – the size of the area for which they give information and, therefore, the scope of the information that they give about these areas. Classification Based on Purpose: Maps can be classified as general-purpose or specific-purpose. General-Purpose Maps What are general-purpose maps? What are they used for? List uses of topographic maps. A general-purpose map is a map that shows the features of a place in a relatively general way. It provides a wide range of information about the place it represents. General-purpose maps are not topical. Instead, they tend to contain a little of many kinds of information at a relatively low level of detail. Topographic information of each kind in lesser detail. A topographic map is a good example of this. It can illustrate both physical and human-made features of the earth. Focus General-purpose maps are prepared to provide a wide range of information about different features of an area. They contain a little information of each kind about the area they represent. Their ability to provide different information is their advantage, whereas their weakness is to show limited detailed information.
  • 16. Grade 9 Geography 16 1.2 Introduction To The Concept Of Map-reading Specific−Purpose Maps What kind of map is a specific-purpose map? How does it differ from a general- purpose map? Specific-purpose maps are often called thematic maps or topical maps. We use these terms because specific-purpose maps emphasize on a single topic. These maps show detailed information about their subjects. Thematic maps can show almost any kind of information that varies from place to place, such as population distribution, rainfall and temperature patterns, and the distribution of types of soil or vegetation. F F Soil maps F F Vegetation maps F F Climate maps Focus Specific-purpose maps are thematic/topical maps. They usually show a high level of detail and have a deep focus on their subjects. Many specific- purpose maps are created for specialists in particular subjects. Classification by Scale Scale is a ratio that shows the degree to which the area that is mapped has been reduced. Based on scale differences, maps can be classified into: F F Large-scale maps F F Medium-scale maps F F Small-scale maps Let us now consider each of these types of map in more detail. Large-Scale Maps ≥ 1:50,000 What are large scale maps? Large-scale maps present small areas in detail with great accuracy. Large-scales are greater than or equal to 1:50,000. A large-scale map, such as the map of Addis Ababa, shows the city in considerable detail.
  • 17. Unit 1: The Concept of Geography and Map-Reading 17 1.2 Introduction To The Concept Of Map-reading Large scale maps present a relatively small area and show its features in consider- able detail. For example, at a scale of 1:5,000, a map of a city can include many features – such as buildings. The map can also include many details, such as the bends in highways. Medium-Scale Maps 1:50,000 - 1:250,000 What are medium-scale maps? These are maps that are prepared with scales that range between 1:50,000 and 1:250,000. Medium-scale maps cover wider areas than large scale maps, but cover smaller areas than small-scale maps. They are also able to present more detailed information than small-scale maps but are less detailed than large-scale ones. Small-Scale Maps ≤ 1:250,000 What are small-scale maps? Small-scale maps are those which are prepared with scales less than or equal to 1:250,000. These small–scale maps cover wider areas than large and medium scale maps. Focus Large-Scale maps Small-Scale Maps   Scale: ≥ 1: 50,000   Cover small areas   Contain highly detailed information   Scale: ≤ 1:250,000   Cover large areas   Contain less-detailed information Medium-Scale Maps   Scale: between 1:50,000 and 1:250,000   Cover medium sized areas   Contain moderately detailed information
  • 18. Grade 9 Geography 18 1.2 Introduction To The Concept Of Map-reading Activity 1.6 In pairs, discuss the following questions. 1 Do you know how a map-maker can reduce the size of ground objects while making maps? 2 Compare and contrast large and small scale map? 3 Compare the scale of 1 : 25,000 with 1 : 250,000. Which one is a smaller scale? Why? 1.2.5 Marginal Information of Maps What is a map’s margin? What are the most common types of information that are found in the margin of a map? Maps are used to convey information. To read maps effectively, map users need information about the map. Such information is presented in the map’s margins and is known as marginal information. Marginal information includes: F F Title of the map: Gives the map’s name. For example, “Soil Map” explains that the map presents information about soil. F F Year of publication: identifies the year in which the map was published. Because this information tells you how old the map is, you might be able to judge whether the map’s contents are current or might be out of date. F F Author: identifies the copyright owner of the map and indicates who (or what organization) has prepared the map. F F Place of publication and publisher: tells where the map was published and identifies the organization that published the map. F F Scale: This information indicates the extent to which the area that is represented in the map has been reduced. F F Legend/Key: explains the meaning of the signs and symbols used in the map. F F Type of projection: tells the kind of projection used in making the map. F F Direction or orientation (North) arrow: Shows the north direction on the map. F F The magnetic declination (variation): is the difference between Magnetic North and True North. This will be explained later in this unit.
  • 19. Unit 1: The Concept of Geography and Map-Reading 19 1.2 Introduction To The Concept Of Map-reading Conventional Signs and Symbols How do maps show different features of the earth? What do map-makers use to represent the different physical and human features on maps? Geographers have developed a standard set of symbols and other graphic conventional signs to represent features shown on maps. Conventional signs and symbols are those signs and symbols that are used on maps through the agreement of all map-makers of the world. They are used to represent the same detail on a map in all the countries of the world. Signs and symbols help the map reader to understand maps. Therefore, the map reader has to look first at the key or legend of the map. When you create a map, the symbols you select should satisfy the following requirements. F F They should be uniform throughout the map. F F They should be easy to read and understand. F F The space occupation, orientation and size of the symbols should be constant. Here are some of the symbols and conventional signs that are widely used and understood worldwide: F F cities and towns are indicated by dots or patches of shading; F F streams and bodies of water are often printed in blue; and F F political boundaries are shown by dot lines/solid lines. Table 1.1: Conventional signs and symbols Symbol Description All-weather road Bridge Permanent lake Plantation Mine
  • 20. Grade 9 Geography 20 1.2 Introduction To The Concept Of Map-reading Map Scale What is map scale? Why do we need map scales? The scale of a map is the ratio between the measurement of distance on the map and the corresponding measurement on the earth’s surface. For instance, the ratio of the map distance between two cities on a map and the actual distance between the two corresponding cities on the earth is the scale to which that map is drawn. Grid References What is a grid reference? Why is it important? What is the difference between a geographic grid and a national grid reference? A map grid is a set of imaginary lines that divides the earth’s surface into regular grids. There are two major map grid systems:   International (Geographic) Grid System   National Grid System The International (Geographic) Grid System shows the absolute locations of places on the surface of the earth. Its references are made up of: F F parallels or lines of latitude – define locations north and south of the equator. They are horizontal lines of the grid. F F meridians or lines of longitude – define locations east and west of an imaginary north-south map line called the Prime Meridian. They are vertical lines of the grid. Latitude: When looking at a map, latitude lines run horizontally. Lines of latitude are also known as parallels since they are parallel and are an equal distant from each other. Each degree of latitude is approximately 111 km apart. Degrees of latitude are numbered from 0° to 90° north and south. Zero degree is the equator, the imaginary line which divides our planet into the northern and southern hemispheres. 90° north is the North Pole and 90° south is the South Pole.
  • 21. Unit 1: The Concept of Geography and Map-Reading 21 1.2 Introduction To The Concept Of Map-reading Longitude: The vertical lines of longitude are also known as meridians. They converge at the poles and are widest at the equator (about 111 km apart). Zero degrees longitude is located at Greenwich (0°). The degrees continue 180° east and 180° west where they meet and form the International Date Line in the Pacific Ocean. Parallels and meridians are imaginary lines. Latitudes are angular distances measured to the north and south of the equator in degrees, minutes and seconds. Longitudes are also angular distances, but they are measured to the east and west of the Greenwich meridian. Try to explore how lines of latitudes and longitudes create a grid network on the following map. The National Grid Systems: is used on maps of individual countries and regions within them. Its references differ from those of the International (Geographic) Grid System. The National Grid System uses eastings and northings. Eastings are lines that are drawn from north to south. Northings are lines that are drawn from east to west. 0O 30O W 60O W 90O W 120O W 150O W 180O W 30O E 60O E 90O E 120O E 150O E 180O E 0O 30O N 30O S 60O N 90O N 60O S 90O S Figure 1.4 The Geographic Grid System
  • 22. Grade 9 Geography 22 1.2 Introduction To The Concept Of Map-reading Eastings and northings in the National Grid System originate from the “False Grid Origin” that lies at the southwestern corner of the place they cover. While the values of eastings increase eastwards, the values of northings increase northwards. Eastings and northings are measured in kilometres. In Ethiopia, there are two ways of giving national grid reference. They are four- digit and six-digit grid reference. Eastings are always given before northings. For example, the six-digit grid reference of letter A is 490970. 97 0000 98 0000 99 0000 95 0000 470000 480000 490000 500000 470000 480000 490000 500000 96 0000 97 0000 98 0000 99 0000 95 0000 96 0000 A Figure 1.5 Map of Addis Ababa
  • 23. Unit 1: The Concept of Geography and Map-Reading 23 1.2 Introduction To The Concept Of Map-reading Magnetic Declination What is magnetic declination? What is magnetic north? What about true north? The earth has north and south geographic poles at the northern and southern convergence points of the meridians. It also has north and south magnetic poles. Magnetic compasses that are used in navigation point towards the north magnetic pole, rather than the geographic North Pole. Magnetic declination is the difference between magnetic north and true north. It is the angle between magnetic north and true north from a particular point on the earth’s surface. The position of the north magnetic pole moves over time. Therefore, the declination factor must be updated from time to time. However, a relatively new navigation device, the gyrocompass, is adjusted so that it points to the geographic North Pole directly that it does not need this compensating factor. The amount, direction, and annual change of the variation for most localities on the surface of the earth has been determined, and this data is recorded. Figure 1.6 Magnetic Declination
  • 24. Grade 9 Geography 24 1.2 Introduction To The Concept Of Map-reading Activity 1.7 Perform the following tasks in your group. 1 Find a political map of Ethiopia and discuss the marginal information in the class. 2 Sketch a map of your school compound. Use a scale and symbols. 1.2.6 The Relationship Between Linear and Areal Scale What is linear scale? What about areal scale? Is it possible to convert one into the other? How? F F Map scale can be linear or areal. F F Linear scale expresses the ratio of map distance to ground distance. It is the most common scale type. F F Areal scale shows the relationship between map area and ground area. Areal scale is the square of linear scale. For example, if a map has a linear scale of 1 cm to 6 km, then the areal scale of the map is (1 cm)2 to (6 km)2 , which means 1 cm2 to 36 km2 . To calculate linear scale from areal scale, you put the areal scale into a square root. For instance, if the areal scale of a map is 1 cm2 to 36 km2 , then the linear scale of the map is the square root of the given areal scale, as shown below. Areal Scale = = (Linear Scale) 2 2 Distance on the map Distance on the Ground ( ) Linear Scale = Areal scale= Map Area Ground Area = 2 2 km 36 1 cm = 1 cm to 6 km
  • 25. Unit 1: The Concept of Geography and Map-Reading 25 1.2 Introduction To The Concept Of Map-reading Focus Areal scale is the square of linear scale. On the other hand, linear scale is the square root of areal scale. Therefore, if a certain linear scale is doubled, then its areal scale equivalent would be four times larger than its original scale. Activity 1.8 Perform the following tasks. 1 Find the areal scale for the following: a 1 cm to 2 km b 1 : 100,000 c 5 cm to 25 km d 3 cm to 9 km 2 Find the linear scale for the following: a 4 cm2 to 400 km2 b 4 cm2 to 16 km2 c 5 cm2 to 500 m2 d 1 cm2 to 4 km2 1.2.7 How to Find the Scale of a Map Is it possible to calculate the scale of a map when it is not given? How? In principle, every map should show the scale to which it has been drawn. If the scale is not shown, we can calculate it. There are two ways of finding a map scale, if it is not given: A By using the known distance between two points on the map This method is used if the ground distance between two points or places shown on the map is given. Then use the following procedure to obtain the scale: i Measure the distance between the two points on the map in centimeters. ii Divide the obtained distance on the map by the ground distance to obtain the ratio between the two. This gives you the scale of the map.
  • 26. Grade 9 Geography 26 1.2 Introduction To The Concept Of Map-reading To understand this better see the following example. Let us say, if the straight-line distance betweenAddisAbaba and Mekele is 555 km. Using Figure 1.7, calculate the scale of the map: Â Â Using the distance between Addis Ababa and Mekele: i Measure the distance between Addis Ababa and Mekele by using a ruler approximately 3 cm. The given air distance between the two places is 555 km. ii Find the ratio between the distance on map and the actual distance. This is the scale. 3 cm to 555 km = 1 cm to 185 km = 1 : 18,500,000. B By using latitudes In this method, the scale of the map can be obtained by using the values of latitudes. Figure 1.7 Map of Ethiopia Scale = Ground distance Distance measured on the map
  • 27. Unit 1: The Concept of Geography and Map-Reading 27 1.2 Introduction To The Concept Of Map-reading For example, let us calculate the scale of Figure 1.7 by using the 5o and 10o N latitude lines: 1 The degree difference between the two latitudes is 5o (10o – 5o ). 2 The distance that 5o represents is 555 km (111 km × 5). 3 The distance between the two latitudes on the map is approximately 3 cm. 4 The scale of the map is, therefore: Focus 1o latitude is about 111 km This relationship is derived from the circumference of the earth – 40,000 km. If 360o = 40,000 km 1o = ? = 111 km Activity 1.9 Answer the following questions in your group. 1 Thegrounddistancebetweentwoplacesis100km.Ifthisdistanceisrepresented by 5 cm on a map, what is the scale of the map? 2 If two places on the ground that are located 5o north and 10o north are shown 10 cm apart on a given map, what is the scale of the map? Scale = Distance on the Map Ground Distance = km 555 cm 3 = 1 cm to 185 km 1: 18,500,000 o o 1 40,000kms 360 × =
  • 28. Grade 9 Geography 28 1.2 Introduction To The Concept Of Map-reading 1.2.8 The Measurement of Regular and Irregular Shaped Areas Do you think that we can tell how large an area is from a map? If so, how can we measure it? Some areas have regular or geometric shapes, such as rectangles, triangles, circles and squares. Others have irregular or non-geometric shapes. This procedure is important for measuring areas on maps: 1 Measure the area of the feature on the map; 2 If the map scale is linear, convert it to areal; 3 Using the areal scale, convert the area on the map to actual ground area by using cross multiplication. Measuring Regular-Shaped Areas A regular shape is a geometrical shape such as a circle, triangle or square. If you are measuring an area with a regular shape, use the mathematical formula for its geometric shape. Then calculate the ground area by using the map’s areal scale. The following table gives you some of geometric formulae for calculating the areas of regular shapes. Table 1.2: Geometrical formula Regular-shaped areas Mathematical formula Square A = S2 ; where A = area, and S = side Rectangle A = l × w; where A = area, l = length, and w = width Right angle triangle A = ½ bh; where A = area, b = base, and h = height Circle A = πr2 ; where A = area, and r = radius. (π = 3.14 )
  • 29. Unit 1: The Concept of Geography and Map-Reading 29 1.2 Introduction To The Concept Of Map-reading What is the ground area of the farmland? In the above sketch, the farm has a regular shape. F F Measure the length and width of the rectangle on the map. Obtain its area on the map by multiplying the length by the width (area of rectangle = l × w ). This gives you the area of the farm on the map. F F Change the linear scale, which is 1 cm to 2 km, into areal scale by squaring it. This gives you the areal scale :1 cm2 to 4 km2 . F F Convert the map area into ground area by using cross multiplication. In other words, if 1 cm2 is to 4 km2 , then what will 8 cm2 be? This gives you the ground area of the farm 32 km2 . Without changing the given linear scale into areal scale, it is possible to calculate the area. 2cm 2km L 4km 1cm × = = and 4cm 2km W 8km 1cm × = = Area = L × W Area = 4 km × 8 km = 32 km2 Therefore, the area of the farm land is 32 km2 . Measuring Irregular-Shaped Areas If the feature to be measured has an irregular shape, its area cannot be directly calculated by using mathematical formulae. For example, the lake in Figure 1.9 has an irregular shape. In such cases, we can use the grid square method to measure the area of the lake on the map. Figure 1.8 A sketch map of a farm Farm land 2 cm 4 cm Scale = 1 cm to 2 km
  • 30. Grade 9 Geography 30 1.2 Introduction To The Concept Of Map-reading To better understand this, let us see how the area of the lake is measured. (See Figure 1.9) In order to find the area of the lake, we follow the following steps: 1 Copy the boundary of the lake. 2 Draw grid lines at a uniform interval (for example, 1 cm apart) over the lake. 3 Count the number of grid squares within the lake: K K number of full squares = 4 K K number of ¾ squares = 5 × ¾ K K number of ½ squares = 4 × ½ K K number of ¼ squares = 1 × ¼ Thus, total number of squares = 4 + 5 × ¾ + 4 × ½ + 1 × ¼ = 10 4 Calculate the approximate area of the lake. a First, find the area of one square by using the scale. area = S2 = 1 cm × 1 cm = 1 cm2 or 2 km × 2 km = 4 km2 b Then, calculate the total area of the lake. If one square = 4 km2 10 square = ? The approximate area of the lake is 40 km square. Activity 1.10 Answer the following questions in your group. 1 The base and height of a right angle triangle are 3 cm and 6 cm, respectively. The scale is 1 cm to 2 km. What is the ground area of the right angle triangle? 2 The radius of a circle is 4 cm. The scale is 1 cm to 5 km. What is the ground area of the circle. Scale = 1 cm to 2 km Lake Figure 1.9 A sketch map of a lake
  • 31. Unit 1: The Concept of Geography and Map-Reading 31 1.2 Introduction To The Concept Of Map-reading 1.2.9 Statistical Diagrams What is “statistics”? What are statistical diagrams? Statistics is a branch of mathematics that deals with the collection, organization, and analysis of numerical data. “Statistics” also refers to a collection of numerical information about a particular feature. Information such as the amount of crop that is produced, the growth rate of population, or the number of unemployed people in an area are all statistical figures because they present situations in terms of numbers. In geography, such statistical figures are presented by using statistical diagrams. Statistical diagrams are pictorial representations of numerical information. Charts, graphs and diagrams are examples of statistical diagrams. By using statistical diagrams, geographers make information easier to present and understand. It is easier to make comparisons, see trends (changes over time) and draw conclusions. Statistical diagrams are particularly important tools for presenting large amounts of statistical data. In this section, you will learn about some of these statistical diagrams:   Simple line graphs   Simple bar graphs   Pie charts Simple Line Graph What is a line graph? A line graph uses lines to show changes over time. It is also used to show the relationship between two sets of information/phenomena. The line graph shown in Figure 1.10, illustrates the data presented in Table 1.3. It shows the changes in population size of Africa from 1750 to 2050. The graph can also help you to compare periods of actual and projected population growth on the African continent. In the graph, the x-axis represents years, and the y-axis represents population size. Steps used to draw a line graph: 1 The horizontal axis is normally used to represent an independent variable, i.e. time, while the vertical axis to represent dependent variable, such as temperature and other qualities or values.
  • 32. Grade 9 Geography 32 1.2 Introduction To The Concept Of Map-reading 2 The base of the vertical scale should be at zero, and the top should be slightly higher than the maximum value to be recorded on it. 3 Use small crosses or dots to mark values, when plotting the graph. Table 1.3: Growth of the African Population (1750-2050) Year 1750 1800 1850 1900 1950 2000 2050 Population (x millions) 106 107 111 133 228 797 1,846 Source: Microsoft Encarta (2008) As we have already indicated, similar line graphs can be used to present a variety of data in relation to time – for example, changes in temperature, employment, and production. Simple Bar Graph What is a bar graph? A bar graph is another graphical tool for displaying statistical data. It uses horizontal or vertical bars to show different amounts of the same item or different values for the same phenomenon. The heights or lengths of the bars on a graph are proportional to the quantities they represent. Such a graph might show how amounts or values differ from place to place or as they change over time. 0 500 1000 1500 2000 1750 1800 1850 1900 1950 2000 2050 Growth of the African Population (1750 - 2050) Year Population size Figure 1.10 Growth of the African Population (1750 - 2050)
  • 33. Unit 1: The Concept of Geography and Map-Reading 33 1.2 Introduction To The Concept Of Map-reading For example, a bar graph can be used to show the number of people living in each continent or to show how rainfall varies from month to month in a certain place. The following bar graph has been prepared based on the data given in Table 1.4. It shows how the world’s population is distributed in six regions of the world. Steps used to draw a simple bar graph. 1 The horizontal scale usually represent the independent variable, more specifically when the time element is of significant, such as when graphing mean monthly rainfall or annual production. 2 All bars must start at zero and bar graphs drawn for the purposes of comparison must be drawn on the same scale. 3 When vertical bars are drawn, the time sequence should be from left to right. 4 The width of the bar is a matter of choice. However, avoid bars that are too thick or too thin. 5 The value of each bar can be assessed more easily if a space or gap is left between each bar. Table 1.4: World Population by Region (2009) Region Africa Asia Europe L. America and the Caribbean N. America Oceania Population (in millions) 999 4,117 738 580 341 36 Source: Population Reference Bureau (2009) 0 500 1000 1500 2000 2500 3000 3500 4000 4500 World Population Distribution by Region (2009) Population in million Region Figure 1.11 World population by region (2009)
  • 34. Grade 9 Geography 34 1.2 Introduction To The Concept Of Map-reading As indicated earlier, bar graphs, like the one in the previous example, let you compare a single feature as it exists in different places or as it changes over time. For example, they can represent such statistical data as annual rainfall distribution on a monthly basis. The mean monthly distribution of rainfall in Addis Ababa can be shown as follows. The graph in Figure 1.12 has been drawn using the data given in Table 1.5. Table 1.5: Monthly average rainfall of Addis Ababa, 2009 Month J F M A M J J A S O N D Rainfall (mm) 21.3 2.7 28.4 80.6 58.9 82.6 349.9 388.3 112.9 45.8 44.4 0.0 Source: CSA Ethiopian Statistical Abstract, 2009 Using the graph, you can identify which months are the wettest and which are the driest. Pie Chart What is a pie chart? What are they used for? Pie charts are circle graphs. They use segments of the circle to show the sizes of the items that make up its subject. The segments are shaped like the slices of a pie. 0 100 200 300 400 J F M A M J J A S O N D Monthly Distribution of Rainfall in Addis Ababa, 2009. Months of the year Rainfall (mm) Figure 1.12 Monthly Average Rainfall of Addis Ababa