Download to read offline


![Disclaimer: The views, facts and figures in this document are as of June 08, 2018, unless stated otherwise, and could change without any notice.
**CRISIL Benchmark Disclaimer: CRISIL Indices are the sole property of CRISIL Limited (CRISIL). CRISIL Indices shall not be copied, transmitted or distributed in any
manner for any commercial use. CRISIL has taken due care and caution in computation of the Indices, based on the data obtained from sources, which it considers
reliable. However, CRISIL does not guarantee the accuracy, adequacy or completeness of the Indices and is not responsible for any errors or for the results
obtained from the use of the Indices. CRISIL especially states that it has no financial liability whatsoever to the users of CRISIL Indices
MUTUAL FUND INVESTMENTS ARE SUBJECT TO MARKET RISKS, READ ALL
SCHEME RELATED DOCUMENTS CAREFULLY.
Statutory Details: Constitution: Union Mutual Fund (formerly Union KBC Mutual Fund) has been set up as a Trust under the Indian Trusts Act, 1882;
Sponsors: Union Bank of India and Dai-ichi Life Holdings, Inc.; Trustee: Union Trustee Company Private Limited (formerly Union KBC Trustee Company Private
Limited), [Corporate Identity Number (CIN): U65923MH2009PTC198198], a company incorporated under the Companies Act, 1956 with a limited liability;
Investment Manager: Union Asset Management Company Private Limited (formerly Union KBC Asset Management Company Private Limited), [Corporate Identity
Number (CIN): U65923MH2009PTC198201], a company incorporated under the Companies Act, 1956 with a limited liability. Registered Office: Unit 503, 5th Floor,
Leela Business Park, Andheri Kurla Road, Andheri (East), Mumbai - 400059. Toll Free No. 18002002268 • Non Toll Free. 022-67483333 • Fax No: 022-67483401 •
Website: www.unionmf.com • Email: investorcare@unionmf.com
Copy of all Scheme related documents along with the application form can be obtained from any of our AMC offices / Customer Service Centres/ distributors as well
as from our website www.unionmf.com.](https://image.slidesharecdn.com/unionbalancedadvantagefund-190112070823/85/Union-balanced-advantage-fund-22-320.jpg)


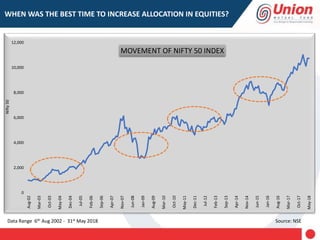
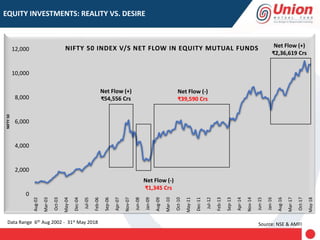
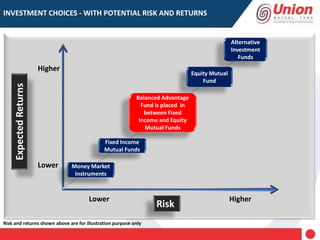
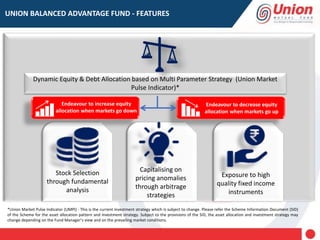
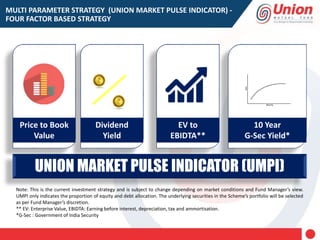
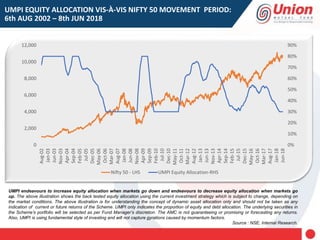
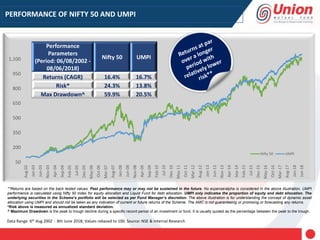
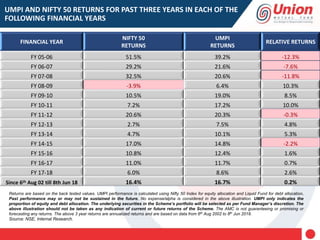
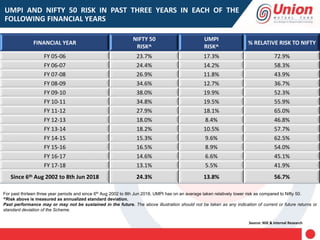
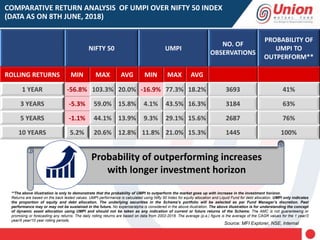
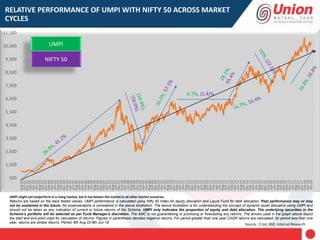
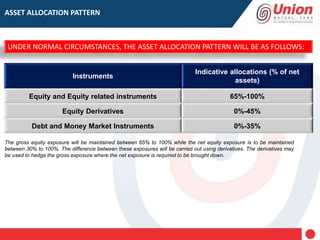
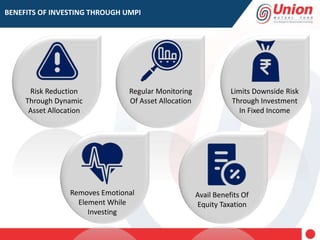
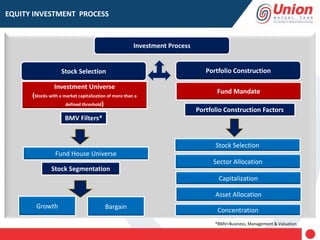
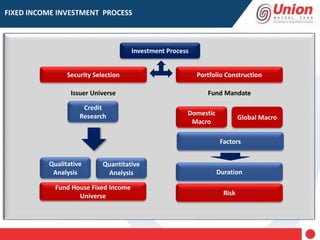
This document summarizes information about the Union Balanced Advantage Fund, an open-ended dynamic asset allocation fund. It discusses the fund's investment strategy, which uses a multi-parameter indicator called the Union Market Pulse Indicator (UMPI) to dynamically allocate between equity and debt based on factors like price-to-book value, dividend yield, and bond yields. Historical data is presented showing how UMPI aimed to increase equity allocation when markets fell and decrease it when markets rose, with the goal of providing better risk-adjusted returns than the Nifty 50 index over the long run.


