Download as PDF, PPTX
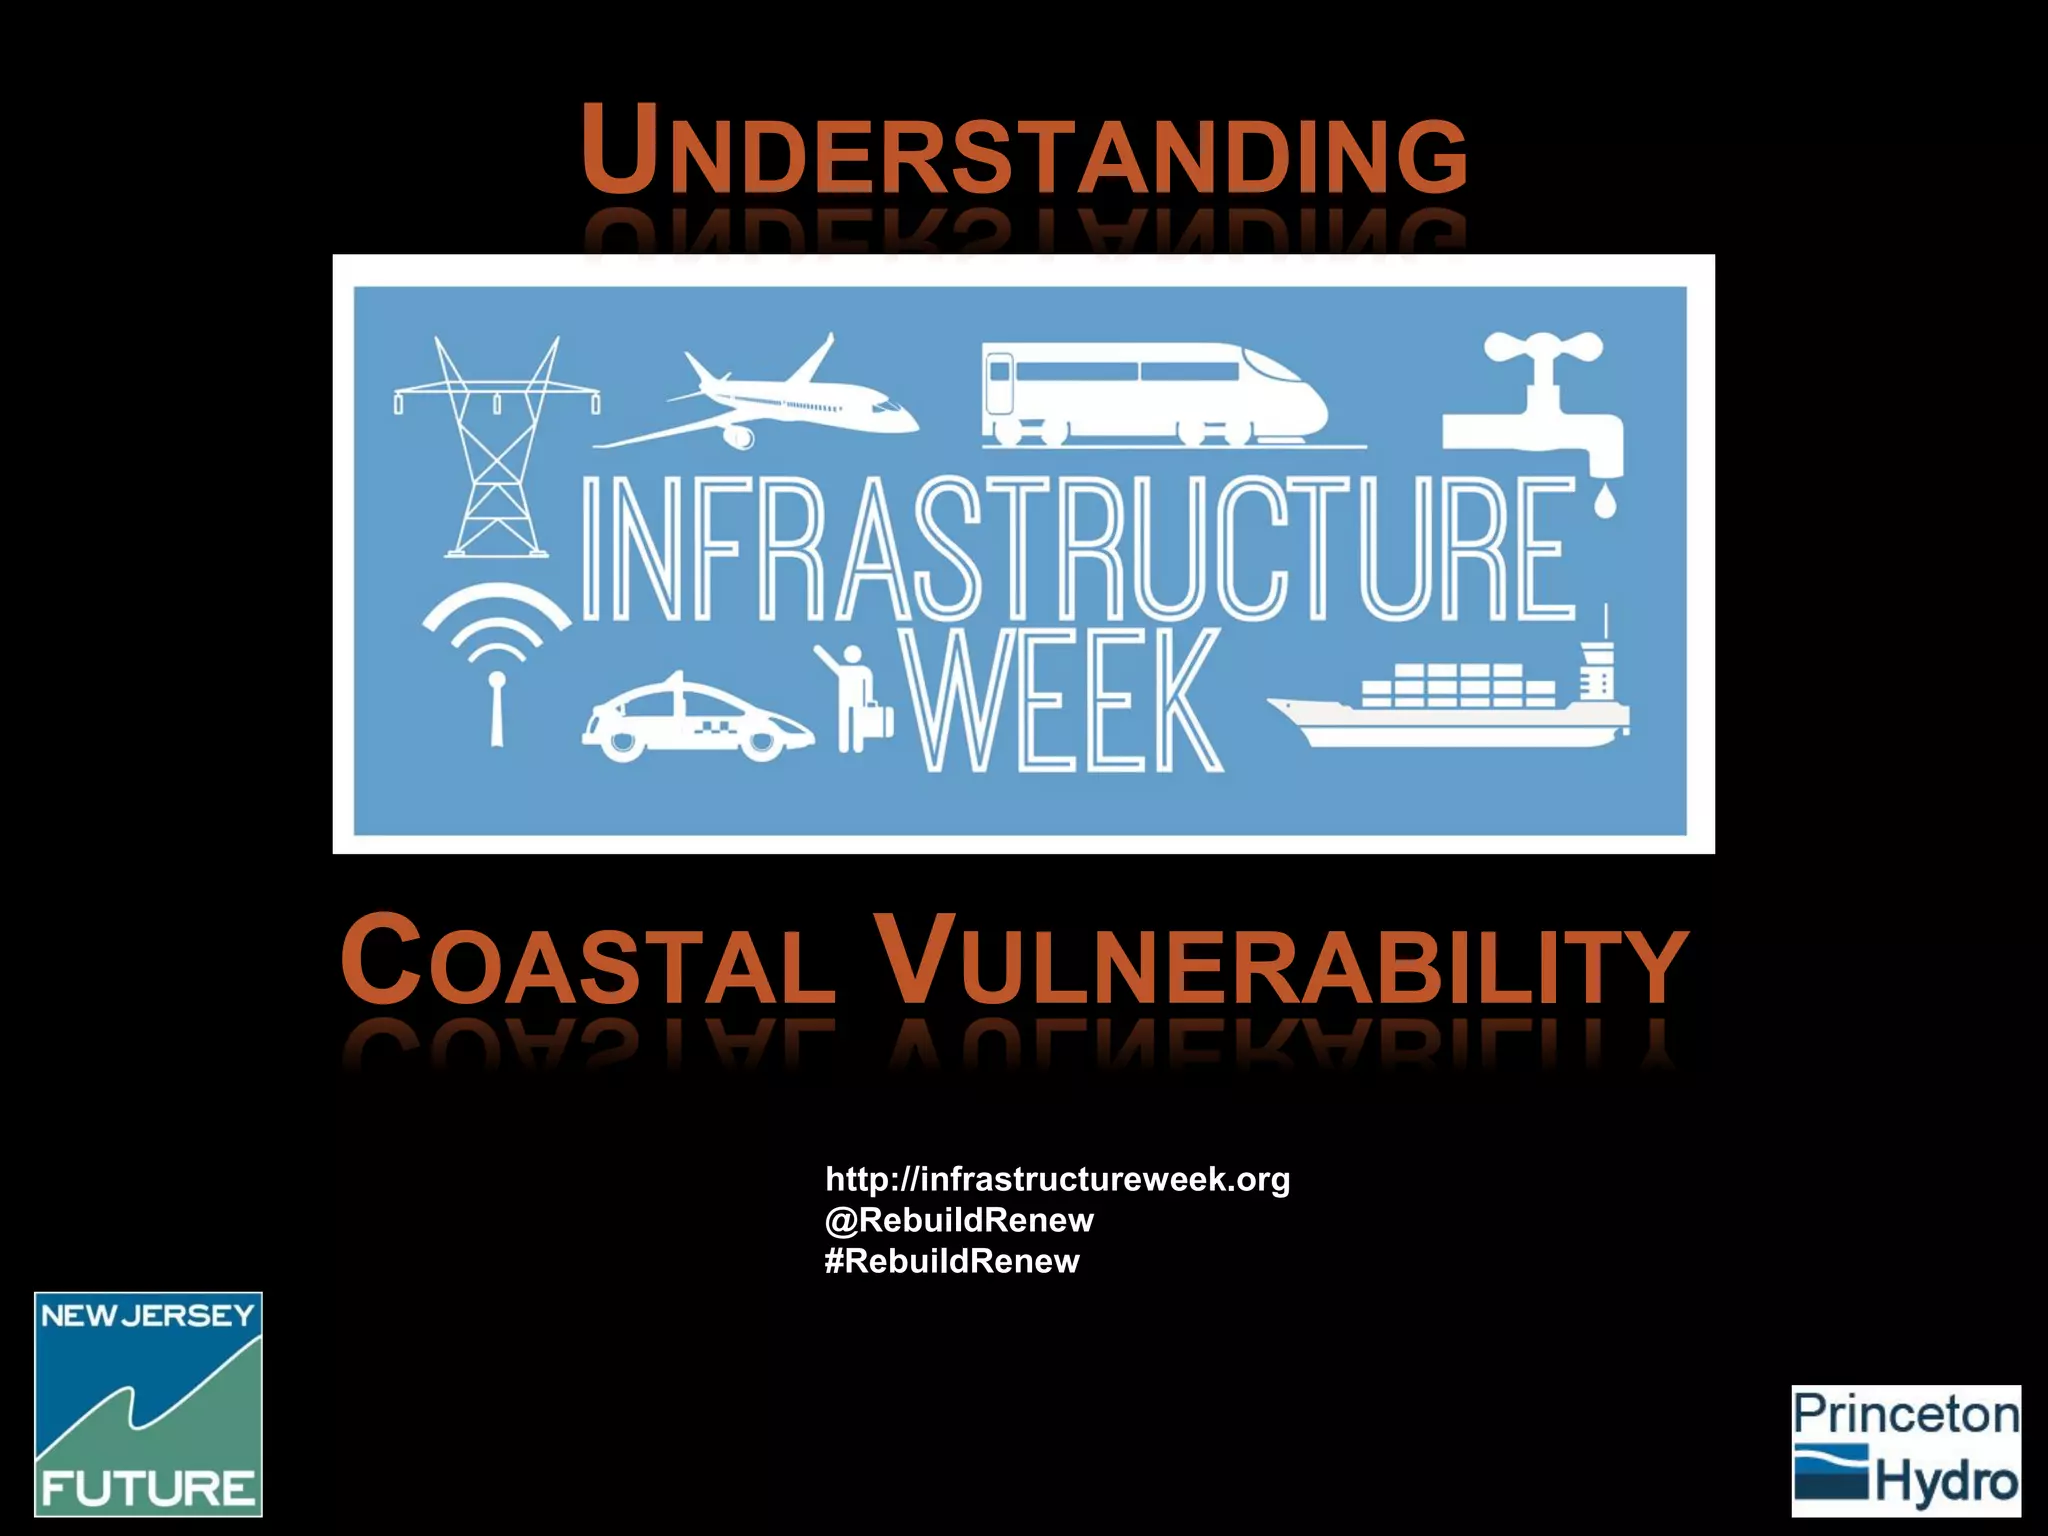


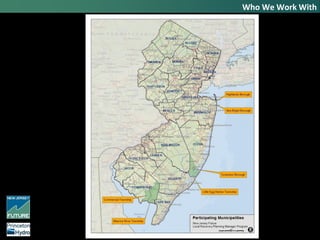
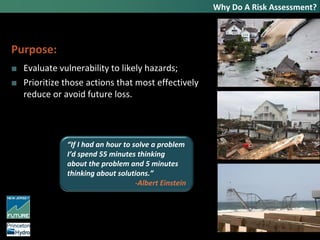

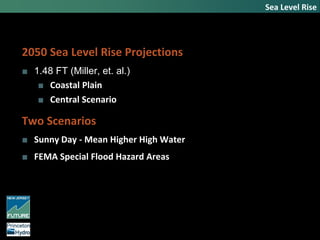


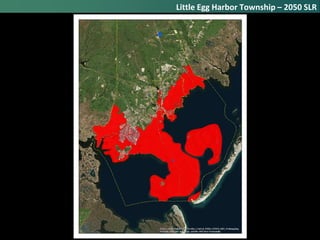
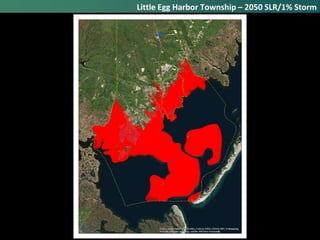
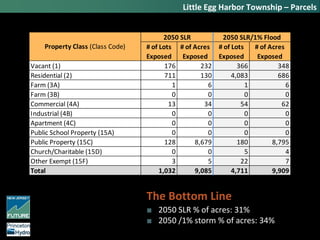
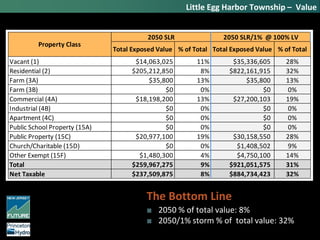
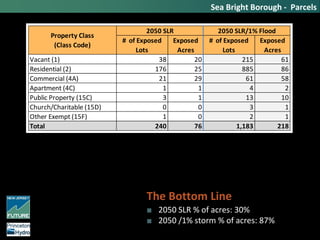
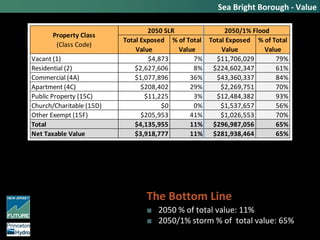

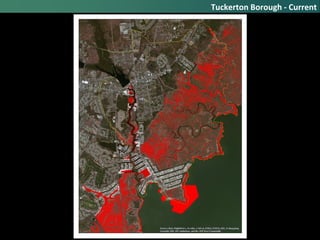
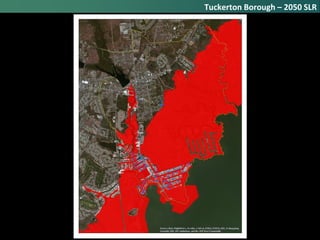
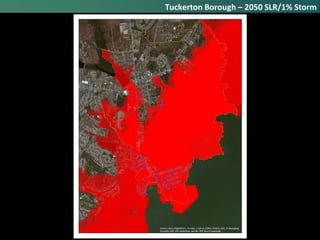
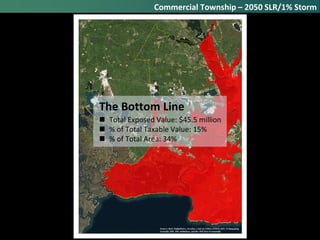
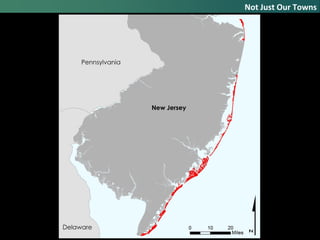

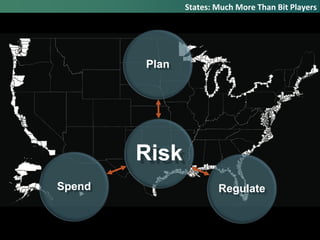
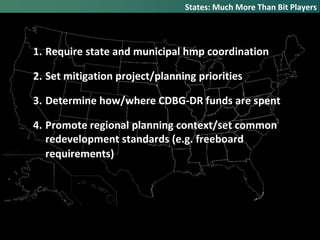


The document discusses the vulnerabilities of coastal areas to rising sea levels and extreme weather events as part of the National Disaster Recovery Framework and Local Recovery Planning Manager Program. It emphasizes the importance of risk assessments to prioritize actions that can mitigate future losses and details methodology and findings regarding projected impacts on various property classes in New Jersey. Additionally, it highlights the need for state and municipal collaboration to drive effective planning and risk management in disaster recovery efforts.


