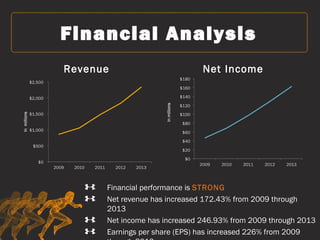
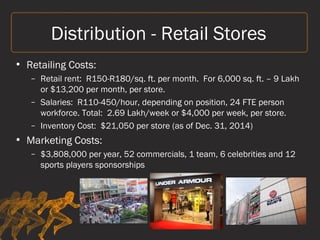
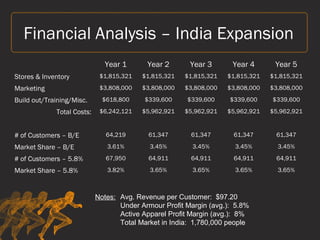
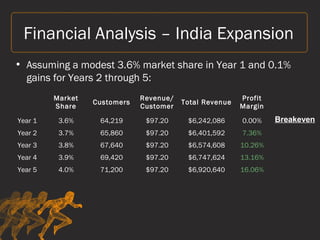
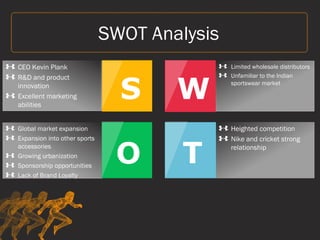
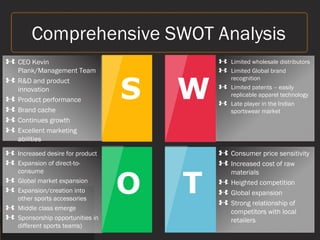
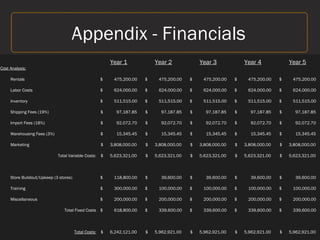
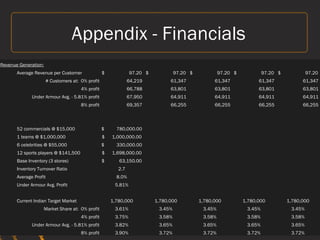
This document provides an analysis for Under Armour's potential expansion into the Indian market. It includes sections on the company's financial performance, business model, reasons for entering India, proposed entry method as a wholly owned subsidiary, supply chain plans, retail store strategy, financial projections, SWOT analysis, and strategic recommendations. The financial analysis projects revenue, costs, and profit over five years with 3 stores and estimates breakeven points based on customer numbers and market share goals.
This project includes the business information about Under Armour, Inc. It demonstrates the mastery of analyzing the current financial position of a company and predicting the future growth.
Comprehensive Analysis on roadmap of strategic management
1) WHERE ARE WE NOW?
2) WHERE DO WE WANT TO GO?
3) HOW DO WE GET THERE?
4) HOW DO WE ENSURE OUR ARRIVAL?
I made this PowerPoint presentation for my Consumer Behavior class in 2006. It was the for a project in which we examined Under Armour's integrated marketing communications, and made recommendations at the end.
How to do Under Armour's SWOT Analysis? Strengths, Weaknesses, Opportunities ...SWOT & PESTLE.com
Check out our latest publication on Under Armour, Inc. which is an American sports equipment company that manufactures and produces footwear, sports and casual apparel.
Check out the SWOT and PESTLE analysis on Under Armour- https://www.swotandpestle.com/under-armour/
The analysis covers the business strategy of Under Armour.
We appreciate Siddhesh Suhas Salkar 's contribution towards this research report.
Follow us @swotandpestle to know more and visit our website - https://www.swotandpestle.com/
NEED HELP WITH YOUR RESEARCH?
Apart from SWOT and PESTLE analysis we also do Value chain analysis, Porter's five forces, BCG Analysis, Segment-Target and Positioning Analysis and other models and analyses to suit customised needs. Place your inquiry here
https://www.swotandpestle.com/solutions/
#UnderArmour #SWOTAnalysisUnderArmour #PESTLEAnalysisUnderArmour #MarketResearchUnderArmour #CustomisedResearchUnderArmour #StrategyUnderArmour #BusinessCasestudyUnderArmour #BusinessStrategyUnderArmour
#SWOTandPESTLEUnderArmour #SWOT #PESTLE #ConsultingUnderArmour
Strategic Sourcing is a print, apparel and promotional products business that takes charge and helps all sized businesses benefit from scale of economy.
Strategic Sourcing’s platform is twofold; first, our aim is to help all sized businesses. With our association with numerous buying groups, affiliations with overseas manufacturers and internal sourcing structure Strategic Sourcing has the ability to accredit fantastic cost savings no matter the size of the purchase. We have the ability to let small and medium sized businesses make purchases of essential procurement and marketing products they were never able to in the past.
Secondly, we have built a better mouse trap for independent sales associates that allows the associate to do what they do best and that is sell. Strategic Sourcing has taken the approach of servicing our sales associates with dedicated customer service representatives that handle all back end operations. Starting with quoting, presentations to invoicing, collections and order follow up. With our SOP, MIS back end system we have the ability to embrace our sales associates with the service they truly need and entertain our customer service representatives with a system that will not bog them down with tedious additional system entrees. Our system is enabled to take a quote and use it as a flow through to the final stage of each job. Additionally, we have enabled a better commission structure that promotes our sales associates to strive for superior results.
With our two fold approach we offer a win win business model.
Cleanomatics is a one-stop on demand cleaning services provider offering fully-fledged primary laundry & dry-cleaning services along with wide array of services including painting services, pest control services, home cleaning, corporate cleaning, shoe repair/clean, carpet & sofa dry cleaning and other related services.
Analysis of Good Knight Market PotentialRinshi Singh
Sector Information, Porters five force model explained, Company Information i.e. Godrej,SWOT Analysis of Godrej, Market growth of Godrej, Product portfolio of Godrej, PLC of Good Knight, SWOT Analysis of Good Knight, Financial Statement of Godrej, Ratio Analysis of Godrej, Human Resource Policy of Godrej, Selection & Recruitment Process of Godrej, Job Description and Job Specification of Godrej, Type of Training provided in Godrej
Inspired from Amazon prime now model of 2 hr delivery, HOP is a hyper local e commerce platform that is my brainchild.
HOP brings all the local vendors or seller's online thereby delivering all the orders to the customers with in 24 hrs. Yes, EVERYTHING IS DELIVERED within a day. The backbone of HOP is to leverage the local vendors and sellers.
Child development classTopic Divorce Impact and ConsequeJinElias52
Child development class
Topic: Divorce: Impact and Consequences
4 Pages APA Format
· Research an approved topic in child development and present findings in a 4 paged paper
· Divorce: Impact and Consequences Is the topic I chose.
· The research paper must include at least 3 references from current (in last 10 years) “peer reviewed” psychology journals or books. These articles must be integrated in the paper and reflect relevant research on your chosen topic.
· Newspaper articles (i.e. New York Times, Wall Street Journal, Newsday) or non-professional magazine articles (i.e. Discover, Science, Psychology Today) (may not be used in the paper.)
· All papers must be written in APA (American Psychological Association) format.
· You can find extensive databases along with expert help from our outstanding librarians at : http://www.molloy.edu/library
3303_Cvr.indd 1 4/9/19 1:09 PM
The cover was printed on French Paper Kraft-tone Cover.
Responsibly produced using Hydro Electric power from 100% post-consumer waste.
3303_Cvr.indd 2 4/10/19 2:43 PM
To explore key stories of the past year and find out what’s ahead, visit Target.com/abullseyeview.
You can view our Annual Report online at Target.com/annualreport.
(Note: Reflects amounts attributable to continuing operations. 2017 was a 53-week year.)
Welcome to our
2018 Annual Report
Financial Highlights
Total 2018 Sales: $74,433 Million
Hardlines
17%
Total Revenue
In Millions
’13 ’14 ’15 ’16 ’17 ’18
2018 Growth: 3.6%
Five-year CAGR: 1.1%
$7
1
,2
7
9
$7
2
,6
1
8
$7
4
,4
9
4
$7
0
,2
7
1
$7
2
,7
1
4
$7
5
,3
5
6
Operating Income
In Millions
’13 ’14 ’15 ’16 ’17 ’18
2018 Growth: -2.7%
Five-year CAGR: -3.0%
$
4
,7
7
9
$
4
,5
3
5
$
4
,8
7
8
$
4
,8
6
4
$
4
,2
2
4
$
4
,1
1
0
Net Earnings
In Millions
’13 ’14 ’15 ’16 ’17 ’18
2018 Growth: 0.8%
Five-year CAGR: 1.7%
$2
,6
9
4
$2
,4
4
9
$3
,3
2
1
$2
,6
6
6
$2
,9
0
8
$2
,9
3
0
Diluted EPS
’13 ’14 ’15 ’16 ’17 ’18
2018 Growth: 4.0%
Five-year CAGR: 5.5%
$4
.2
0
$3
.8
3
$5
.2
5
$4
.5
8
$5
.2
9
$5
.5
0
Home Furnishings
& Décor
19%
Apparel &
Accessories
20%
Food & Beverage
20%
Beauty & Household
Essentials
24%
Brian Cornell, Chairman and CEO
Target 2018 Annual Report
Two years ago, we laid out an ambitious investment agenda to
transform our company – by reimagining our stores, reinventing our
supply chain and fulfillment capabilities, repositioning our owned
brand portfolio and investing in our team. And as I look back on our
performance in 2018, I could not be more proud of all that our team
accomplished.
In 2018, comparable sales rose an industry-leading 5 percent,
driven entirely by growth in traffic. We gained market share in every
major category. And we established a record high for our earnings
per share.
Today, I can say with great confidence that the strategy we laid out
two years ago is working. O ...
TIA Chennai 20-20 Ideas meet presentation - Capacity to Suffer Frameworkperfectresearch
The presentation is an attempt to collate thoughts on the investment process we follow from the Gurus, Mentors and Friends we follow along with our own experience in this field.
*Disclaimer*
1. We are not SEBI registered analysts
2. Educational post only and not a stock recommendation
3. We take no responsibility to keep updating about the business being discussed
4. We may or may not own a position in any of the businesses being discussed and even if we do own a position, we may change our mind due to change in any facts or circumstances
5. Plz consider this post only as a framework to keep tracking businesses and understanding them
2. Financial Analysis
Revenue Net Income
Financial performance is STRONG
Net revenue has increased 172.43% from 2009 through
2013
Net income has increased 246.93% from 2009 through 2013
Earnings per share (EPS) has increased 226% from 2009
3. 3C’s Business Model
Customer – Young urban
professional affluent
consumer
Company- Kevin Plank, 43, is
Founder and CEO of
performance apparel maker
Competitors – Nike, Adidas,
Reebok, and Puma
4. Why India?
Election of Prime Minister Narendra Modi in 2014
Recent Changes to Foreign Direct Investment (FDI)
Competitors
5. Method of Entry
Entry into India will be accomplished by establishing:
Under Armour IndiaUnder Armour India
A wholly-owned subsidiary of Under Armour:
Strategic control and independence
Does not want to repeat competitors’ mistakes
Changing political/regulatory climate
Branding
6. Under Armour India – Supply Chain
• Immediate/Short-term – Exporting
– Goal: Enter India as quickly as possible while
keeping initial investment low
– Solution: Exporting from Asia and Mexico
• Exporting
• Free Trade Warehousing Zones (FTWZ)
• FTWZ Stores Customers
– Costs:
• Container: $1,800 to $2,500 per TEU from Mexico to
Mumbai, India
– Capacity: 15,000 packaged shirts or 8,500 footwear
– Cost: $0.12-0.17/shirt or $0.21-.029/footwear
• Import duty – 18%/CIF and Warehousing – Rs. 92/cf
7. Distribution - Retail Stores
• Establish retail stores in shopping malls
– Mumbai – High Street Phoenix
– New Delhi – Select CityWalk
– Bangalore – Mantri Square
• 5,000-8,000 sq. ft. (North America average is 6,000 sq. ft.)
• Labor sourced locally with training provided by U.S. team
8. Distribution - Retail Stores
• Retailing Costs:
– Retail rent: R150-R180/sq. ft. per month. For 6,000 sq. ft. – 9 Lakh
or $13,200 per month, per store.
– Salaries: R110-450/hour, depending on position, 24 FTE person
workforce. Total: 2.69 Lakh/week or $4,000 per week, per store.
– Inventory Cost: $21,050 per store (as of Dec. 31, 2014)
• Marketing Costs:
– $3,808,000 per year, 52 commercials, 1 team, 6 celebrities and 12
sports players sponsorships
9. Financial Analysis – India Expansion
Year 1 Year 2 Year 3 Year 4 Year 5
Stores & Inventory $1,815,321 $1,815,321 $1,815,321 $1,815,321 $1,815,321
Marketing $3,808,000 $3,808,000 $3,808,000 $3,808,000 $3,808,000
Build out/Training/Misc. $618,800 $339,600 $339,600 $339,600 $339,600
Total Costs: $6,242,121 $5,962,921 $5,962,921 $5,962,921 $5,962,921
# of Customers – B/E 64,219 61,347 61,347 61,347 61,347
Market Share – B/E 3.61% 3.45% 3.45% 3.45% 3.45%
# of Customers – 5.8% 67,950 64,911 64,911 64,911 64,911
Market Share – 5.8% 3.82% 3.65% 3.65% 3.65% 3.65%
Avg. Revenue per Customer: $97.20
Under Armour Profit Margin (avg.): 5.8%
Active Apparel Profit Margin (avg.): 8%
Total Market in India: 1,780,000 people
Notes:
10. • Assuming a modest 3.6% market share in Year 1 and 0.1%
gains for Years 2 through 5:
Financial Analysis – India Expansion
Market
Share
Customers
Revenue/
Customer
Total Revenue
Profit
Margin
Year 1 3.6% 64,219 $97.20 $6,242,086 0.00%
Year 2 3.7% 65,860 $97.20 $6,401,592 7.36%
Year 3 3.8% 67,640 $97.20 $6,574,608 10.26%
Year 4 3.9% 69,420 $97.20 $6,747,624 13.16%
Year 5 4.0% 71,200 $97.20 $6,920,640 16.06%
Breakeven
11. SWOT Analysis
CEO Kevin Plank
R&D and product
innovation
Excellent marketing
abilities
S
Limited wholesale distributors
Unfamiliar to the Indian
sportswear market
W
Heighted competition
Nike and cricket strong
relationship
T
Global market expansion
Expansion into other sports
accessories
Growing urbanization
Sponsorship opportunities
Lack of Brand Loyalty
O
12. Risk Analysis
High Risk:
Demand
Government
Regulation
Medium Risk
Supply
Intellectual
Property
Low Risk
Political Instability
Theft
Counterfeiting
PotentialImpact
Probability
Severe
HighMinimal
DemandSupply
Political
Instability
Theft/
Shrinkage
Intellectual
Property
Counter-
feiting
Government
Regulation
20. 4 Ps of Marketing
Promo
Government
Cricket Players/ Clubs
Bollywood Actors
Football Player/ Clubs
Hockey India League
Sohail Khan
Shah Rukh Khan Juhi Chawla
23. Company Background
Founded in 1996 by Kevin
Plank
Headquarters – Baltimore,
Maryland
Public offering – November
18, 2005, now: NYSE as UA
Worldwide, $2.32 billion
revenue, 7,800 employees
Competitors – Nike, Adidas,
Columbia Sportswear
24. Company Background
To empower athletes everywhere
To make all athletes better through
passion, design, and relentless
pursuit of innovation
To compete with the best
Innovation
International expansion
Direct-to-consumer sales
Vision
Missio
n
Aim
Strategy
Tactics
Expand women’s footwear,
international and direct-to-
consumer business
Diversify brand (golf,
fishing, & hunting)
25. 1999 20051996
Timeline and Management
Founded by
Kevin Plank,
incorporated
in Maryland
Global
expansion
into Asia
market
Global
expansion
into Europe
market
Went public
on NASDAQ
Under Armour
played a
supporting
role in Any
Given Sunday
26. 2007 20092006
Traded on
NYSE as UA
Opened
European HQ
in Amsterdam
2009 –
Formed
alliance with
Ripken
Baseball
Opened first
direct to
consumer
store in
Annapolis,
MD
27. 2012 20142010
Under Armour
surpassed $1
bn in annual
revenue
Deal with
Univ. of Notre
Dame to
provide
uniforms and
athletic
equipment
Michael
Phelps won 7
medals at the
Olympics,
cementing
the Under
Armour name
28. Comprehensive SWOT Analysis
CEO Kevin
Plank/Management Team
R&D and product
innovation
Product performance
Brand cache
Continues growth
Excellent marketing
abilities
S
Limited wholesale distributors
Limited Global brand
recognition
Limited patents – easily
replicable apparel technology
Late player in the Indian
sportswear market
W
Consumer price sensitivity
Increased cost of raw
materials
Heighted competition
Global expansion
Strong relationship of
competitors with local
retailers
T
Increased desire for product
Expansion of direct-to-
consume
Global market expansion
Expansion/creation into
other sports accessories
Middle class emerge
Sponsorship opportunities in
different sports teams)
O
29. State Income per capita
(2013) (Rs.)
% change in Per
Capita Income over
previous year
Delhi 219,979 14.22%
Karnataka 84,709 10.62%
Maharashtra 114,392 10.00%
Population in the 15-24 (for Urban Areas)
State Total Male Female
Delhi 3,3 M 1,8 M 1,5 M
Karnataka
4,6 M 2,3 M 2,3 M
Maharashtra 9,9 M 5,32 M 4,6 M
Place
4 Ps of Marketing
32. Work Cited
"13 Bollywood Stars Who Own Sports Teams | Latest News & Updates at Daily News & Analysis." Dna. 2014. Web. 21
Jan. 2016. <http://www.dnaindia.com/entertainment/report-13-bollywood-stars-who-own-sports-teams-
2013813>.
"2015-16 Outlook for the Retail and Consumer Products Sector in Asia." PwC. Web. 18 Jan. 2016.
<http://www.pwccn.com/webmedia/doc/635593364676310538_rc_outlook_201516.pdf>.
"2023 World Cup Will Be Played Only in India: N Srinivasan." NDTVSports.com. Web. 21 Jan. 2016.
<http://sports.ndtv.com/cricket/news/228030-2023-world-cup-will-be-played-only-in-india-n-srinivasan>.
"Activewear Sales Gain Momentum in Apparel Market - Sourcing Journal." Sourcing Journal ICal. 2014. Web. 21 Jan.
2016. <https://sourcingjournalonline.com/activewear-sales-gain-momentum-apparel-market-monget/>.
"Adidas - Back Soon, Stronger than Ever." Adidas - Back Soon, Stronger than Ever. Web. 21 Jan. 2016.
<http://www.adidas.com/us/messi15.3-indoor-shoes/AF4846.html>.
"Adidas." Wikipedia. Wikimedia Foundation. Web. 21 Jan. 2016. <https://en.wikipedia.org/wiki/Adidas>.
"Best International Schools in Mumbai, India - Ecole Mondiale World School." Cole Mondiale World School. 2013.
Web. 21 Jan. 2016. <http://www.ecolemondiale.org/>.
"Best International Schools in Mumbai, India - Ecole Mondiale World School." Cole Mondiale World School. 2013.
Web. 21 Jan. 2016. <http://www.ecolemondiale.org/>.
"Facebook Logo." Increasing Fitness Culture in India. Web. 21 Jan. 2016.
<https://www.facebook.com/fitnessfirst.hamiltonhouse.cp/videos/1243404319019155/>.
33. Work Cited
"Getting Physical: The Rise of Fitness Culture in America (Culture America) Hardcover – June 12, 2013." Getting
Physical: The Rise of Fitness Culture in America (Culture America): Shelly McKenzie: 9780700619061:
Amazon.com: Books. Web. 21 Jan. 2016. <http://www.amazon.com/Getting-Physical-Fitness-Culture-
Cultureamerica/dp/0700619062>.
"Health & Fitness Tracker Unit Sales Regions Worldwide 2014-2015 | Statistic." Statista. Web. 21 Jan. 2016.
<http://www.statista.com/statistics/413265/health-and-fitness-tracker-worldwide-unit-sales-region/>.
"How Much Do TV Ads Cost in India on Average for 30secs?" Quora. Web. 21 Jan. 2016.
<https://www.quora.com/How-much-do-TV-ads-cost-in-India-on-average-for-30secs>.
"Https://www.kpmg.com/IN/en/IssuesAndInsights/ArticlesPublications/Documents/BBG-Retail.pdf." KPMG. Report,
2014. Web. 18 Jan. 2016.
<https://www.kpmg.com/IN/en/IssuesAndInsights/ArticlesPublications/Documents/BBG-Retail.pdf>.
"India Average Daily Wage Rate | 1965-2016 | Data | Chart | Calendar." India Average Daily Wage Rate | 1965-
2016 | Data | Chart | Calendar. Web. 21 Jan. 2016. <http://www.tradingeconomics.com/india/wages>.
"India's Urban Awakening: Building Inclusive Cities, Sustaining Economic Growth." India's Urban Awakening: Building
Inclusive Cities, Sustaining Economic Growth. Web. 21 Jan. 2016.
<http://www.mckinsey.com/insights/urbanization/urban_awakening_in_india>.
"International Strategy Of Nike In India Marketing Essay Read More:
Http://www.ukessays.com/essays/marketing/international-strategy-of-nike-in-india-marketing-
essay.php#ixzz3xtHYvoKb." UKEssays. Web. 18 Jan. 2016. <International Strategy Of Nike In India Marketing
Essay Read more: http://www.ukessays.com/essays/marketing/international-strategy-of-nike-in-india-
marketing-essay.php#ixzz3xtHYvoKb>.
34. Work Cited
"Latest News." Sports Authority of India, MYAS. Web. 21 Jan. 2016. <http://www.sportsauthorityofindia.nic.in/>.
"List of Shopping Malls in India." Wikipedia. Wikimedia Foundation. Web. 21 Jan. 2016.
<https://en.wikipedia.org/wiki/List_of_shopping_malls_in_India>.
"Mumbai Monthly Climate Average, India." Mumbai, India Weather Averages. Web. 21 Jan. 2016.
<http://us.worldweatheronline.com/mumbai-weather-averages/maharashtra/in.aspx>.
"Narendra Modi." Wikipedia. Wikimedia Foundation. Web. 21 Jan. 2016.
"New Delhi Monthly Climate Average, India." New Delhi, India Weather Averages. Web. 21 Jan. 2016.
<http://us.worldweatheronline.com/new-delhi-weather-averages/delhi/in.aspx>.
"Newly Affluent Indian Consumer Spending More and Differently from Asian Counterparts: PwC Study." PwC. 29 Jan.
2014. Web. 18 Jan. 2016. <http://www.pwc.in/press-releases/2014/newly-affluent-indian-consumer-
spending-more-and-differently-from-asian-counterparts.html>.
"NIC Archives - Page 2 of 12 - Senior Housing News." Senior Housing News. Web. 21 Jan. 2016.
"Nike." Jabong.com. Web. 21 Jan. 2016. <http://www.jabong.com/Nike-Mercurial-Veloce-Ii-Cr-Fg-Black-Football-
Shoes-1775282.html?pos=1>.
"Nike." Nike.com. Web. 21 Jan. 2016. http://store.nike.com/us/en_us/pd/mercurial-superfly-fg-cr7-soccer-cleat/pid-
10297332/pgid-10253927
"Outcomes from ICC Annual Conference Week in London." Http://www.icc-cricket.com. 2013. Web. 21 Jan. 2016.
<http://www.icc-cricket.com/news/2013/media-releases/70819/outcomes-from-icc-annual-conference-
week-in-london>.
35. Work Cited
"Penetration Rate of Sportswear Brands in Turkey 2012-2013 | Statistic." Statista. Web. 21 Jan. 2016.
<http://www.statista.com/statistics/374342/turkish-penetration-rate-of-sportswear-brands/>.
"Reebok India Launch at Odds with Low Price Strategy." AdvertisingAge. 17 Sept. 1997. Web. 18 Jan. 2016.
<http://adage.com/article/news/reebok-india-launch-odds-low-price-strategy/12573/>.
"Reebok India Launch at Odds with Low Price Strategy." Advertising Age News RSS. Web. 21 Jan. 2016.
<http://adage.com/article/news/reebok-india-launch-odds-low-price-strategy/12573/>.
"Shahrukh Khan Okay with Staying Away from Wankhede Stadium." India Latest India News Get Free Indiacom Email
Live Cricket and Entertainment News at IndiaCom. 2014. Web. 21 Jan. 2016.
<http://www.india.com/sports/shahrukh-khan-okay-with-staying-away-from-wankhede-stadium-15249/>.
"Shree Swaminarayan Gurukul International School, Bangalore." Shree Swaminarayan Gurukul International School
Bangalore RSS. Web. 21 Jan. 2016. <http://gurukul.org/bangalore/>.
"Shree Swaminarayan Gurukul International School, Bangalore." Shree Swaminarayan Gurukul International School
Bangalore RSS. Web. 21 Jan. 2016. <http://gurukul.org/bangalore/>.
"The Tiger Roars." BCG. Feb. 2012. Web. 18 Jan. 2016. <https://www.bcg.com/documents/file97584.pdf>.
"Under Armour Inventory Turnover Ratio (COS)." Under Armour (UA) Inventory Turnover Ratio, from Third Quarter
2015 to Third Quarter 2014, Current and Historic Results, Rankings and More, Quarterly Fundamentals. Web.
21 Jan. 2016.
"Under Armour Profit Margin (Quarterly):." Under Armour Profit Margin (Quarterly) (UA). Web. 21 Jan. 2016.
<https://ycharts.com/companies/UA/profit_margin>.
Editor's Notes
Income per capita (2013) in Rupees
Percentage change in Per Capita Income over previous year
Delhi
219,979 (US$3,245)
14.22%
Karnataka
84,709 (US$1250)
10.62%
Maharashtra
114,392 (US$1688)
10.00%
Hockey looks to becoming the new upcoming sport in India and has great growth potential for Under Armour to tap into (HIL, Hockey India League).
Delhi Wave Riders, New Delhi
Debung, Mumbai
Karnataka:
Bangalore is the location of the Sports Authority of India, which was set up by the Ministry of Youth Affairs and Sports in the 1980s. Bangalore as a large following in cricket, with their team winning the Ranji Trophy (the first class cricket championship) in 2014-15, and 2013-14.
Maharashtra:
Mumbai won the Ranji Trophy in 2012-13, winning 40 out of 44 times that the team competed, with a 91% win percentage, with Karnataka in second place with only 57.1% wins percentage.
Delhi
Capital of India, and has hosted the Cricket World Cup four times, and won in 2011. India is also scheduled to host the 2023 ICC cricket world cup, and the first time the India will have hosted this event on their own without other ICC country support.
We also see a great market for Under Armour to tap into in high school age children who play sports with their high school team. Due to Under Armour quality and pricing, we will focus more on student who go to affluent private schools.
Schools:
Shree Swaminarayan Gurukul International School, Bangalore. School offers students a wide range of sports. In addition is has branches in other cities around India, and could help Under Armour grow their network through high school students.
Tuition at private schools ranges between Rs 31,000 (for kindergarteners) up to Rs 96,500 for high school students.
Ecole Mondiale World School
This is one of the most expensive schools in India, located in Mumbai, where tuition ranges from Rs. 6,90,000 to 10,90,000, which is upwards of US$16,000. Since the students going to this school has a higher disposal income than other students in India, we can high potential with the students.
As seen in the chart: Bangalore never gets too cold to need the coldgear technology, we would focus the Speedform and Storm wear more in this area.
New Delhi has a wider range of temperature change and rainfall, it would benefit from all lines that Under Armour has to offer.
Mumbai tends to be a lot higher than other regions, and we would focus the HotGear and Storm, as it tends to have high rainfall in June until September.
http://pib.nic.in/newsite/PrintRelease.aspx?relid=123563
http://us.worldweatheronline.com/bangalore-weather-averages/karnataka/in.aspx
CEO/Founder – Kevin Plank
University of Maryland football player
Tired of repeatedly changing cotton shirt during game
Created new line of apparel “performance apparel”
Board of Directors
CEOs, former CEOs, CFOs, Admirals (Ret.) and Partners of leading conglomerates, industry and the United States Navy
Transition effect for timeline, slide 1
(Basic)
Tip: This transition works well for graphics that horizontally span more than one slide.
To reproduce the shape effects on this slide, do the following:
On the Home tab, in the Slides group, click Layout, and then click Blank.
On the Home tab, in the Drawing group, click Shapes, and then under Block Arrows, click Chevron (second row, eighth option from the left). On the slide, drag to draw a long, horizontal chevron shape.
Select the chevron. Under Drawing Tools, on the Format tab, in the Size group, do the following:
In the Shape Height box, enter 0.7”.
In the Shape Width box, enter 9.48”.
Drag the chevron so that the right end is beyond the right edge of the slide, and the left end of the chevron is approximately one inch to the right of the left edge of the slide.
Select the chevron. Under Drawing Tools, on the Format tab, in the Shape Styles group, click the arrow next to Shape Fill, point to Gradient, and then click More Gradients.
In the Format Shape dialog box, click Fill in the left pane, select Gradient fill in the Fill pane, and then do the following:
In the Type list, select Linear.
Click the button next to Direction, and then click Linear Up (second row, second option from the left).
Under Gradient stops, click Add gradient stop or Remove gradient stop until a total of four gradient stops appear in the slider.
Also under Gradient stops, customize the gradient stops as follows:
Select the first stop in the slider, and then do the following:
In the Position box, enter 0%.
Click the button next to Color, and then under Theme Colors click White, Background 1 (first row, first option from the left)
Select the next stop in the slider, and then do the following:
In the Position box, enter 36%.
Click the button next to Color, click More Colors, and then in the Colors dialog box, on the Custom tab, enter values for Red: 213, Green: 219, Blue: 221.
Select the next stop in the slider, and then do the following:
In the Position box, enter 73%.
Click the button next to Color, click More Colors, and then in the Colors dialog box, on the Custom tab, enter values for Red: 178, Green: 190, Blue: 194.
Select the last stop in the slider, and then do the following:
In the Position box, enter 100%.
Click the button next to Color, click More Colors, and then in the Colors dialog box, on the Custom tab, enter values for Red: 213, Green: 219, Blue: 221.
Also in the Format Shape dialog box, click Line Color in the left pane, and then select No line in the Line Color pane.
Also in the Format Shape dialog box, click Shadow in the left pane, and then do the following in the Shadow pane:
Click the button next to Presets, and then under Outer click Offset Bottom (first row, second option from the left).
In the Transparency box, enter 60%.
In the Size box, enter 100%.
In the Blur box, enter 4 pt.
In the Angle box, enter 90°.
In the Distance box, enter 3 pt.
Also in the Format Shape dialog box, click 3-D Format in the left pane. In the 3-D Format pane, under Bevel, click the button next to Top, and then under Bevel click Circle (first row, first option from the left). Next to Top, in the Width box, enter 4 pt, and in the Height box, enter 4 pt.
On the Insert tab, in the Text group, click Text Box, and then on the slide, drag to draw the text box.
Enter text in the text box, select the text, and then on the Home tab, in the Font group, select Gill Sans MT Condensed from the Font list, enter 26 in the Font Size box, click Bold, click the arrow next to Font Color, and then under Theme Colors click White, Background 1, Darker 50% (sixth row, first option from the left).
On the Home tab, in the Paragraph group, click Center to center the text in the text box.
Select the text box. On the Home tab, in the Clipboard group, click the arrow to the right of Copy, and then click Duplicate. Repeat this process to create a total of three text boxes.
Click in each of the two duplicate text boxes, and then edit the text.
Drag the text boxes onto the chevron shape to form a row.
Press CTRL+A to select all the objects on the slide. On the Home tab, in the Drawing group, click Arrange, point to Align, and then do the following:
Click Align to Slide.
Click Align Middle.
Press and hold SHIFT, and then select all three text boxes. On the Home tab, in the Drawing group, click Arrange, and under Position Objects, point to Align, and then do the following:
Click Align to Slide.
Click Distribute Horizontally.
To reproduce the animation effects on this slide, do the following:
On the Transitions tab, in the Transition to This Slide group, click More, and then under Subtle click Push.
Also on the Transitions tab, in the Transitions to This Slide group, click Effect Options and then click From Right.
Also on the Transitions tab, in the Timing group, in the Duration box, enter 1.00.
Transition effect for timeline, slide 2
(Basic)
Tip: This slide is the second slide in a three-slide sequence.
To reproduce the effects on this slide, do the following:
In the Slides and Outline pane, right-click the previous slide (“Transition effect for timeline, slide 1”) and click Duplicate Slide.
Select each of the three text boxes on the slide and change the text.
Select the chevron shape on the slide. Drag the left sizing handle to the left so that the chevron shape extends past the left edge of the slide.
Transition effect for timeline, slide 3
(Basic)
Tip: This slide is the second slide in a three-slide sequence.
To reproduce the effects on this slide, do the following:
In the Slides and Outline pane, right-click the previous slide (“Transition effect for timeline, slide 2”) and click Duplicate Slide.
Select each of the three text boxes on the slide and change the text.
Select the chevron shape on the slide. Drag the right sizing handle to the left so that the right edge of the chevron shape is 0.5” from the right edge of the slide.
http://pib.nic.in/newsite/PrintRelease.aspx?relid=123563
The three cities we will be targeting will be: New Delhi, Delhi; Bangalore, Karnataka; and Mumbai, Maharashtra. Delhi has one of the highest per capita income in the state of India, followed by Maharashtra and then Karnataka. In addition, all three states have significate growth rates in per capita income over the previous year.
State
Income per capita (2013) in Rupees
Percentage change in Per Capita Income over previous year
Delhi
219,979 (US$3,245)
14.22%
Karnataka
84,709 (US$1250)
10.62%
Maharashtra
114,392 (US$1688)
10.00%
Source: http://pib.nic.in/newsite/PrintRelease.aspx?relid=123563
Hockey looks to becoming the new upcoming sport in India and has great growth potential for Under Armour to tap into (HIL, Hockey India League).
Karnataka:
Bangalore is the location of the Sports Authority of India, which was set up by the Ministry of Youth Affairs and Sports in the 1980s. Bangalore as a large following in cricket, with their team winning the Ranji Trophy (the first class cricket championship) in 2014-15, and 2013-14.
Maharashtra:
Mumbai won the Ranji Trophy in 2012-13, winning 40 out of 44 times that the team competed, with a 91% win percentage, with Karnataka in second place with only 57.1% wins percentage.
Delhi
Capital of India, and has hosted the Cricket World Cup four times, and won in 2011. India is also scheduled to host the 2023 ICC cricket world cup, and the first time the India will have hosted this event on their own without other ICC country support.
We also see a great market for Under Armour to tap into in high school age children who play sports with their high school team. Due to Under Armour quality and pricing, we will focus more on student who go to affluent private schools.
Schools:
Shree Swaminarayan Gurukul International School, Bangalore. School offers students a wide range of sports. In addition is has branches in other cities around India, and could help Under Armour grow their network through high school students.
Tuition at private schools ranges between Rs 31,000 (for kindergarteners) up to Rs 96,500 for high school students.
Ecole Mondiale World School
This is one of the most expensive schools in India, located in Mumbai, where tuition ranges from Rs. 6,90,000 to 10,90,000, which is upwards of US$16,000. Since the students going to this school has a higher disposal income than other students in India, we can high potential with the students.