Downloaded 96 times


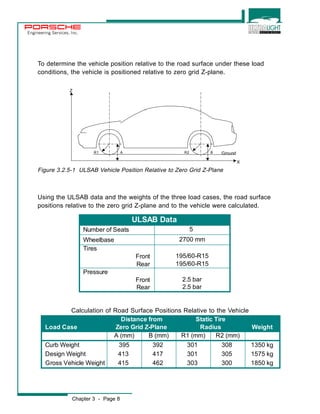
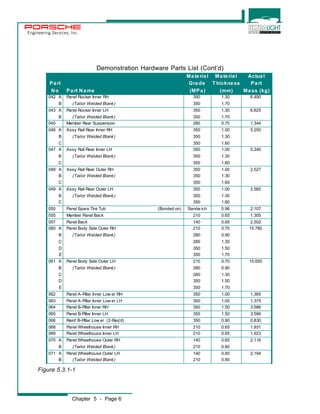
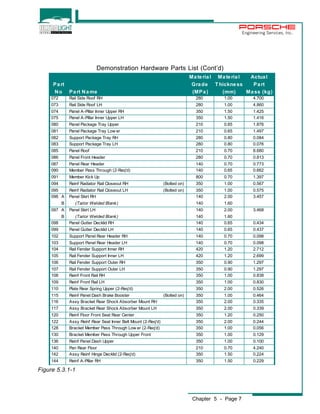
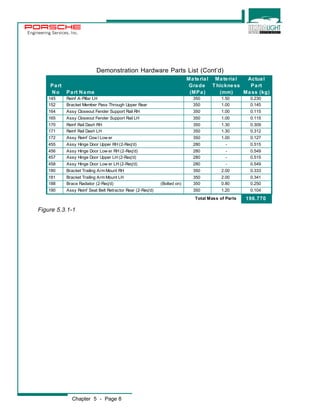
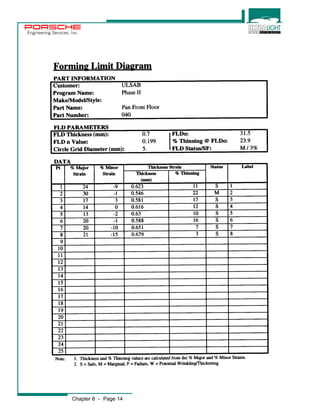
![Engineering Services, Inc.
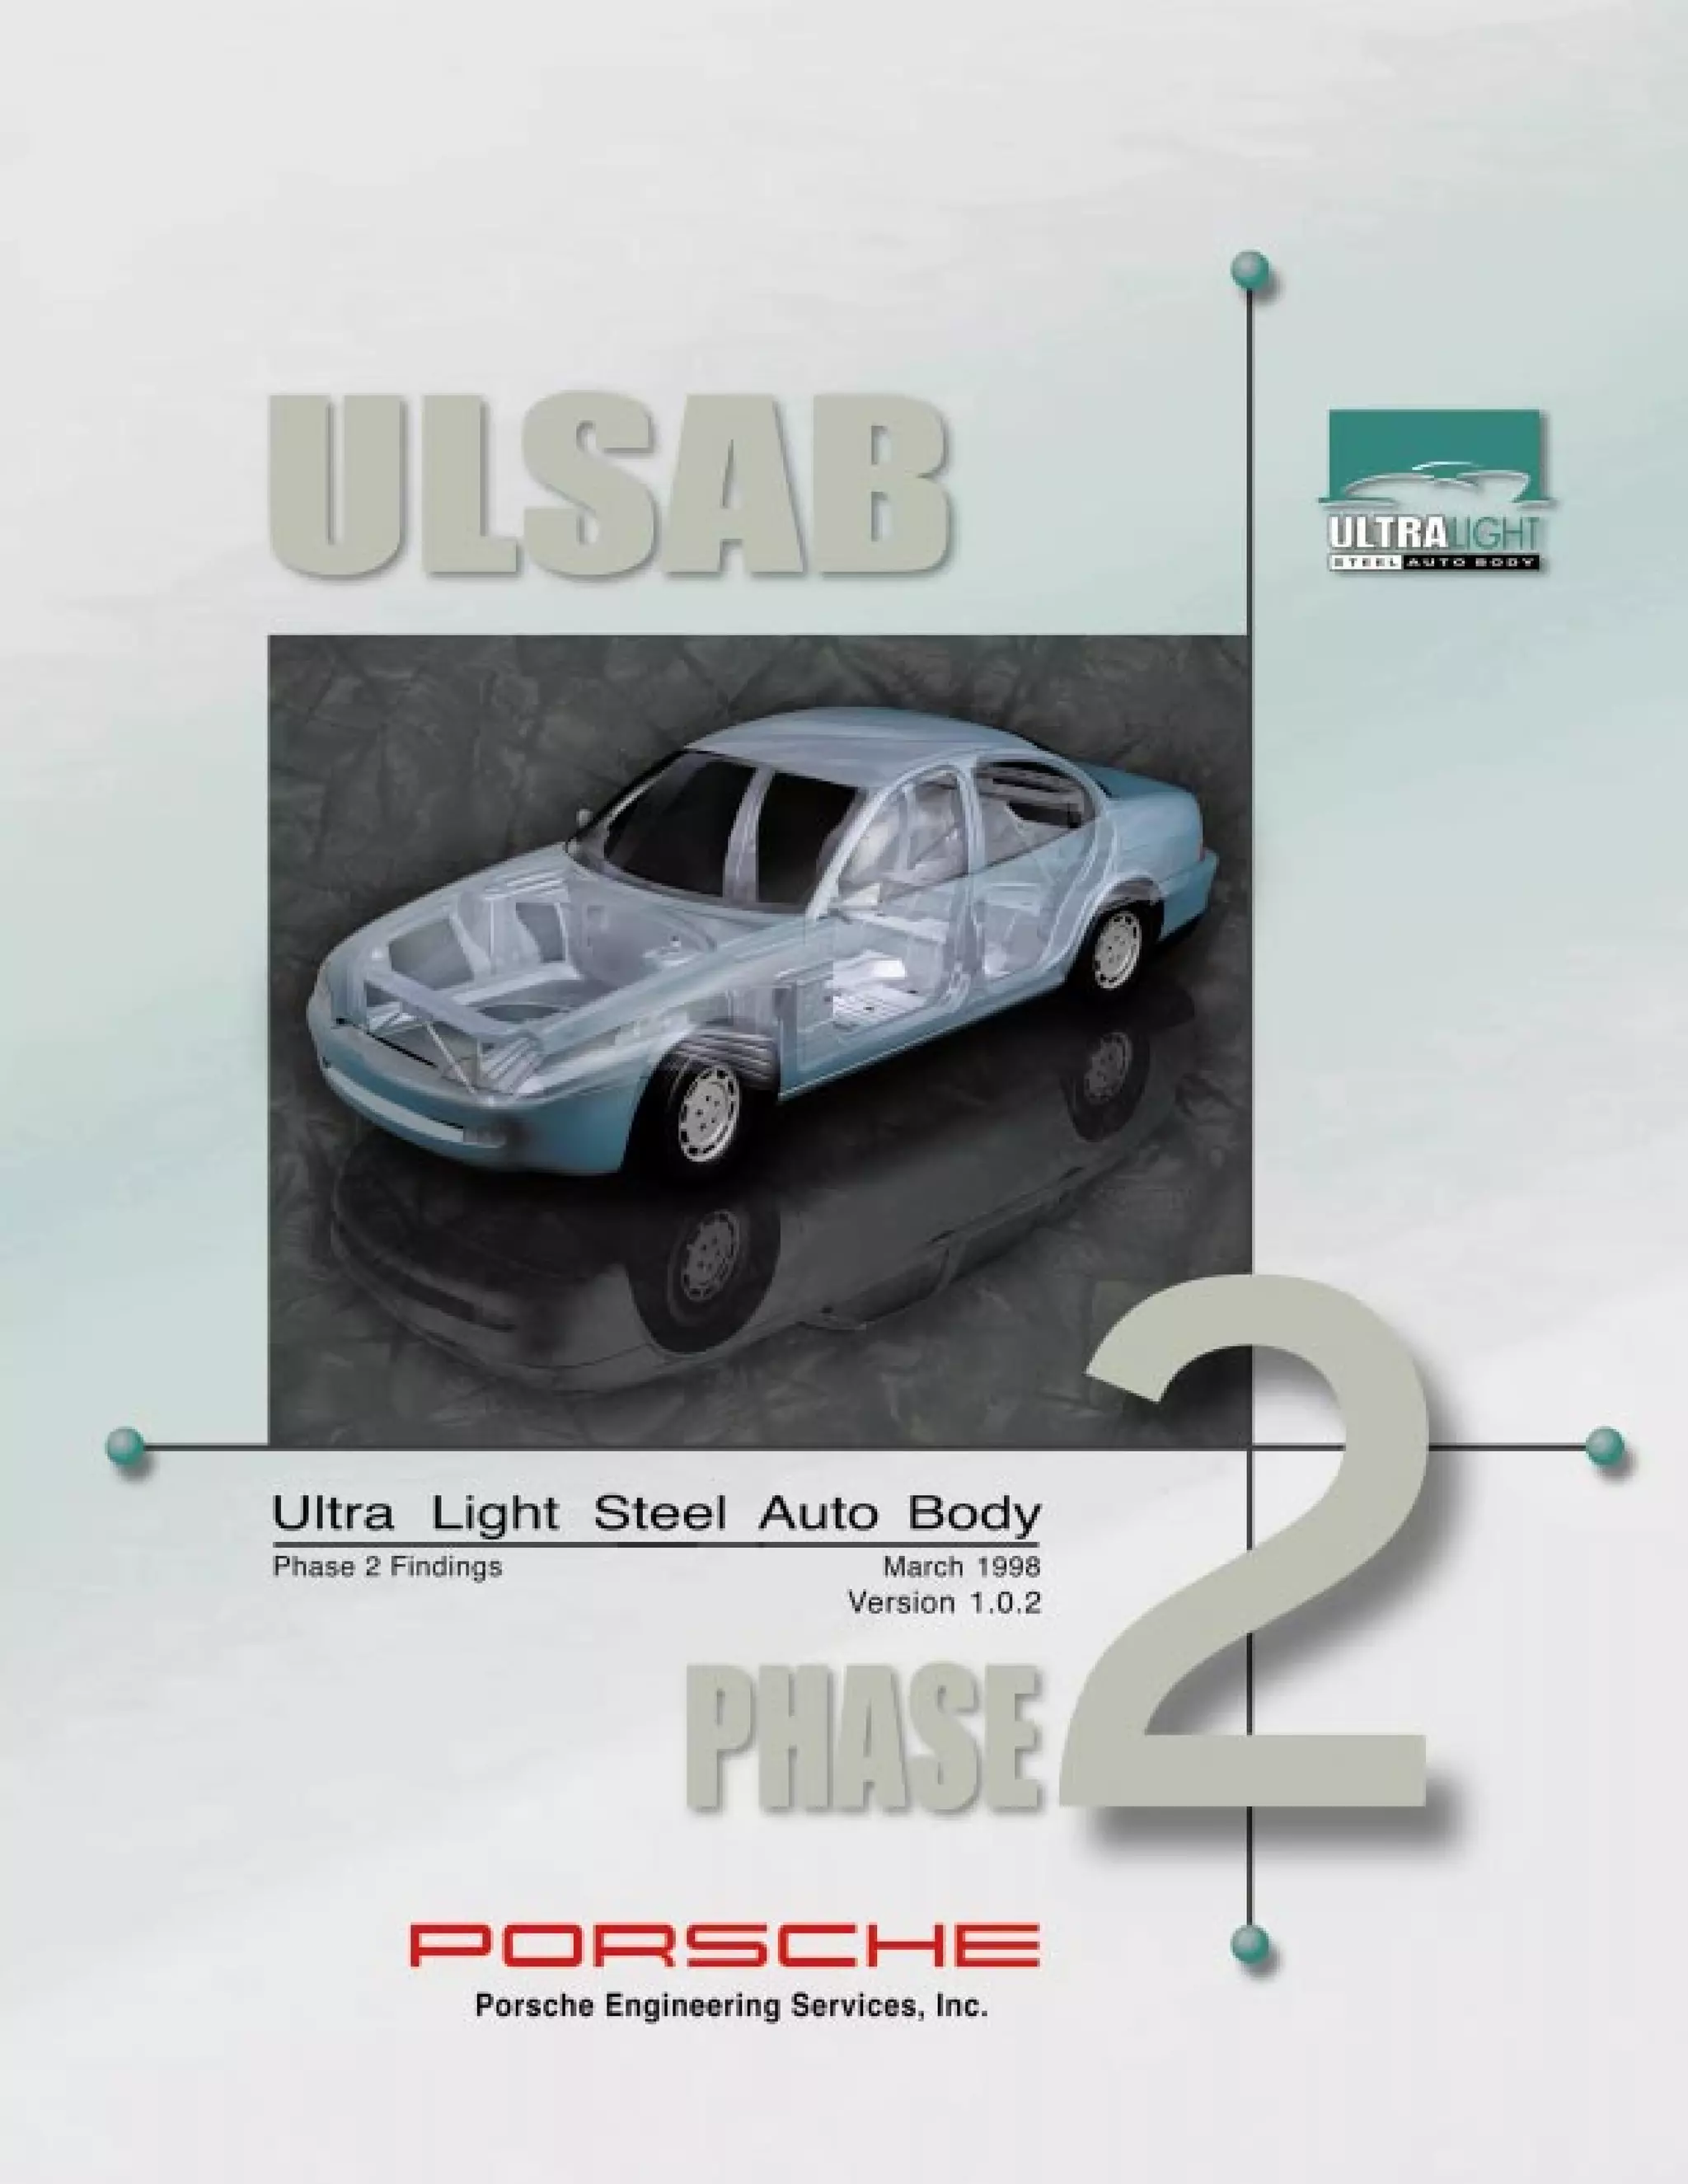
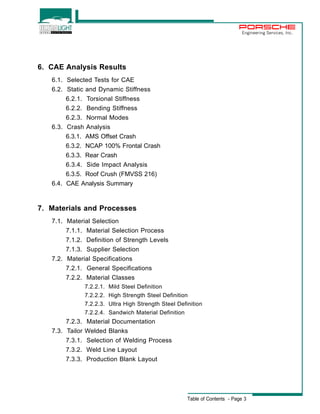
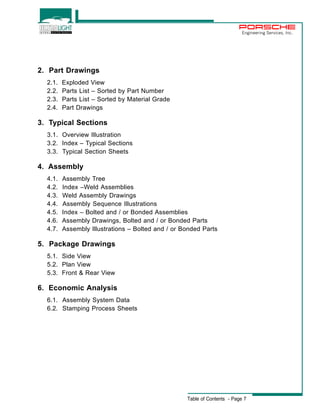
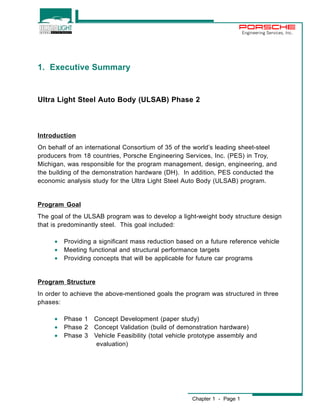
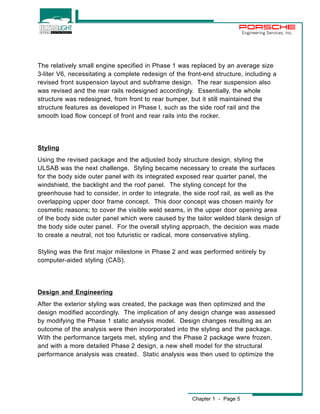
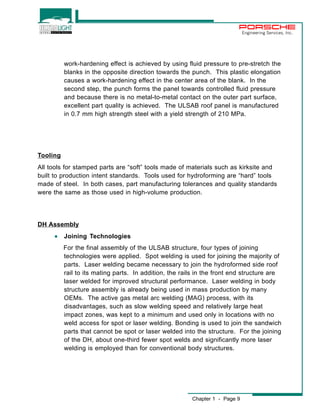
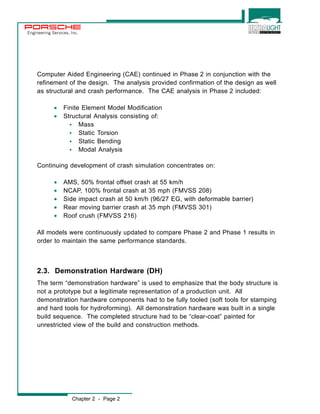
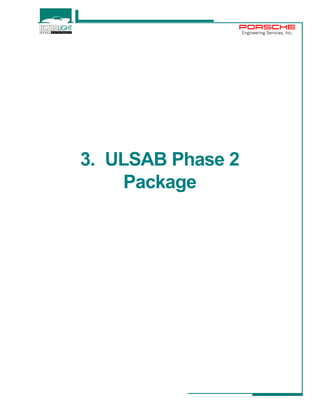
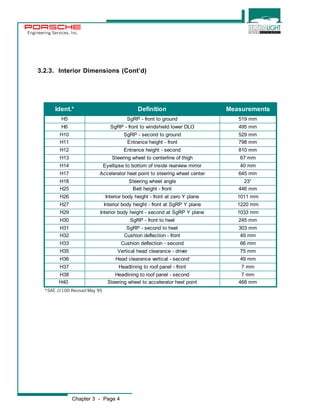
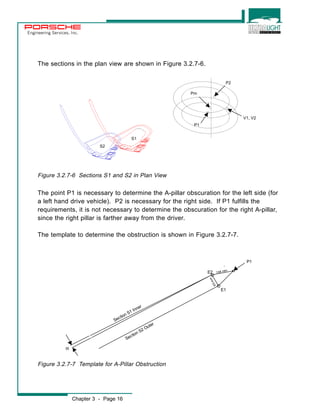
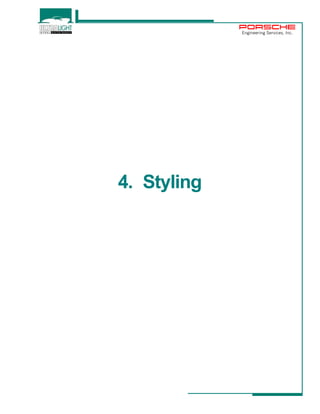
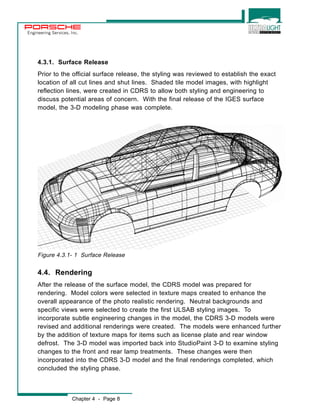
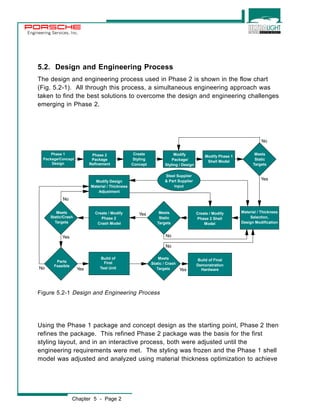
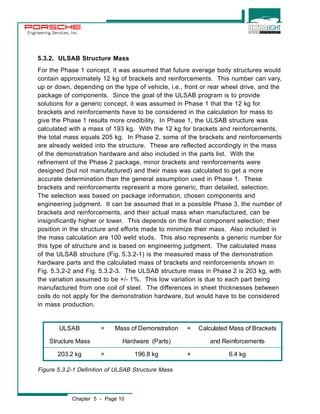
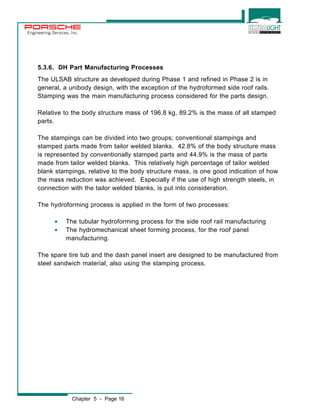
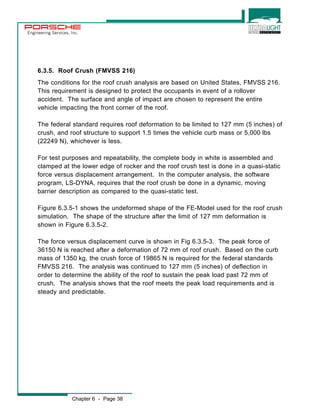
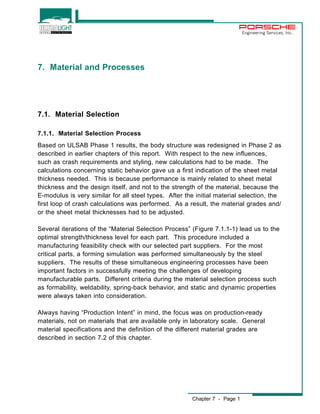
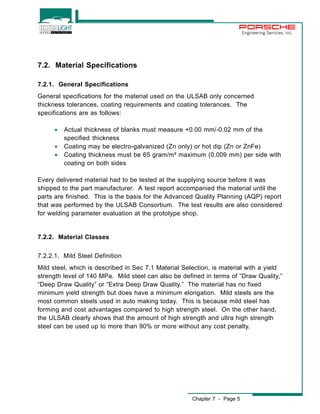
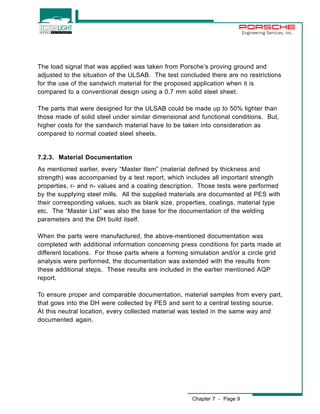
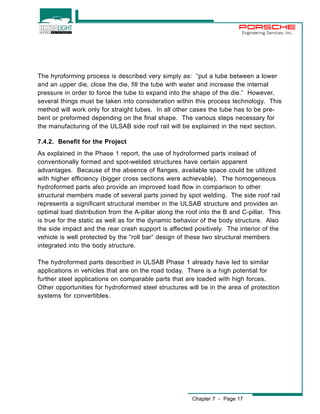
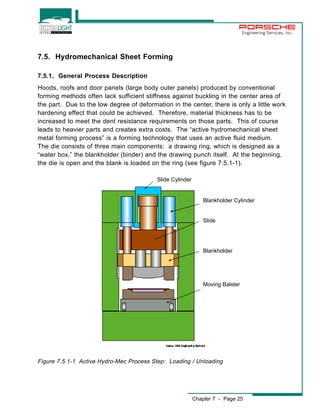
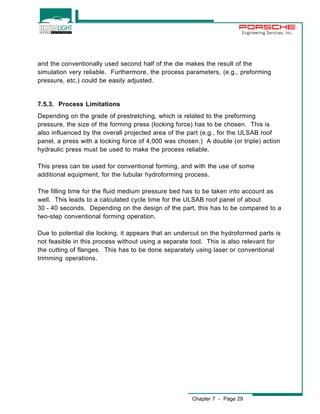
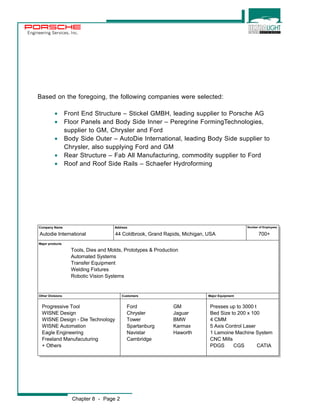
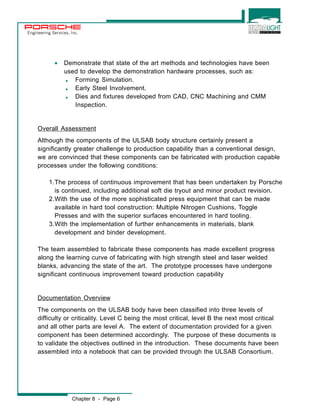
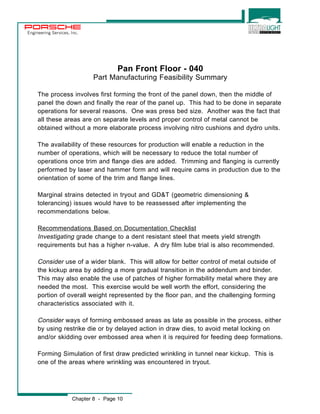
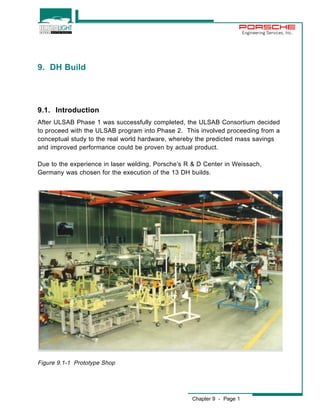
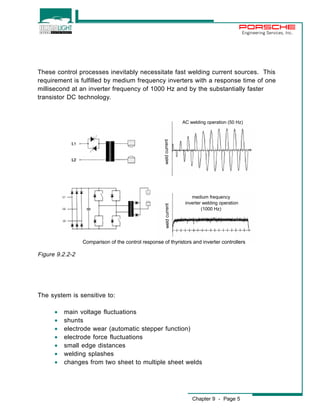
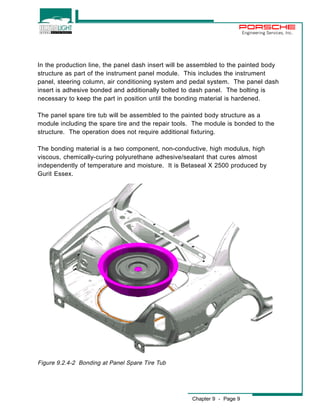
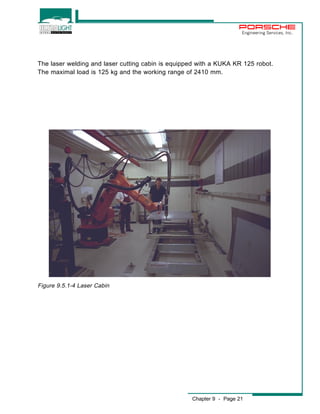
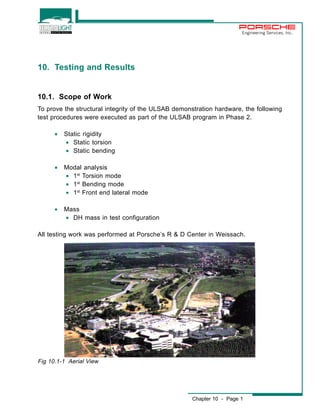
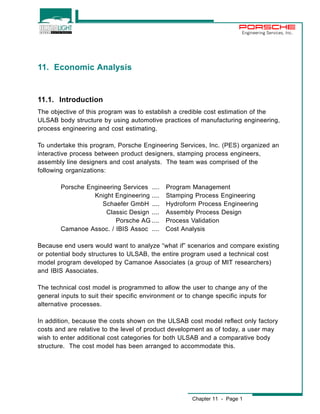
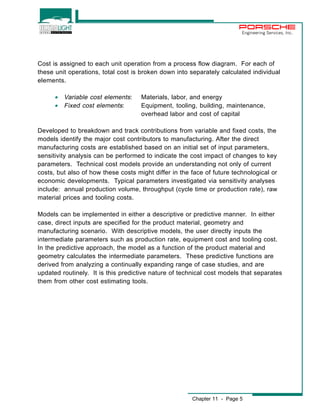
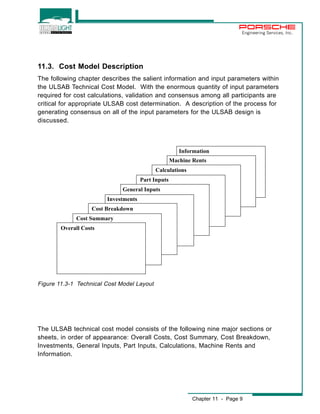
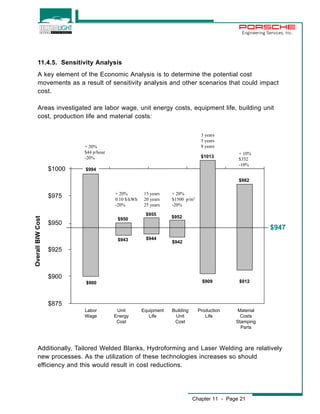
Designed Brackets not Manufactured but
Considered Part of the ULSAB Structure
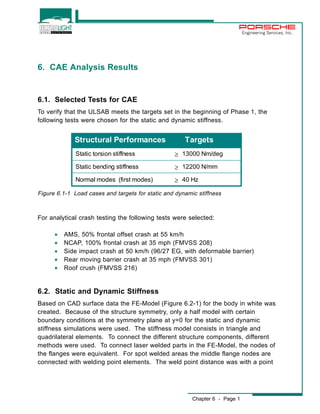
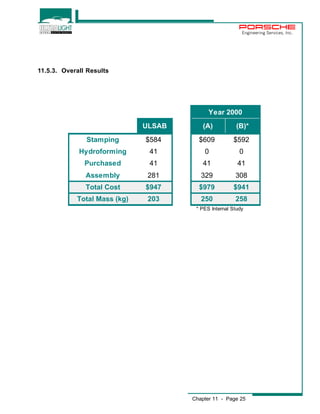
Part No Name Qty Calc Mass [Kg]
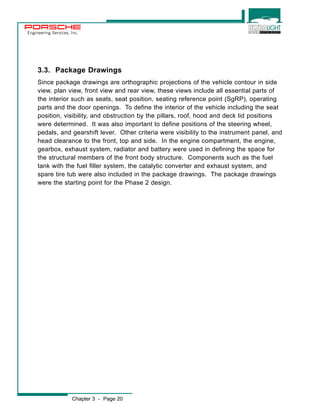
331 Bracket Exhaust Mount 2 0.060
332/333 Bracket Engine Mount RH/LH 2 0.528
334/335 Bracket Fender Mount Rear RH/LH 2 0.228
336 Bracket Battery Tray 1 0.412
337 Bracket Spare Tire Mount 1 0.089
338/339 Bracket Fuel Tank Mount Rear RH/LH 2 0.242
340 Bracket Front Tie Dow n Hook 2 0.236
341 Bracket Rear Tie Dow n Hook 2 0.236
342/343 Bracket Front Jack Support RH/LH 2 0.656
344/345 Bracket Rear Jack Support RH/LH 2 0.548
346 Bracket Plenum Support Center 1 0.445
N/A Weld Studs ~ 100 - 0.300
TOTAL 19 3.980
Chapter 5 - Page 11
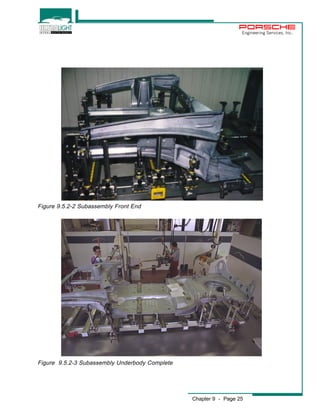
Figure 5.3.2-2
Figure 5.3.2-3
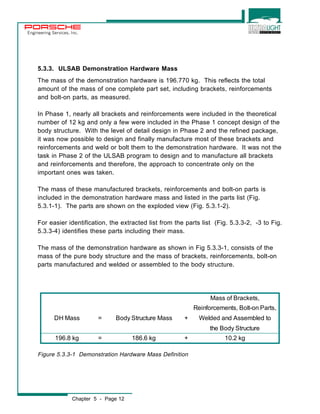
Designed Reinforcements not Manufactured but
Considered Part of the ULSAB Structure
Part No Name Qty Calc Mass [Kg]
310 Reinf Hood Hinge Mount 2 0.086
311 Reinf Instrument Panel Beam Mount 2 0.134
312/313 Reinf Sub-Frame Front Mount 2 0.050
314/315 Reinf Sub-Frame Center Mount 2 0.116
316/317 Reinf Sub-Frame Rear Mount 2 0.418
318 Reinf Steering Rack Assembly Mount RH 1 0.032
319 Reinf Steering Rack Assembly Mount LH 1 0.041
320 Reinf Gear Shift Mount 1 0.271
321 Reinf Front Door Lock Striker 2 0.106
322 Reinf Front Door Check Arm 2 0.030
323 Reinf Rear Door Lock Striker 2 0.146
324 Reinf Rear Door Check Arm 2 0.028
325 Reinf Front D-Ring Adjustment 2 0.298
326 Reinf Rear Seat Cushion Mount 2 0.140
327 Reinf Rear Seat Latch 2 0.068
328 Reinf Rear Seat Back Mount Outer 2 0.278
329 Reinf Rear Seat Back Mount Center 1 0.035
330 Reinf Deck Lid Latch 1 0.136
TOTAL 31 2.413](https://image.slidesharecdn.com/ulsabengrptcomplete-141013204259-conversion-gate01/85/Ulsab-engineer-report-complete-76-320.jpg)
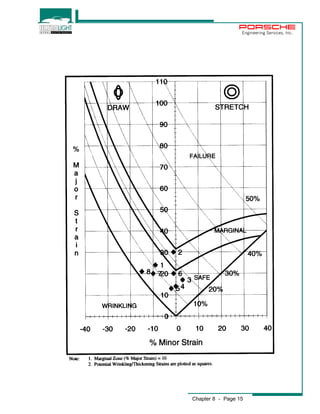
![Engineering Services, Inc.
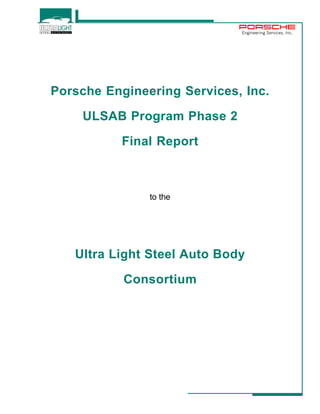
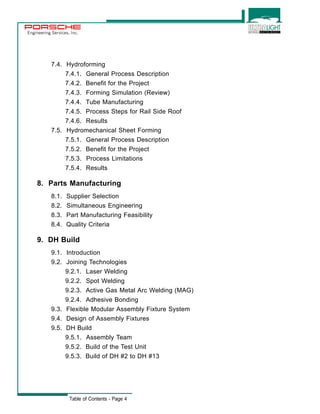
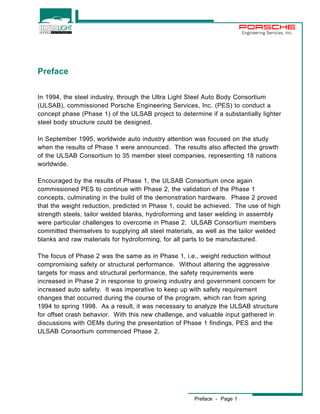
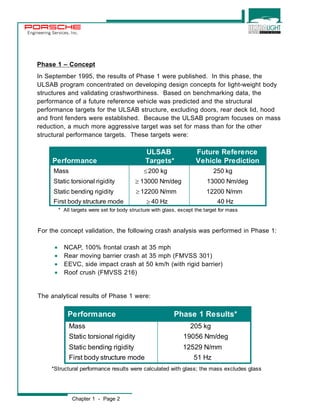
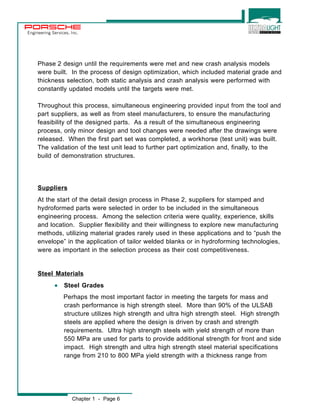
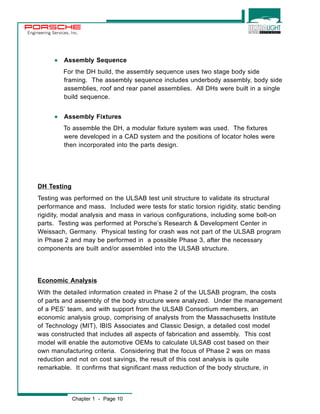
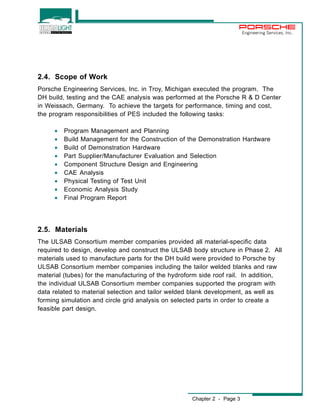
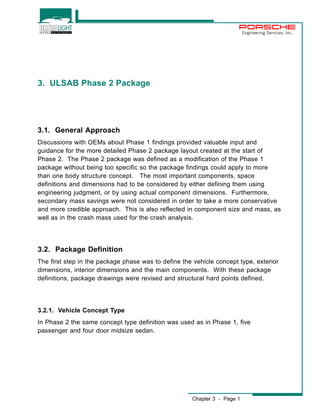
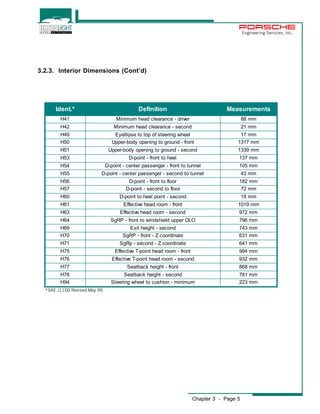
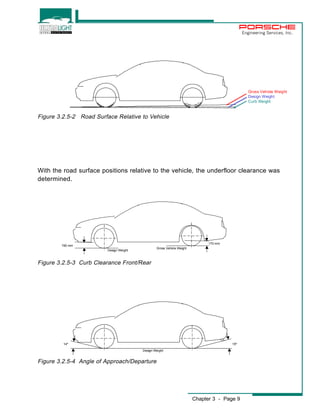
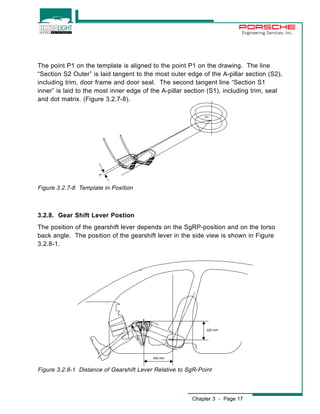
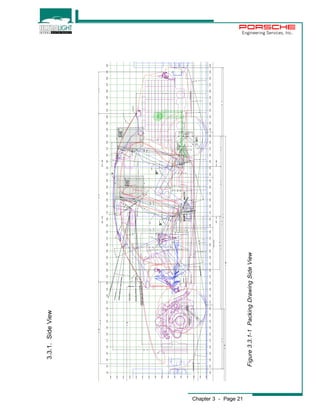
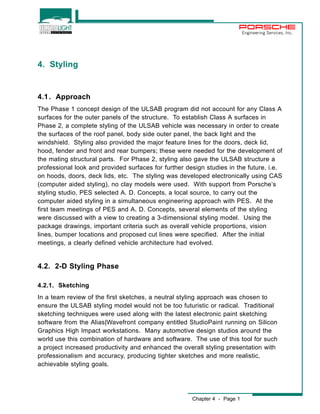
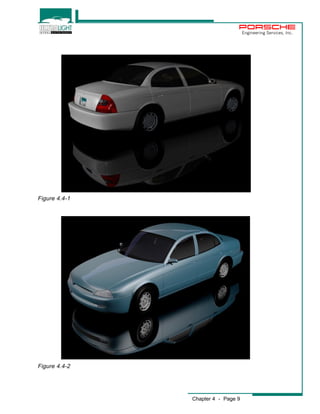
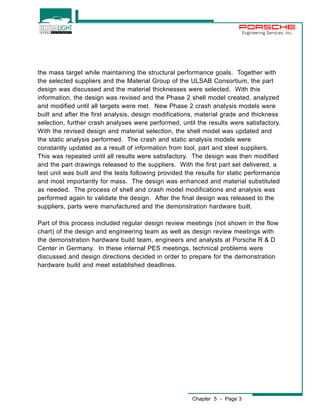
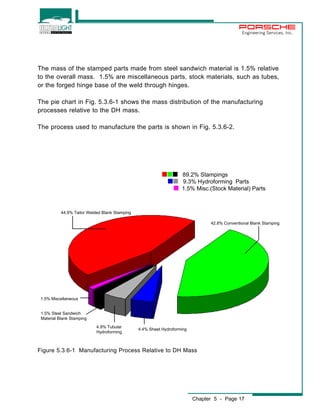
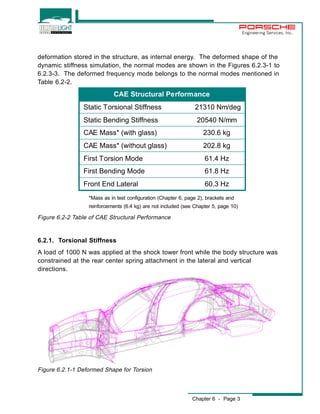
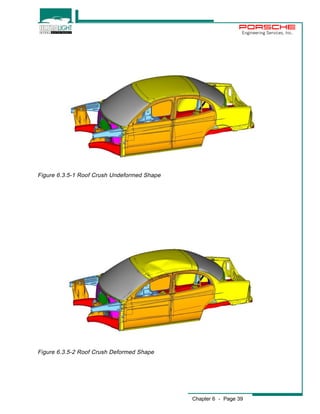
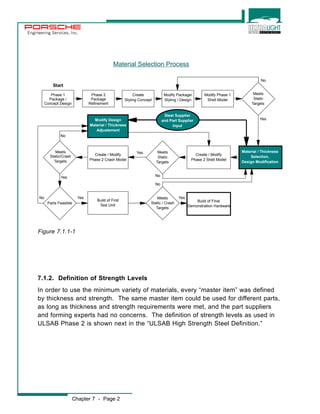
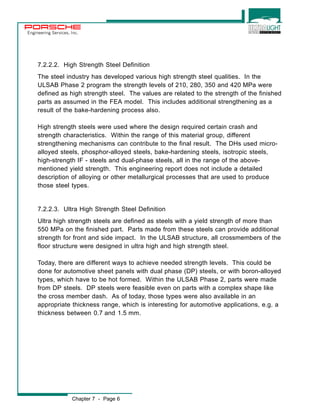
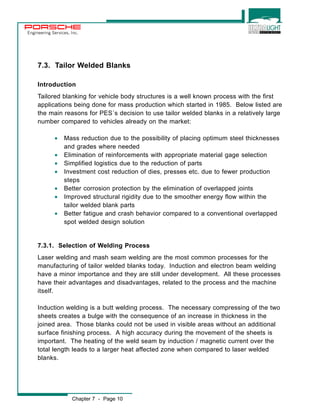
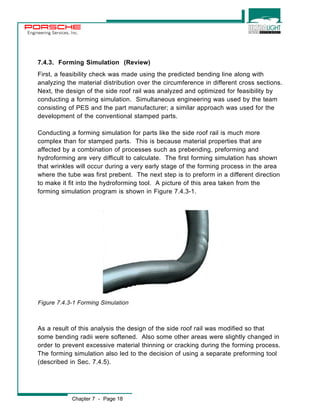
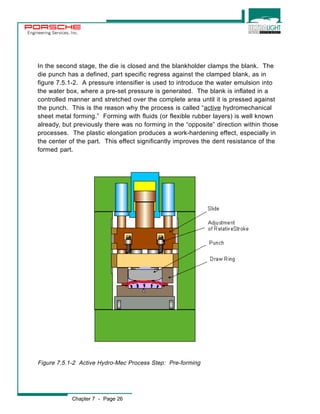
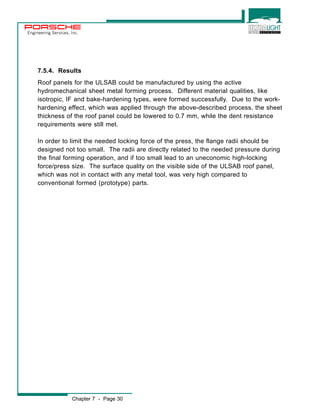
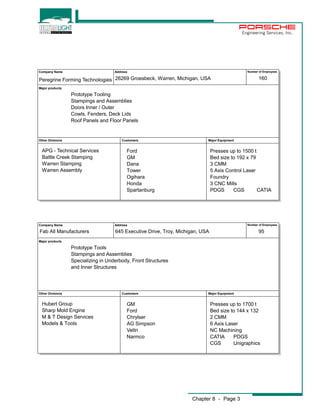
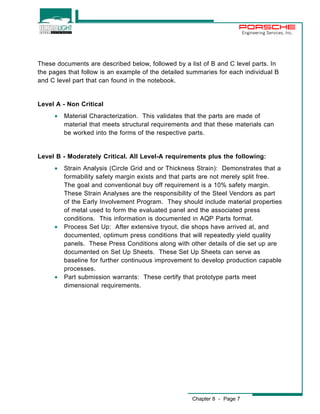
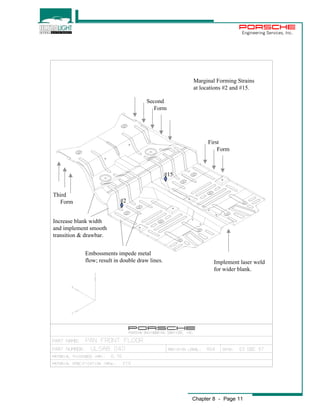
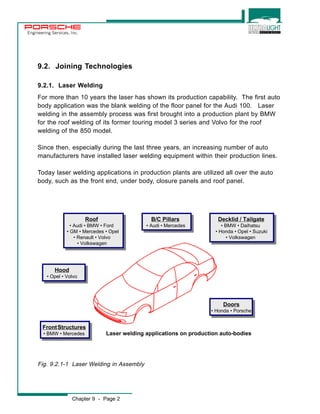
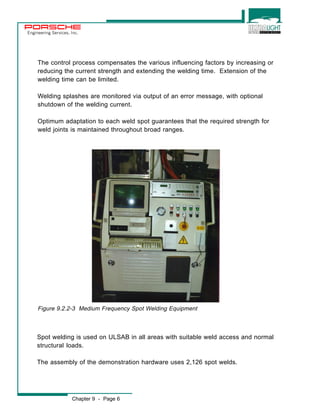
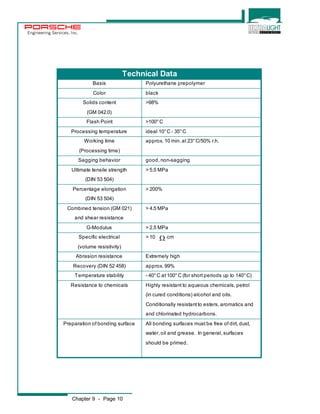
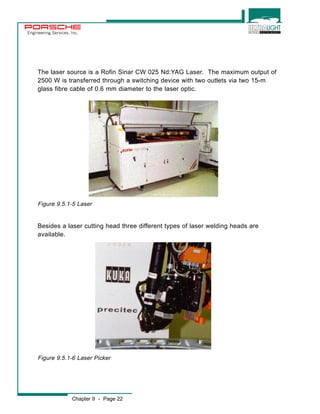
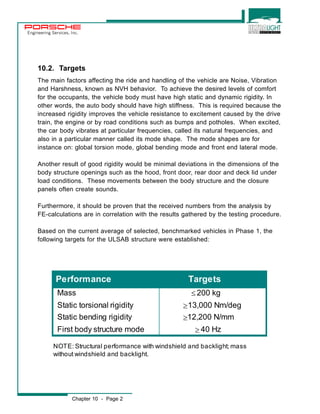
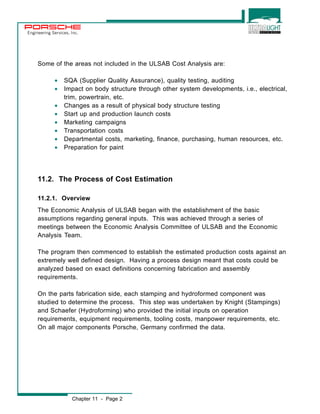
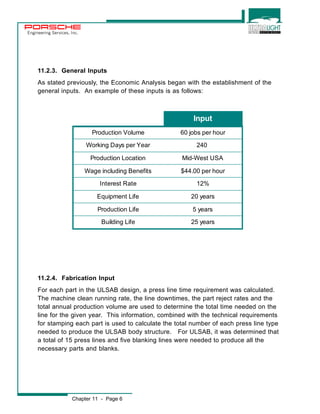
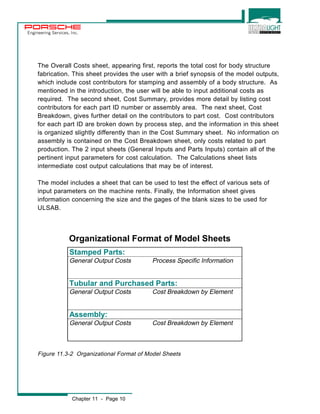
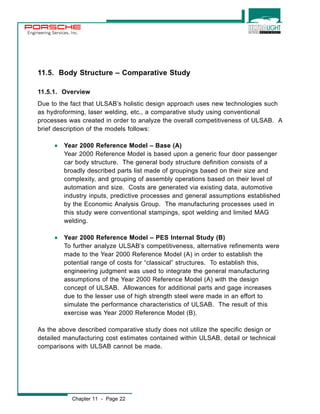
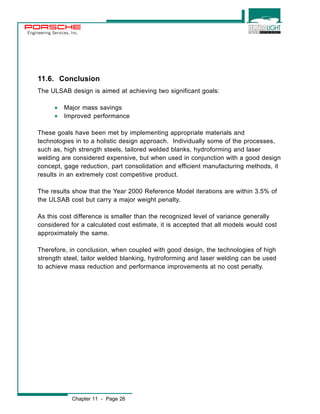
Reinforcements Manufactured and Welded to Structure
Part No Name Qty Mass [Kg]
038 Assy Reinf Floor Front Seat Rear Outer 2 0.120
110 Plate Rear Spring Upper 2 0.526
120 Reinf Floor Front Seat Rear Center 1 0.250
122 Reinf Rear Seat Inner Belt Mount 2 0.244
136 Reinf Panel Dash Upper 1 0.100
142 Assy Reinf Hinge Decklid 2 0.224
144 Reinf A-Pillar RH 1 0.229
145 Reinf A-Pillar LH 1 0.230
164 Assy Closeout Fender Support Rail RH 1 0.115
165 Assy Closeout Fender Support Rail LH 1 0.115
176 Hinge Base RH 4 0.650
177 Hinge Base LH 4 0.650
178 Hinge Stem 119 4 0.379
179 Hinge Stem 141 4 0.449
172 Assy Reinf Cowl Lower 1 0.127
190 Assy Reinf Seat Belt Retractor Rear 2 0.104
33 parts 4.512
Brackets Manufactured and Welded to Structure
Part No Name Qty Mass [Kg]
116 Assy Bracket Rear Shock Absorber Mount RH 1 0.335
117 Assy Bracket Rear Shock Absorber Mount LH 1 0.339
180 Bracket Trailing Arm Mount RH 1 0.333
181 Bracket Trailing Arm Mount LH 1 0.341
4 parts 1.348
Part No Name Qty Mass [Kg]
001 Assembly Reinf Radiator Support Upper 1 1.613
022 Panel Dash Insert 1 0.875
094 Reinf Radiator Rail Closeout RH 1 0.567
095 Reinf Radiator Rail Closeout LH 1 0.575
115 Reinf Panel Dash Brake Booster 1 0.464
188 Brace Radiator 2 0.250
7 parts 4.344
Chapter 5 - Page 13
Figure 5.3.3-2
Figure 5.3.3-3
Figure 5.3.3-4
Bolt-On Parts Manufactured and Attached to Structure](https://image.slidesharecdn.com/ulsabengrptcomplete-141013204259-conversion-gate01/85/Ulsab-engineer-report-complete-78-320.jpg)
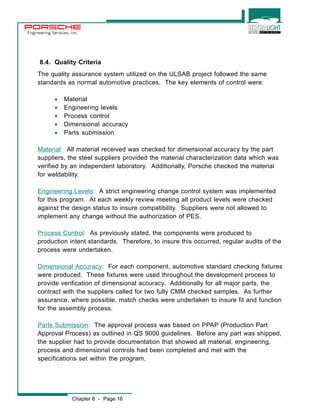
![Engineering Services, Inc.
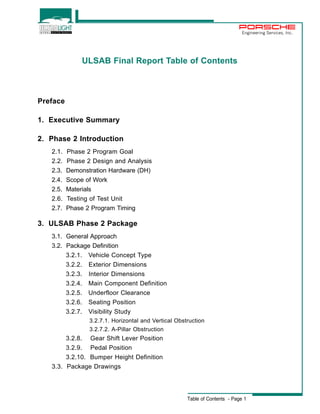
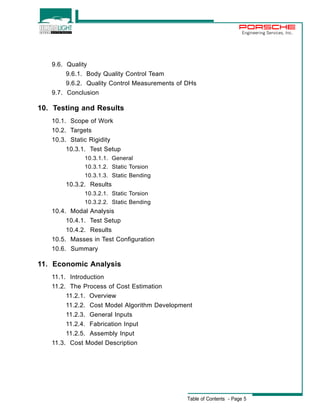
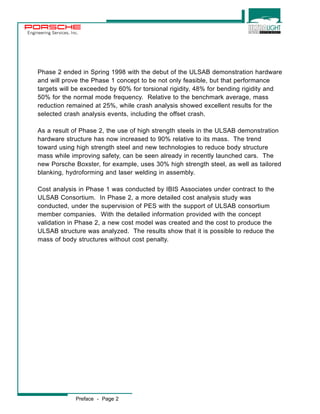
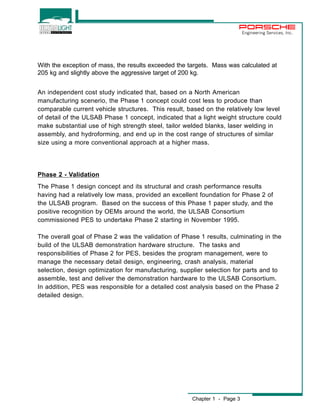
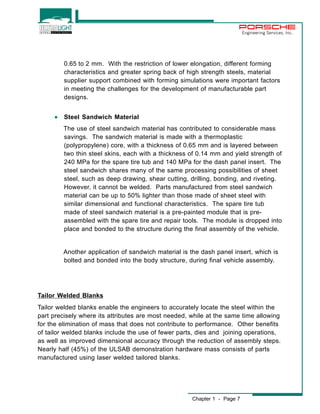
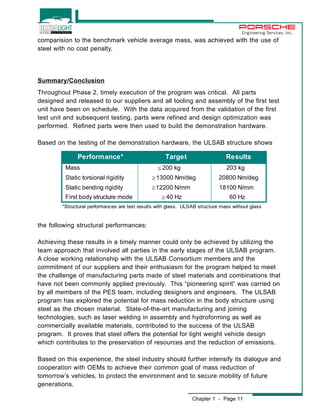
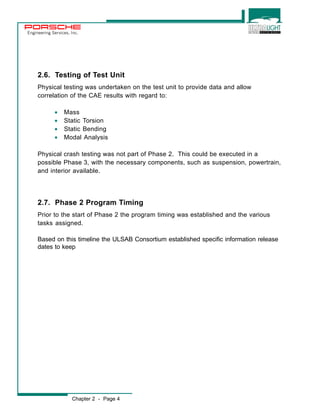
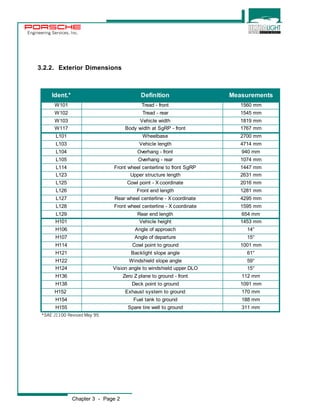
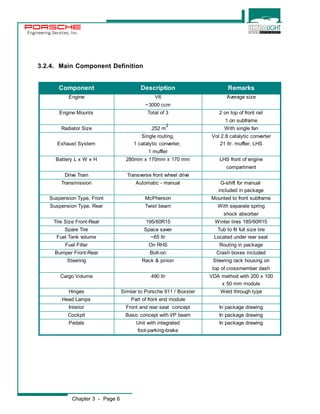
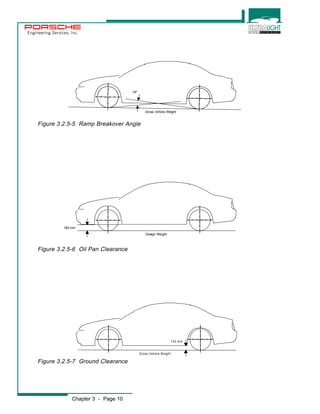
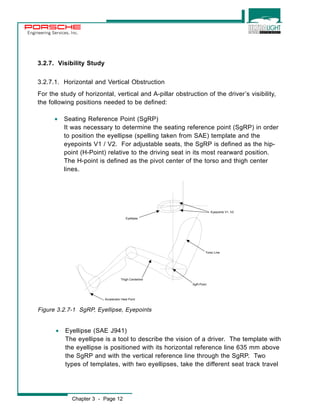
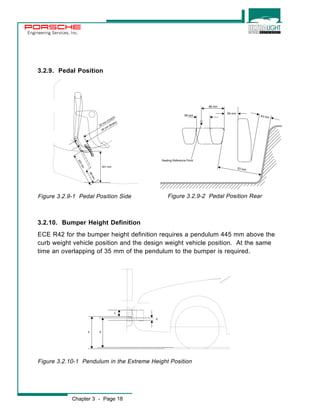
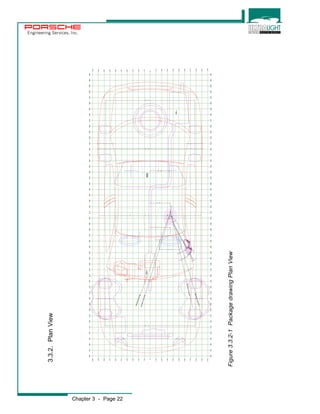
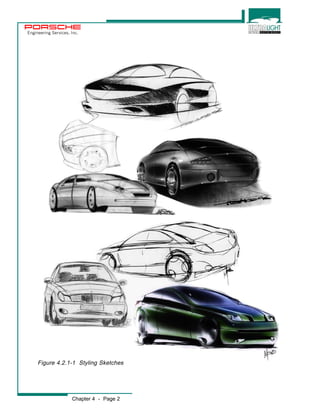
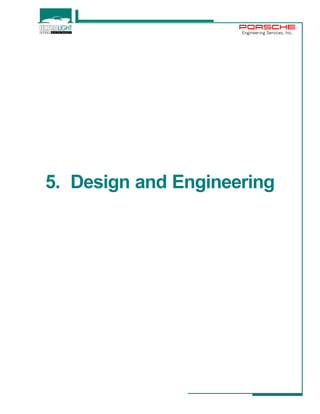
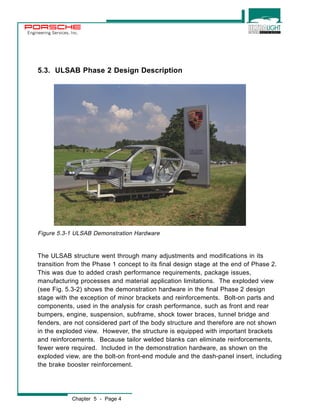
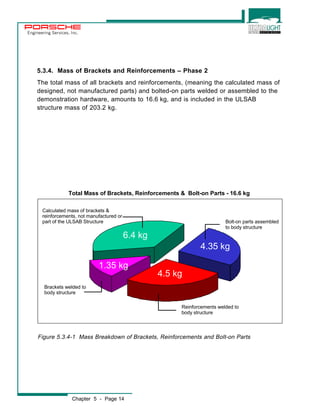
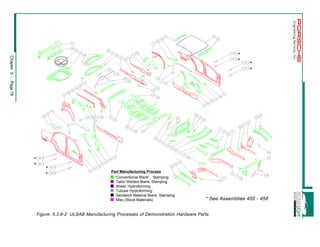
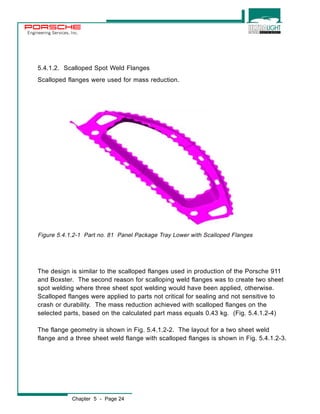
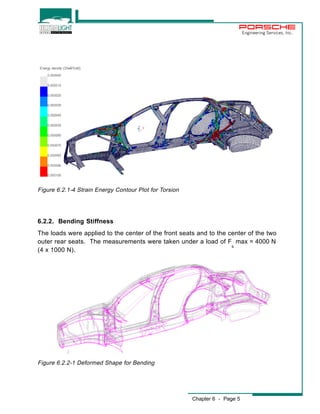
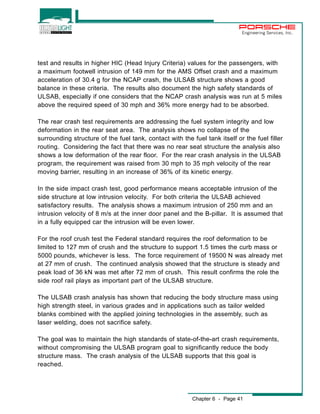
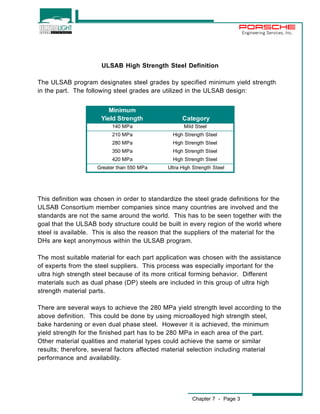
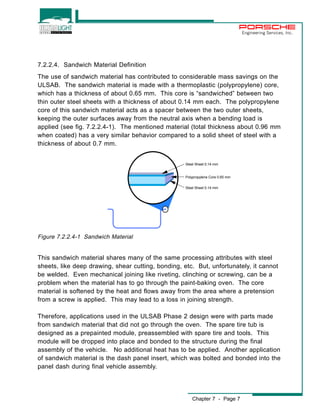
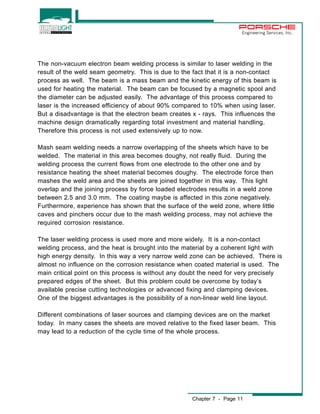
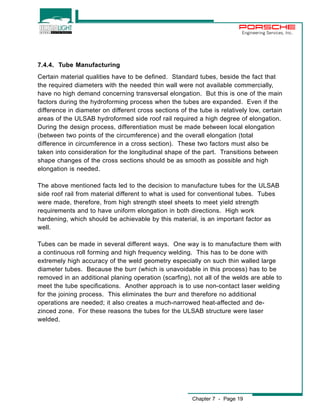
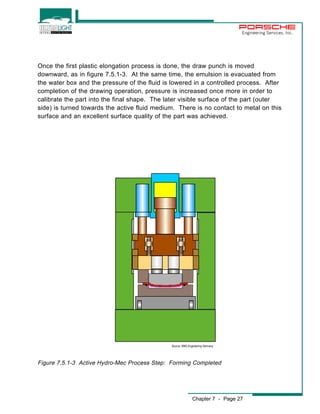
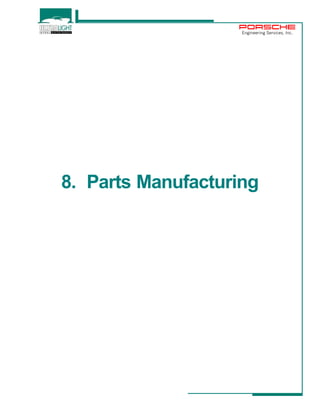
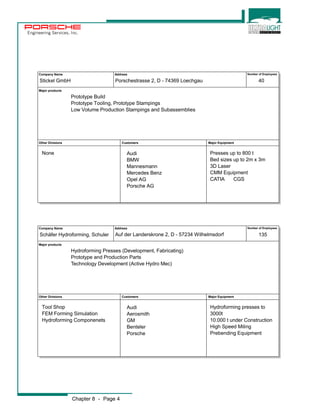
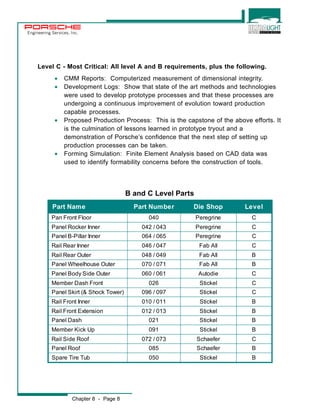
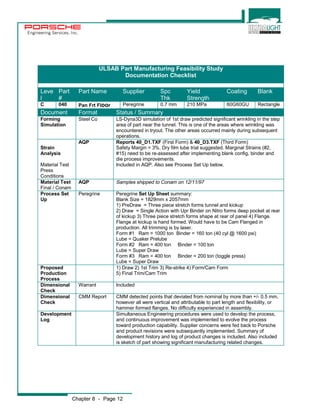
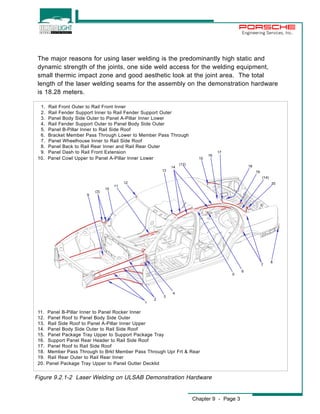
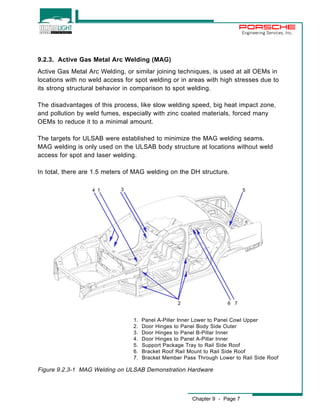
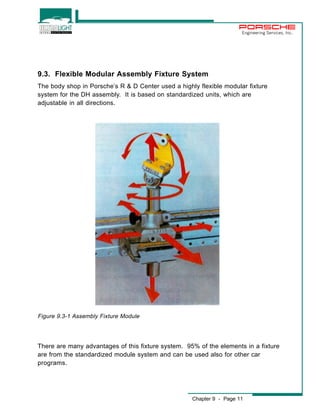
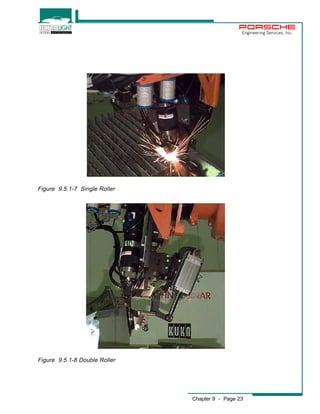
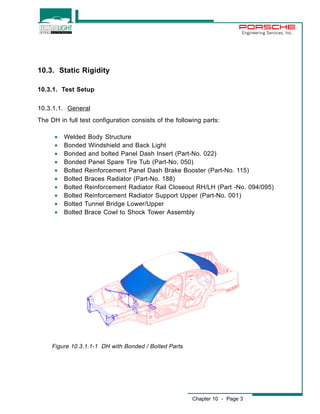
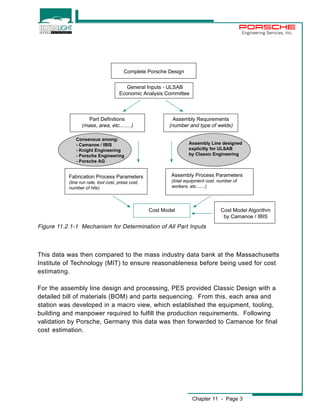
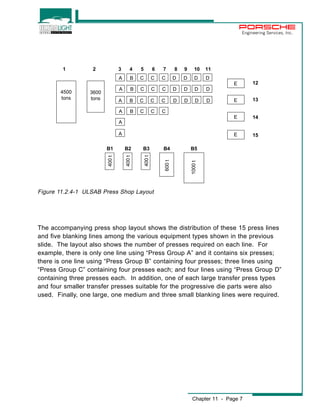
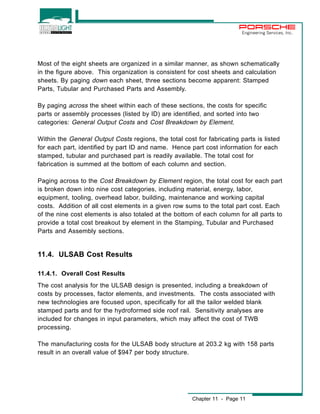
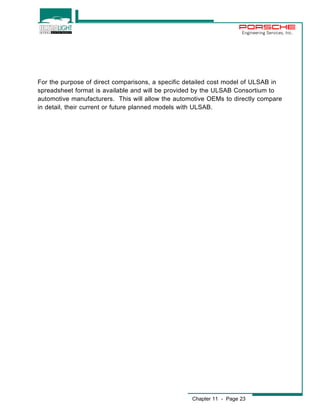
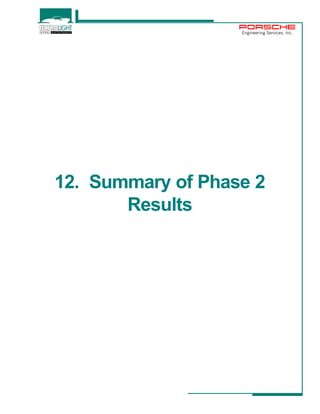
Figure. 5.4.1.2-4 Mass Reduction with Scalloped Flanges
Chapter 5 - Page 26
Part
Number
Part Name Calculated Part Mass
[kg]
Calculated Part Mass with
Scalloped Flange [kg]
Mass Reduction
[kg]
21 Panel Dash 6.180 6.140 0.040
28 Panel Cowl Lower 1.400 1.326 0.074
40 Pan Front Floor 15.934 15.892 0.042
45 Member Rear Suspension 1.486 1.440 0.046
55 Member Panel Back 1.450 1.424 0.026
68 Panel Wheelhouse Inner RH 2.141 2.110 0.031
69 Panel Wheelhouse Inner LH 2.141 2.110 0.031
81 Panel Package Tray Lower 1.700 1.594 0.106
140 Pan Rear Floor 4.330 4.298 0.032
0.428
5.4.1.3. Locator, Tooling and Electrophoresis Holes
Included in the detail part design are all locator holes for the assembly. All locator
holes needed for parts manufacturing and the holes necessary for the
electrophoresis of the body structure. After the location of the holes for
electrophoreses were first determined, they were then incorporated into the crash
models and the crash analysis was performed to verify that their position did not
have any negative influence on the crash performance. After this verification, the
holes were incorporated into the parts design.](https://image.slidesharecdn.com/ulsabengrptcomplete-141013204259-conversion-gate01/85/Ulsab-engineer-report-complete-91-320.jpg)


![Engineering Services, Inc.
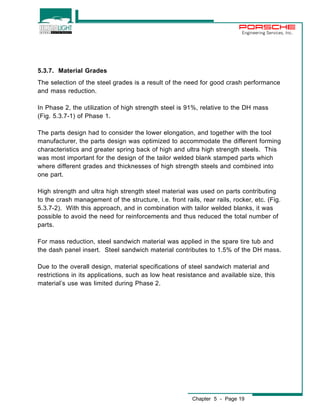
0.08
0.07
0.06
0.05
0.04
0.03
0.02
0.01
0
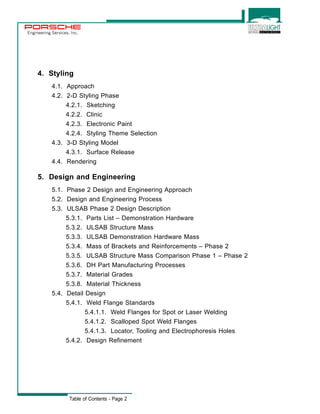
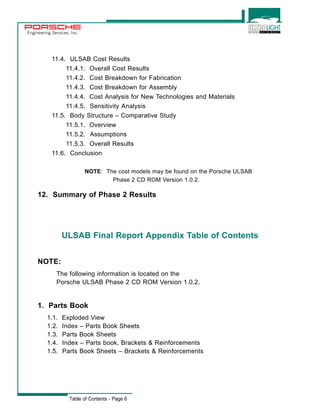
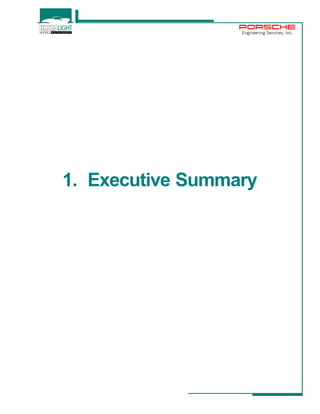
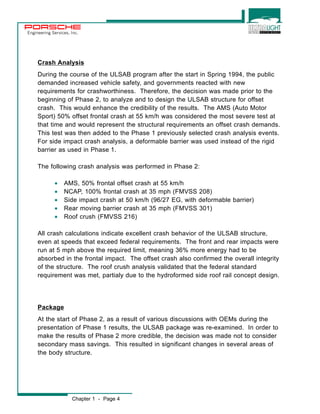
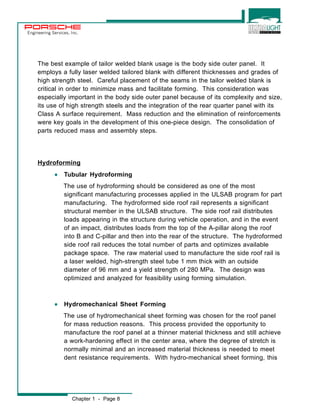
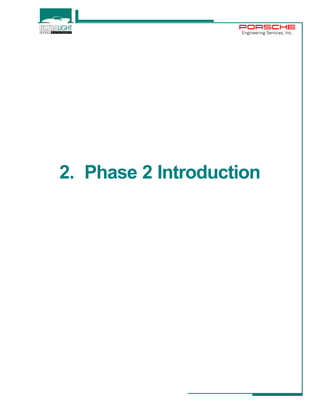
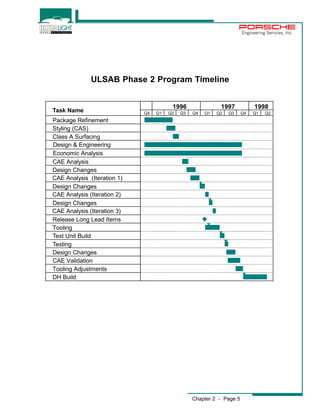
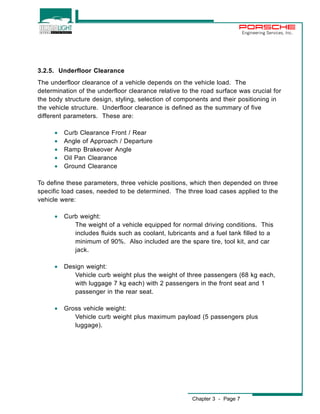
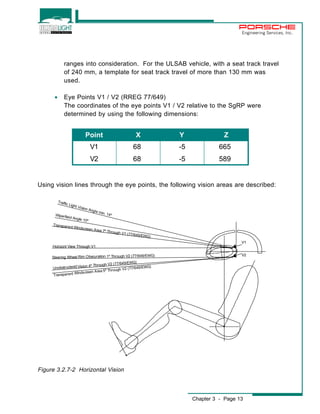
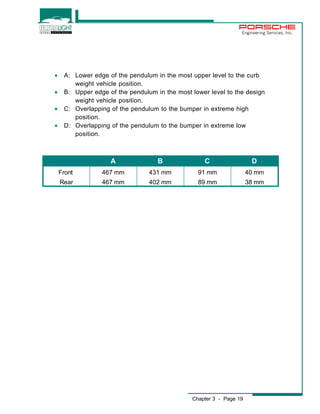
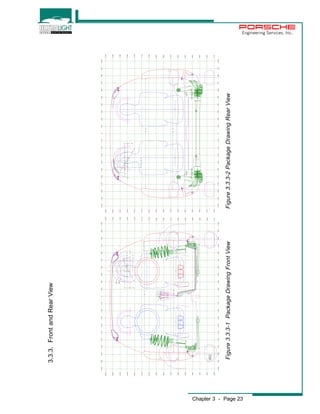
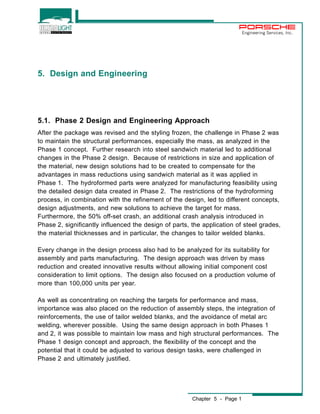
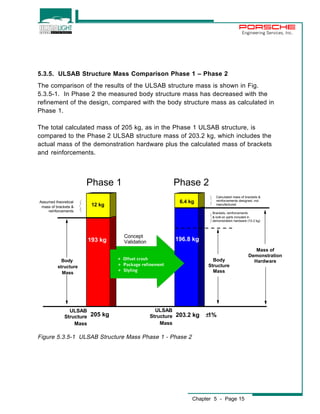
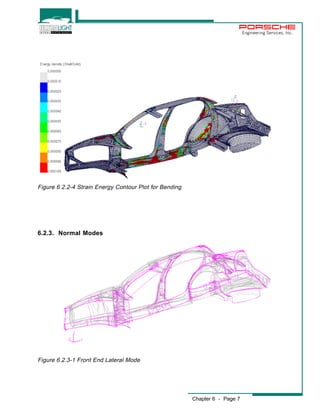
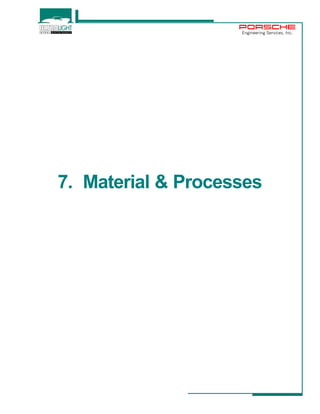
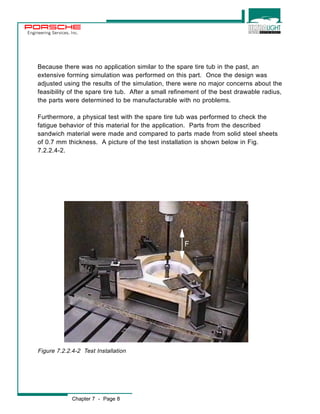
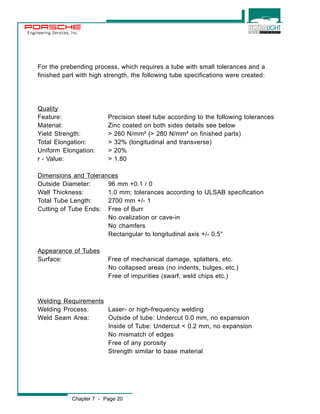
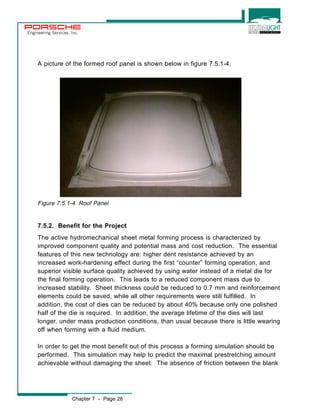
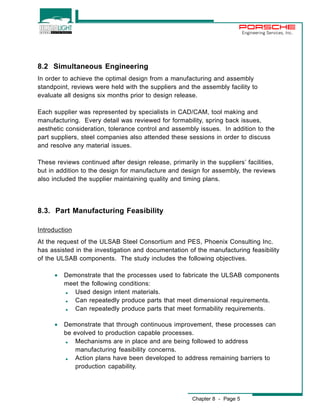
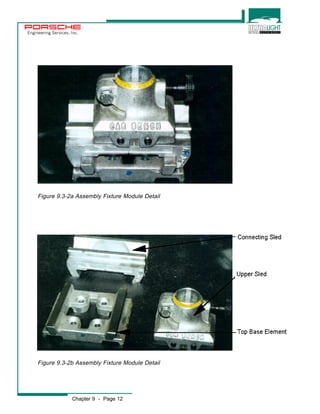
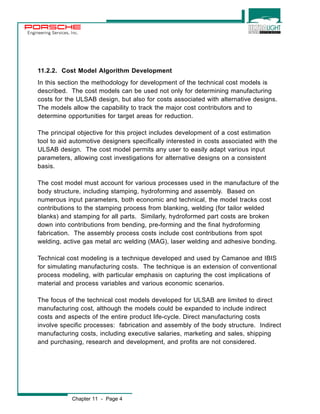
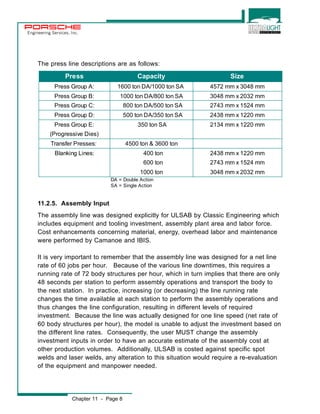
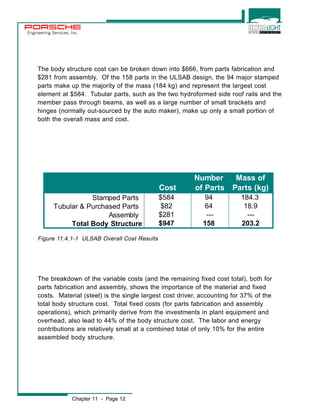
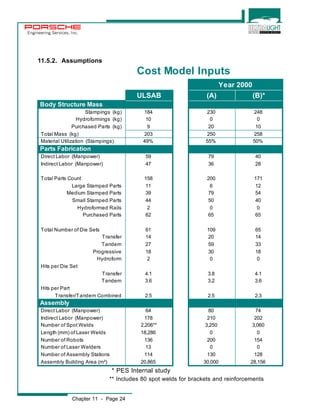
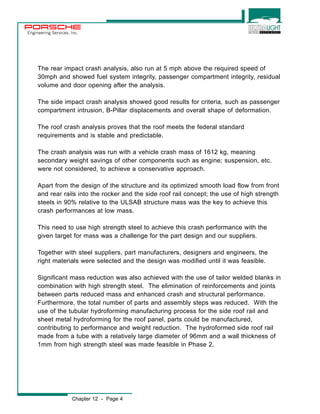
21310 Nm/deg
500 1000 1500 2000 2500 3000 3500 4000 4500 5000 5500
0.03
0.02
0.01
0
-0.01
-0.02
-0.03
-0.04
500 1000 1500 2000 2500 3000 3500 4000 4500 5000 5500
Chapter 6 - Page 4
-0.05
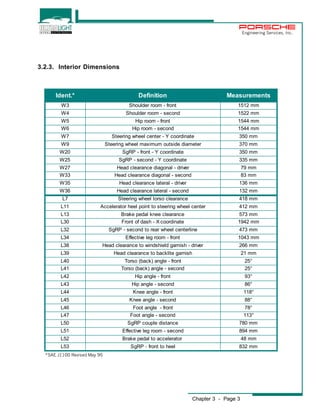
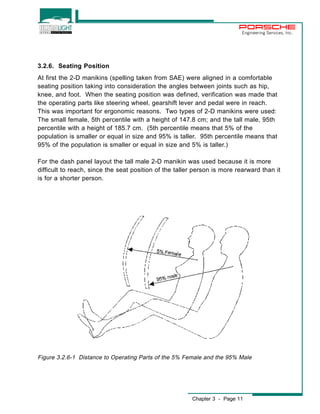
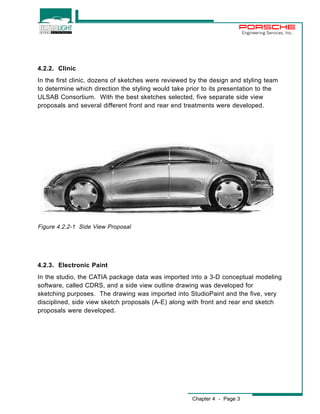
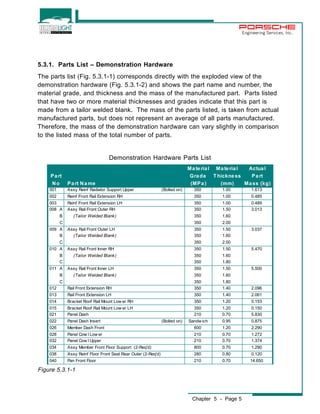
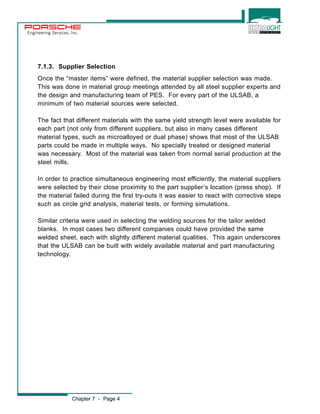
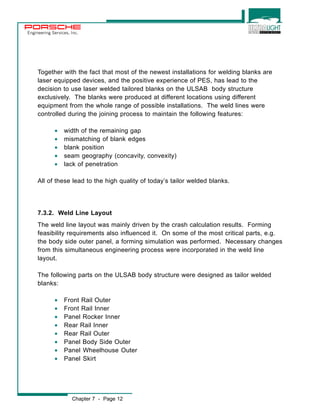
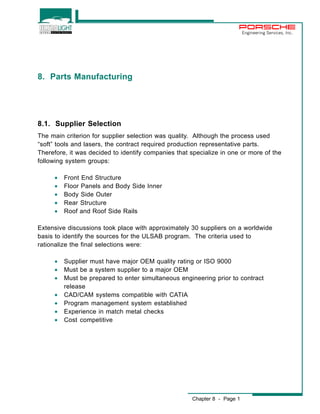
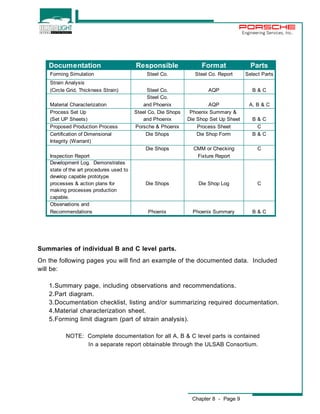
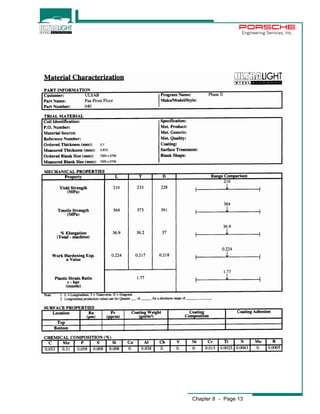
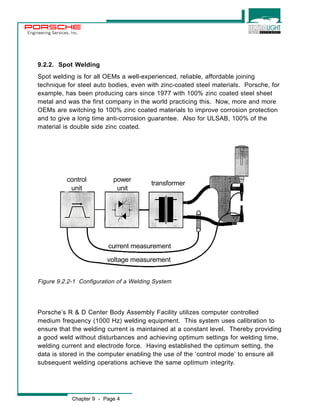
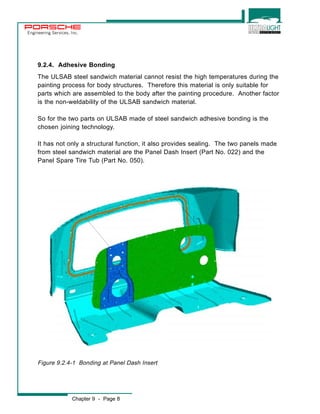
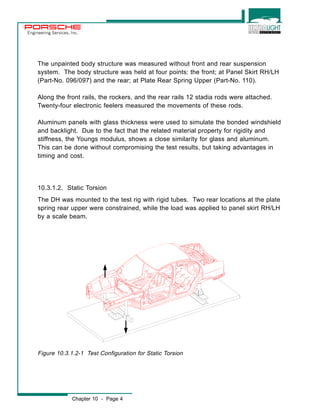
Longitudinal X-axis [mm]
Derivation of Angle [deg/mm]
Support
Derivation of Torsion Angle
Shock Tower
Front
Center, Spring
Attachment Rear
-0.01
Longitudinal X-axis [mm]
Angle = atan (zdisp/ycoor) [deg]
Support
Torsion Angle
Shock Tower
Front
Center, Spring
Attachment Rear
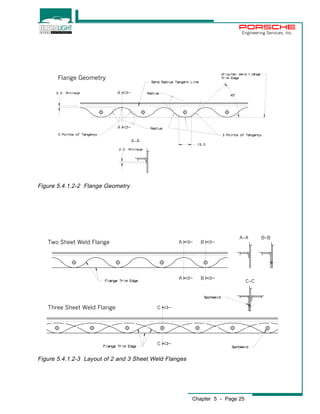
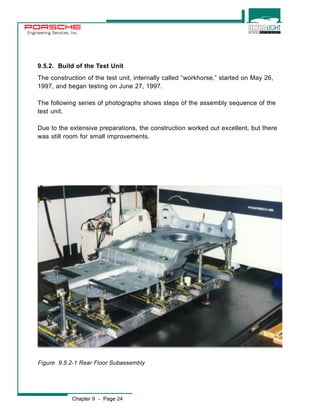
Figure 6.2.1-2 Torsion Angle vs. x-Axis
Figure 6.2.1-3 Derivation of Torsion Angle vs. x-Axis](https://image.slidesharecdn.com/ulsabengrptcomplete-141013204259-conversion-gate01/85/Ulsab-engineer-report-complete-98-320.jpg)
![Engineering Services, Inc.
0.25
0.2
0.15
0.1
0.05
0
-0.05
-0.1
-0.15
-0.2
0.4
0.3
0.2
0.1
0
-0.1
-0.2
-0.3
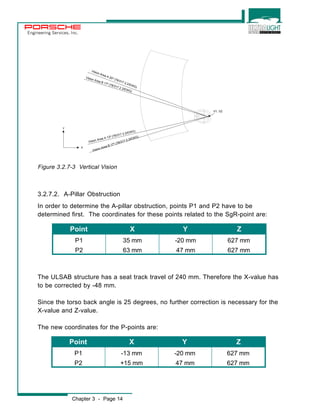
20540 N/mm
500 1000 1500 2000 2500 3000 3500 4000 4500 5000 5500
Longitudinal X-Axis [mm]
500 1000 1500 2000 2500 3000 3500 4000 4500 5000 5500
Chapter 6 - Page 6
-0.4
Longitudinal X-Axis [mm]
Vertical Z-Displacement [mm]
Derivation of vertical Z-Displacement [mm]
Support
Derivation of Vertical Z-Displacement
Shock Tower
Front
Center, Spring
Attachment Rear
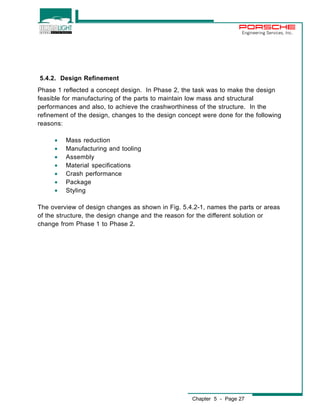
Figure 6.2.2-2 z-Displacement vs. x-Axis, Bending
Figure 6.2.2-3 Derivation of z-Displacement vs. x-Axis, Bending
Support
Vertical Z-Displacement
Shock Tower
Front
Center, Spring
Attachment Rear](https://image.slidesharecdn.com/ulsabengrptcomplete-141013204259-conversion-gate01/85/Ulsab-engineer-report-complete-100-320.jpg)
![Engineering Services, Inc.
Subframe
Front Rail Ext.
Rocker
Rail Front
Fender S. Rail
55
50
85
115
50
0 20 40 60 80 100 120 140
Force (kN)
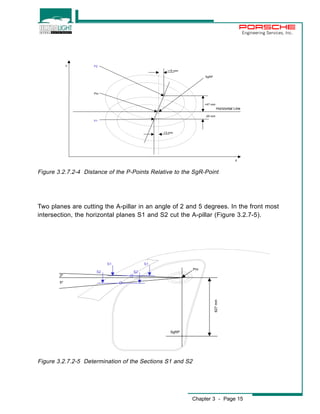
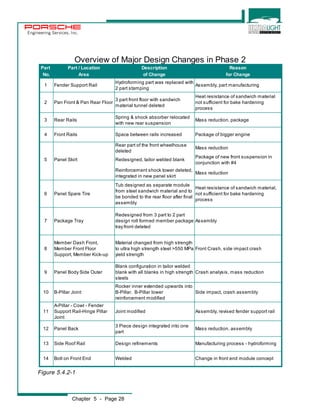
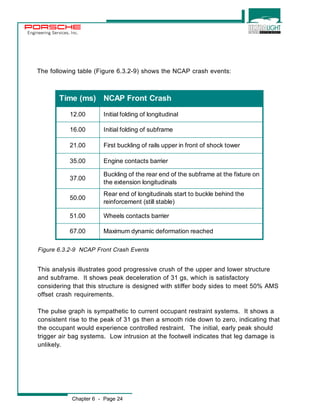
Figure 6.3.1-6 AMS Offset Crash Typical Cross Section Forces
Average Car Acceleration vs. Time
Rocker LHS / Tunnel / Rocker RHS
0 20 40 60 80 100
Chapter 6 - Page 15
-40
-30
-20
10
-0
+-10
10
time [ms]
ax [g]
Figure 6.3.1-7 AMS Offset Crash Acceleration vs. Time](https://image.slidesharecdn.com/ulsabengrptcomplete-141013204259-conversion-gate01/85/Ulsab-engineer-report-complete-109-320.jpg)
![Engineering Services, Inc.
0 20 40 60 80 100
800
600
400
200
0
-200
Figure 6.3.1-8 AMS Offset Crash Deformation vs. Time
Chapter 6 - Page 16
time [ms]
sx [mm]
Car Deformation vs. Time](https://image.slidesharecdn.com/ulsabengrptcomplete-141013204259-conversion-gate01/85/Ulsab-engineer-report-complete-110-320.jpg)
![Engineering Services, Inc.
Average Car Acceleration vs. Time
Rocker LHS / Tunnel / Rocker RHS
0 20 40 60 80 100
time [ms]
Car Deformation vs. Time
0 20 40 60 80 100
Chapter 6 - Page 23
40
-40
30
-30
20
-20
-10
10
0
0
+10
-10
ax [g]
Figure 6.3.2-7 NCAP 100% Crash Acceleration vs. Time
800
600
400
200
0
time [ms]
sx [mm]
Figure 6.3.2-8 NCAP 100% Crash Deformation vs. Time](https://image.slidesharecdn.com/ulsabengrptcomplete-141013204259-conversion-gate01/85/Ulsab-engineer-report-complete-117-320.jpg)
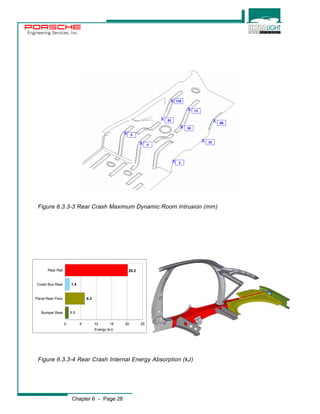
![Engineering Services, Inc.
Rocker
Rear Rail
Rail Side Roof
Spare Wheel
50
80
15
20
0 10 20 30 40 50 60 70 80 90
Force (kN)
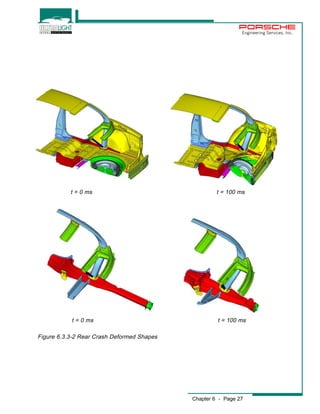
Figure 6.3.3-5 Rear Crash Typical Cross Section Forces (kN)
Average Car Acceleration vs. Time
0 20 40 60 80 100
Chapter 6 - Page 29
40
30
20
10
0
-10
time [ms]
ax [g]
Figure 6.3.3-6 Rear Crash Acceleration vs. Time](https://image.slidesharecdn.com/ulsabengrptcomplete-141013204259-conversion-gate01/85/Ulsab-engineer-report-complete-123-320.jpg)
![Engineering Services, Inc.
0 20 40 60 80 100
800
600
400
200
0
Chapter 6 - Page 30
time [ms]
sx [mm]
Car Deformation vs. Time
Figure 6.3.3-7 Rear Crash Deformation vs. Time](https://image.slidesharecdn.com/ulsabengrptcomplete-141013204259-conversion-gate01/85/Ulsab-engineer-report-complete-124-320.jpg)
![Engineering Services, Inc.
0 50 100 150 200 250 300
0 50 100 150 200 250 300
10
9
8
7
6
5
4
3
2
1
0
-1
10
9
8
7
6
5
4
3
2
1
0
-1
-2
Chapter 6 - Page 36
Y - Intrusion [mm]
Y - Velocity [m/s]
Velocity vs. Intrusion
B-Pillar No 238
-2
Y - Intrusion [mm]
Y - Velocity [m/s]
Velocity vs. Intrusion
Door Inner Panel No 353
Figure 6.3.4-5 Side Impact Velocity vs. Intrusion at Node 353
Figure 6.3.4-6 Side Impact Velocity vs. Intrusion at Node 238](https://image.slidesharecdn.com/ulsabengrptcomplete-141013204259-conversion-gate01/85/Ulsab-engineer-report-complete-130-320.jpg)
![Engineering Services, Inc.
0 25 50 75 100 125 150
40
35
30
25
20
15
10
5
0
-5
Figure 6.3.5-3 Roof Crush Deformation vs. Force
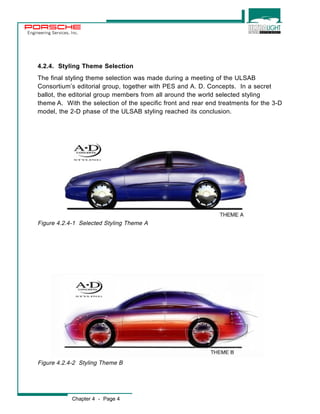
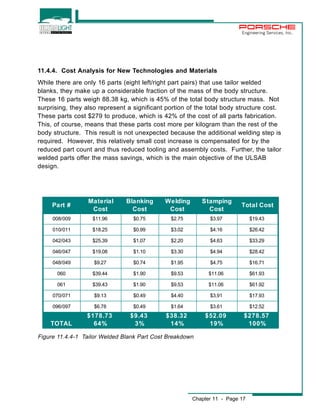
Analysis showed that 22.25 kN was reached within 30 mm of crush. The structure
resisted the applied load all the way up its peak of 36.15 kN and continued to
maintain it quite well even after peak, when it dropped to about 28 kN at 127 mm.
The load was well distributed through the A, B and C-pillars and down into the rear
rail.
6.4. CAE Analysis Summary
For the AMS Offset crash test the overall deformation and intrusion are the critical
figures. For the NCAP crash test, the critical figure is the vehicle crash pulse. The
target for the offset crash was to achieve low footwell intrusion. It is important to
achieve a good balance between these two targets. The results of the crash
analysis show that for the ULSAB a good compromise has been found to fulfill the
AMS as well as the NCAP frontal crash, considering the dependencies between
these two crash types.
To achieve the low footwell intrusion for the AMS crash a rigid front structure is
needed. A rigid front structure, however, means higher acceleration in the NCAP
Chapter 6 - Page 40
Deformation [mm]
Force [N]
Force vs. Deformation
127](https://image.slidesharecdn.com/ulsabengrptcomplete-141013204259-conversion-gate01/85/Ulsab-engineer-report-complete-134-320.jpg)

![Engineering Services, Inc.
Test Unit Displacement Torsion
4000 Nm
3000 Nm
2000 Nm
1000 Nm
Front Axle Rear Axle
500 1000 1500 2000 2500 3000 3500 4000 4500 5000
Longitudinal Axis X [mm]
20
15
10
5
0
-5
Angle of Twist [min]
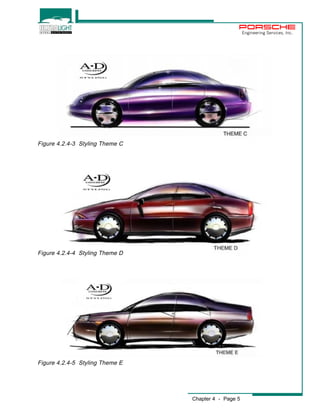
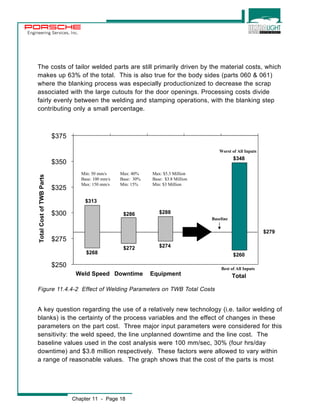
In general, the graph plot is running harmonic. There is only a jump in rigidity
between x = 3800 to x = 4200. This is related to the positive impact of the Member
Pass Through (Part-No. 090) to the torsional stiffness.
0.4
0.3
0.2
0.1
0
-0.1
-0.2
Front Axle Rear Axle
500 1000 1500 2000 2500 3000 3500 4000 4500 5000
Chapter 10 - Page 7
Figure 10.3.2.1-2 Torsion Lines 4 Load Cases with Glass
Test Unit Gradient Torsion
Longitudinal Axis X [mm]
Gradient [°/m
Figure 10.3.2.1-3 Gradient of Torsion Line with Glass
The above graph shows the gradient of the torsion line. The disharmonies of the
torsion line can be seen in a higher resolution.](https://image.slidesharecdn.com/ulsabengrptcomplete-141013204259-conversion-gate01/85/Ulsab-engineer-report-complete-224-320.jpg)
![Engineering Services, Inc.
The torsional rigidity for DH #2 in the configuration described in section 10.3.1.1 is:
With glass 20,800 Nm/deg
Without glass 15,830 Nm/deg
20
15
10
5
0
Figure 10.3.2.1-4 Torsion Lines 4 Load Cases with Glass
As expected, the results are very close to the test unit.
This assumption is based on the test results without glass, because these are
nearly identical (15,790 Nm/deg vs. 15,830 Nm/deg).
Chapter 10 - Page 8
DH #2 Displacement Torsion
500 1000 1500 2000 2500 3000 3500 4000 4500 5000
Longitudinal Axis X [mm]
-5
Angle of Twist [min]
4000 Nm
3000 Nm
2000 Nm
1000 Nm
Front Axle Rear Axle](https://image.slidesharecdn.com/ulsabengrptcomplete-141013204259-conversion-gate01/85/Ulsab-engineer-report-complete-225-320.jpg)
![Engineering Services, Inc.
DH #2 Gradient Torsion
0.4
0.3
0.2
0.1
0
-0.1
-0.2
Front Axle Rear Axle
500 1000 1500 2000 2500 3000 3500 4000 4500 5000
Longitudinal Axis X [mm]
Gradient [°/m]
The above graph shows the gradient of the torsion line. The disharmonies of the
torsion line can be seen in a higher resolution.
Chapter 10 - Page 9
Figure 10.3.2.1-5 Gradient of Torsion Line with Glass](https://image.slidesharecdn.com/ulsabengrptcomplete-141013204259-conversion-gate01/85/Ulsab-engineer-report-complete-226-320.jpg)
![Engineering Services, Inc.
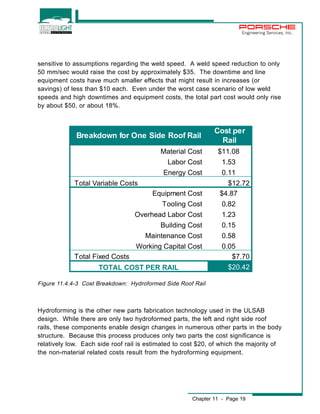
To investigate the impact of several bonded and/or bolted parts, additional
measurements in various test configurations were undertaken with the test unit.
Test Configurations:
1. Full configuration as described in Section 10.3.1.1
2. As 1, but without braces radiator (Part-No. 188)
3. As 2, but without radiator support upper (Part-No. 001/094/095)
4. As 3, but without bolted brace cowl to shock tower assembly
5. As 4, but without tunnel bridge
110
100
90
80
100.0
Torsion Rigidity
As the numbers show, only the bolted brace cowl to shock tower assembly has a
significant impact on the torsional rigidity of 6.3%.
Chapter 10 - Page 10
98.3 98.3
92.0 92.0
Test Configuration
Torsion Rigidity [%]
1 2 3 4 5
Figure 10.3.2.1-6 Torsion Rigidity Five Test Configurations](https://image.slidesharecdn.com/ulsabengrptcomplete-141013204259-conversion-gate01/85/Ulsab-engineer-report-complete-227-320.jpg)
![Engineering Services, Inc.
Test Unit Displacement Bending
500 1000 1500 2000 2500 3000 3500 4000 4500 5000
Longitudinal Axis X [mm]
0.5
0.4
0.3
0.2
0.1
0
-0.1
-0.2
-0.3
-0.4
Figure 10.3.2.2-2 Bending Lines 4 Load Cases with Glass
The graph is running harmonic. There is only a local increase in bending rigidity
between x = 3500 and x = 4200. This indicates a stiff joint between rocker and rear
rails. Furthermore, Porsche relates this to the design of the side roof rail.
Test Unit Average Deviation Bending
500 1000 1500 2000 2500 3000 3500 4000 4500 5000
50
40
30
20
10
0
-10
-20
Figure 10.3.2.2-3 Deviation from the Average Bending Line with Glass
The above graph shows the deviation from the average value of the bending line.
The disharmonies can be seen in a better resolution.
Chapter 10 - Page 12
Longitudinal Axis X [mm]
-30
Deviation from the average [%]
Front Axle Rear Axle
-0.5
Vertical Displacement [mm]
4000 N
3000 N
2000 N
1000 N
Front Axle Rear Axle](https://image.slidesharecdn.com/ulsabengrptcomplete-141013204259-conversion-gate01/85/Ulsab-engineer-report-complete-229-320.jpg)
![Engineering Services, Inc.
The bending rigidity for DH #2 in the configuration described in Section 10.3.1.1 is:
With glass 18,100 N/mm
Without glass 15,950 N/mm
500 1000 1500 2000 2500 3000 3500 4000 4500 5000
0.5
0.4
0.3
0.2
0.1
0
-0.1
-0.2
-0.3
-0.4
Figure 10.3.2.2-4 Bending Lines 4 Load Cases with Glass
The bending lines show the same characteristics as for the test unit, but the
absolute value decreased by 11%. The local increase between x=3500 and x=4200
is not so evident as it was on the test unit. This could be created by local
modifications of the side roof rail and the rear rails for improved manufacturing.
Furthermore, the material gage of the panel roof changed from 0.77mm to 0.70mm
due to material availability problems for the test unit; this was also a factor for the
decrease of the absolute value.
Additionally Porsche has experienced that static rigidities of body structures differ
by plus/minus five percent (5%) even under series production conditions.
Chapter 10 - Page 13
Longitudinal Axis X [mm]
-0.5
Vertical Displacement [mm]
4000 N
3000 N
2000 N
1000 N
Rear Axle
DH #2 Displacement Bending
Front Axle](https://image.slidesharecdn.com/ulsabengrptcomplete-141013204259-conversion-gate01/85/Ulsab-engineer-report-complete-230-320.jpg)
![Engineering Services, Inc.
500 1000 1500 2000 2500 3000 3500 4000 4500 5000
50
40
30
20
10
0
-10
-20
-30
-40
Figure 10.3.2.2-5 Deviation from the Average Bending Line with Glass
The above graph shows the deviation from the average value of the bending line.
The disharmonies can be seen in a better resolution.
Chapter 10 - Page 14
Longitudinal Axis X [mm]
-50
Deviation from the average [%]
DH #2 Average Deviation Bending
Front Axle Rear Axle](https://image.slidesharecdn.com/ulsabengrptcomplete-141013204259-conversion-gate01/85/Ulsab-engineer-report-complete-231-320.jpg)
![Engineering Services, Inc.
To investigate the impact of several bonded and/or bolted parts, additional
measurements were undertaken:
Bending Rigidity
Figure 10.3.2.2-6 Bending Rigidity Five Test Configurations
Chapter 10 - Page 15
110
100
90
80
100.0 100.0 99.0 98.8 100.0
Test Configuration
Bending Rigidity [%]
1 2 3 4 5
Test Configurations:
1. Full configuration as described in Chapter 10.3.1.1
2. As 1, but without braces radiator (Part-No. 188)
3. As 2, but without radiator support upper (Part-No. 001/094/095)
4. As 3, but without bolted brace cowl to shock tower assembly
5. As 4, but without tunnel bridge
As the numbers show, none of these parts display a significant impact on bending
rigidity.
The increase from test configuration four (4) to test configuration five (5) is caused
by local effects of the tunnel bridge to the displacement of the rocker. This behavior
was also noticed in other body structures.](https://image.slidesharecdn.com/ulsabengrptcomplete-141013204259-conversion-gate01/85/Ulsab-engineer-report-complete-232-320.jpg)
![Engineering Services, Inc.
The global modes of the test unit in the described test configuration can be seen in
the following chart:
70
60
50
40
49.1
Test Unit Modal Analysis
60.8
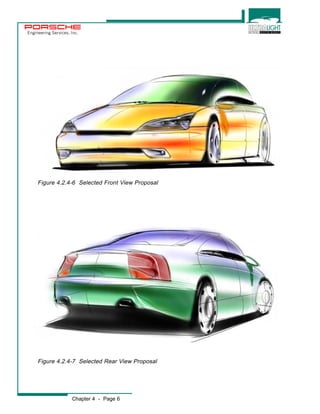
The dynamic rigidity of the ULSAB structure is remarkably good, as it was already
indicated by the static test results. Windshield and backlight have a significant
impact on the first torsion mode. The difference is in the same range, as known
from other sedan body structures.
The effect on first bending and first front-end lateral mode is relatively small. For
the test configuration with glass, the first torsion mode and the first front-end lateral
mode are coupled at 60.6 Hz.
Chapter 10 - Page 19
Figure 10.4.2-2 Modal Analysis Results - Test Unit
64.3
60.6
62.4
60.6
First Modes [Hz]
Torsion Bending Front End Lateral
without glass with glass](https://image.slidesharecdn.com/ulsabengrptcomplete-141013204259-conversion-gate01/85/Ulsab-engineer-report-complete-236-320.jpg)
![Engineering Services, Inc.
Test Unit Modal Analysis with Screens
Frequency Response Function Amplitude [(m/s2)/N]
First Bending 62.4 Hz
Corner Points
50 52 54 56 58 60 62 64 66 68 70
1.8
1.6
1.4
1.2
1
0.8
0.6
0.4
0.2
Figure 10.4.2-3 Frequency Response Functions - Test Unit
The graph plot above shows the frequency response functions, measured at the
four driving points. Second bending mode at 63.5 Hz occurs mainly in the rear;
whereas the first bending mode occurs in the front and rear of the structure.
Chapter 10 - Page 20
2
Test Unit Modal Analysis with Screens
Frequency Response Functions, measured at the body corner points
Power input by means of electrodynamic shakers at the body corner points
Frequency [Hz]
0
First Torsion 60.6 Hz Bending 63.5 Hz
Front Left
Front Right
Rear Left
Rear Right](https://image.slidesharecdn.com/ulsabengrptcomplete-141013204259-conversion-gate01/85/Ulsab-engineer-report-complete-237-320.jpg)
![Engineering Services, Inc.
The global modes for DH #2 in the described test configuration can be seen in the
following chart:
70
60
50
40
47
DH #2 Modal Analysis
57.2
The dynamic rigidity of DH #2 is in the same range as the values of the test unit.
The front-end lateral mode changed remarkably. This is created by the change of
the material gauge of the rail fender support inner from 0.9mm to 1.2mm.
The torsion mode and bending mode without glass decreased slightly, but with
glass, the loss of dynamic rigidity is compensated.
Chapter 10 - Page 21
Figure 10.4.2-4 Modal Analysis Results - DH #2
66.5
60.1
63.9 64.9
First Modes [Hz]
Torsion Bending Front End Lateral
w ithout glass w ith glass](https://image.slidesharecdn.com/ulsabengrptcomplete-141013204259-conversion-gate01/85/Ulsab-engineer-report-complete-238-320.jpg)
![Engineering Services, Inc.
DH #2 Modal Analysis with Screens
Frequency Response Functions, measured at the body corner points
Power input by means of electrodynamic shakers at the body center points
4
3.8
3.6
3.4
3.2
3
2.8
2.6
2.4
2.2
2
1.8
1.6
1.4
1.2
1
0.8
0.6
0.4
0.2
0
Figure 10.4.2-5 Frequency Response Functions - DH #2
Measurement Points:
Body Corner Points
Driving Points:
Body Corner Points
ulsabdh2
ULSAB_DH2_mS
The graph plot above shows the frequency response function, measured at the four
driving points. The amplitude of the first bending increased in relation to the test
unit. This is in correlation with the decrease of the static bending rigidity.
Additional modal analysis was conducted on the ULSAB structure, to investigate the
influence of several bolted and/or bonded parts.
Test configurations:
1. Full test configuration as described in chapter 10.3.1.1.
2. As 1, but without bolted brace cowl to shock tower assembly
3. As 2, but without braces radiator (Part-No.188)
4. As 3, but without tunnel bridge
5. As 4, but without radiator support upper (Part-No. 001/094/095)
Chapter 10 - Page 22
Front Left
Front Right
Rear Left
Rear Right
50 52 54 56 58 60 62 64 66 68 70
18-12-97
ULSAB DH2
Body Structure
with Screens
Project:
Test:
Date:
Vehicle:
Frequency Hz
Frequency Response Function Amplitude [(m/s2)/N]
First Bending 63.9 Hz
First Torsion 60.1 Hz](https://image.slidesharecdn.com/ulsabengrptcomplete-141013204259-conversion-gate01/85/Ulsab-engineer-report-complete-239-320.jpg)
![Engineering Services, Inc.
Modal Analysis
62.4 62.4 62.4 62.3 62.3
60.6 61.0 61.0 60.8 60.3
Chapter 10 - Page 23
70
60
50
40
60.6
47.0 47.3 47.2
53.4
Test Configuration
First Modes [Hz]
1 2 3 4 5
Front End Lateral Torsion Bending
Figure 10.4.2-6 Modal Analysis Five Test Configurations
The influence of the bolted brace cowl to shock tower assembly on the front-end
lateral mode of 13.6 Hz is evident.
Test configuration 5 shows an improvement in the front-end lateral mode, but this is
mainly caused by the influence of the mass of assembly radiator support.
The other modifications have no evident impact on dynamic rigidity.](https://image.slidesharecdn.com/ulsabengrptcomplete-141013204259-conversion-gate01/85/Ulsab-engineer-report-complete-240-320.jpg)

![Engineering Services, Inc.
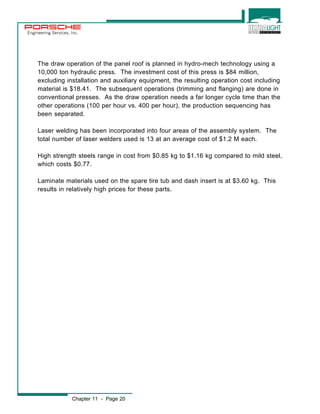
Phase 2 Benchmark Difference
Performance Results Average Difference (%)
Mass (kg) 203 271 - 68 - 25%
Static Torsional Rigidity (Nm/deg) 20800 11531 + 9269 + 80%
Static Bending Rigidity (N/mm) 18100 11902 +6198 + 52%
First Body Structure Mode (Hz) 60 38 + 22 + 58%
Chapter 12 - Page 1
12. Summary of Phase 2 Results
The Phase 2 of the ULSAB program has come to its conclusion with the build of the
demonstration hardware.
The test results of the demonstration hardware are remarkable.
Figure 12-1 Structural Performance Summary
Relative to the benchmark average vehicle mass of 271 kg, the mass reduction
achieved is 68 kg (25%).
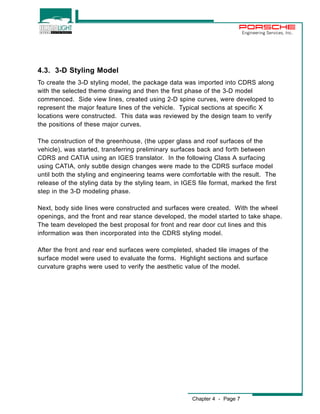
The static torsional rigidity exceeds the target. The efficiency (rigidity / mass) has
increased, in relation to Phase 1, to 102.5 [(Nm/deg)/kg] (Fig. 12-2). The Phase 2
structural performance results are shown in the graphs as a tolerance field rather
than a fixed point. To indicate that the mass and the performances can vary from
one demonstration hardware structures to another, as it would also do in real mass
production. The static bending rigidity as well as the first body structure mode have
also been increased in comparison to the Phase 1 results (Fig. 12-3 and 12-4).
These high levels of static and dynamic rigidity provide an excellent basis for a
complete vehicle development in respect to its NVH behavior.](https://image.slidesharecdn.com/ulsabengrptcomplete-141013204259-conversion-gate01/85/Ulsab-engineer-report-complete-271-320.jpg)
![Engineering Services, Inc.
Torsional Rigidity vs. Mass
110 100 90 80
180 200 220 240 260 280 300 320 340
24
22
20
18
16
14
12
10
8
6
4
Figure. 12-2 ULSAB Phase 2 Torsional Efficiency
Bending Rigidity vs. Mass
ULSAB
Phase II
70
60
50
40
30
ULSAB 40
Target
180 200 220 240 260 280 300 320 340
24
22
20
18
16
14
12
10
8
6
Chapter 12 - Page 2
70
60
50
Cb (x1000) [N/mm]
Cb/m
110 100 90 80
m [kg]
All data adjusted to target vehicle
Cb with Glass, m without Glass
Reference Vehicles: Acura Legend, BMW 5 series, Chevrolet Lumina, Ford Taurus, Honda Accord, Lexus LS 400,
Mazda 929, Mercedes Benz 190 E, Toyota Cressida
4
30
20
Future
Performance
Reference
Current
Average
ULSAB
Phase I
18.1
203
Figure. 12-3 ULSAB Phase 2 Bending Efficiency
20
Future
Performance
Reference
Current
Average
Cb (x1000) [Nm/deg]
Ct/m
m [kg]
All data adjusted to target vehicle
Cb with Glass, m without Glass
Reference Vehicles: Acura Legend, BMW 5 series, Chevrolet Lumina, Ford Taurus, Honda Accord, Lexus LS 400,
Mazda 929, Mercedes Benz 190 E, Toyota Cressida
ULSAB
Target
ULSAB
20.8 Phase I
203
ULSAB
Phase II](https://image.slidesharecdn.com/ulsabengrptcomplete-141013204259-conversion-gate01/85/Ulsab-engineer-report-complete-272-320.jpg)
![Engineering Services, Inc.
Future
Performance
Reference
ULSAB
Phase II
180 200 220 240 260 280 300 320 340
Chapter 12 - Page 3
70
65
60
55
50
45
40
35
30
25
20
ULSAB
Target
Current
Average
f [Hz]
First Body Structure Frequency vs. Mass
m [kg]
Lowest global frequency
f with Glass, m without Glass
Reference Vehicles: Acura Legend, Chevrolet Lumina, Ford Taurus, Honda Accord, Lexus LS 400,
Mazda 929, Toyota Cressida
ULSAB
Phase I
60.1
203
Figure. 12-4 ULSAB Phase 2 Frequency Efficiency
The results of the crash analysis confirmed the integrity and safety of the ULSAB
structure. The AMS Offset Crash is considered one of the most severe crash tests
of today. In recently performed comparison crash tests of AMS, with the same
vehicle towards a deformable barrier with 40% offset at 64 km/h versus the AMS
Offset Crash barrier with 50% offset at 55 km/n, the results were nearly equal. This
confirms that the decision to analyze the ULSAB structure for its offset crash
behavior using the AMS test configuration, determined at the beginning of Phase 2
in 1995, was the right choice.
The NCAP 100% Frontal Crash was run at 35 mph, 5 mph above the federal
requirement of FMVSS 208, meaning 36% more energy had to be absorbed.
In both the 50% Offset and 100% Front Crash low footwell intrusion and structural
integrity proved the safety of the structure.](https://image.slidesharecdn.com/ulsabengrptcomplete-141013204259-conversion-gate01/85/Ulsab-engineer-report-complete-273-320.jpg)

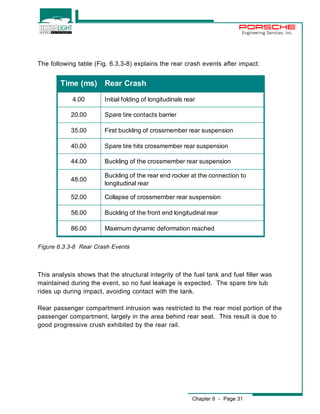
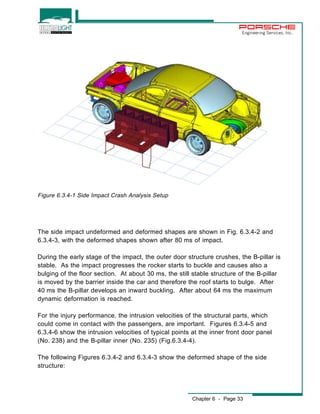
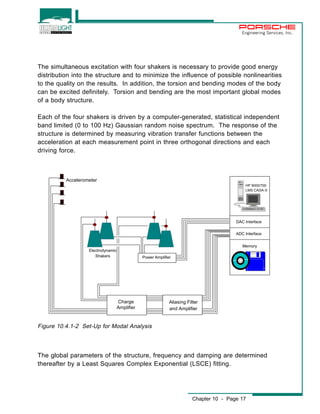
The ULSAB Phase 2 project validated concepts from Phase 1 by building demonstration hardware. Phase 2 achieved its goals of significant mass reduction compared to a reference vehicle, while meeting structural and crash performance targets. Testing showed the design exceeded Phase 1 targets for torsional and bending rigidity, and modal frequency. Mass reduction was 25% lower than the reference, and crash tests met new safety requirements. High strength steel use increased to 90% of the structure's mass. An economic analysis found the design could be produced at a similar or lower cost than conventional designs.


![AMIF2014 – [Automotive] Nevio di Giusto, Materiali avanzati per l’alleggerime...](https://cdn.slidesharecdn.com/ss_thumbnails/digiusto-materialiavanzatiperstruttureautomobilistiche-140924053917-phpapp02-thumbnail.jpg?width=640&height=640&fit=bounds)


