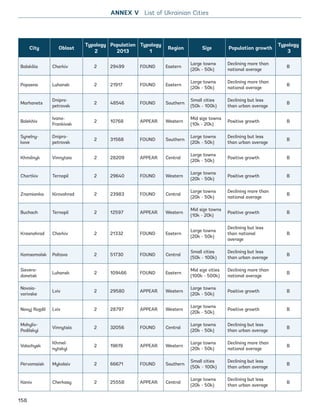
UKRAINEUrbanization Review
Report No: ACS15060
Disclaimer: This volume is a product of the staff of the International Bank for Reconstruction and
Development/The World Bank. The findings, interpretations, and conclusions expressed in this paper
do not necessarily reflect the views of the Executive Directors of The World Bank or the governments
they represent. The World Bank does not guarantee the accuracy of the data included in this work.
The boundaries, colors, denominations, and other information shown on any map in this work do not
imply any judgment on the part of The World Bank concerning the legal status of any territory or the
endorsement or acceptance of such boundaries.
Copyright Statement: The material in this publication is copyrighted. Copying and/or transmitting
portions or all of this work without permission may be a violation of applicable law. The International
Bank for Reconstruction and Development/ The World Bank encourages dissemination of its work and
will normally grant permission to reproduce portions of the work promptly.
For permission to photocopy or reprint any part of this work, please send a request with complete
information to the Copyright Clearance Center, Inc., 222 Rosewood Drive, Danvers, MA 01923, USA,
telephone 978-750-8400, fax 978-750-4470, http://www.copyright.com/.
All other queries on rights and licenses, including subsidiary rights, should be addressed to the Office
of the Publisher, The World Bank, 1818 H Street NW, Washington, DC 20433, USA, fax 202-522-2422,
e-mail pubrights@worldbank.org.
UKRAINE
iii
This volume is a product of the staff of the International Bank for Reconstruction and Development/The
World Bank. The findings, interpretations, and conclusions expressed in this paper do not necessarily
reflect the views of the Executive Directors of The World Bank or the governments they represent. The
World Bank does not guarantee the accuracy of the data included in this work. The boundaries, colors,
denominations, and other information shown on any map in this work do not imply any judgment on the
part of The World Bank concerning the legal status of any territory or the endorsement or acceptance
of such boundaries.
The material in this publication is copyrighted. Copying and/or transmitting portions or all of this work
without permission may be a violation of applicable law. The International Bank for Reconstruction and
Development/ The World Bank encourages dissemination of its work and will normally grant permission
to reproduce portions of the work promptly.
For permission to photocopy or reprint any part of this work, please send a request with complete
information to the Copyright Clearance Center, Inc., 222 Rosewood Drive, Danvers, MA 01923, USA,
telephone 978-750-8400, fax 978-750-4470, http://www.copyright.com/.
All other queries on rights and licenses, including subsidiary rights, should be addressed to the Office
of the Publisher, The World Bank, 1818 H Street NW, Washington, DC 20433, USA, fax 202-522-2422,
e-mail pubrights@worldbank.org.
© 2015 The International Bank for Reconstruction and Development / the World Bank
1818 H Street NW
Washington DC 20433
Telephone: 202-473-1000
Internet: www.worldbank.org
UKRAINEUrbanization Review
iv
Ukraine_2015_nov26.indd 4 2015-11-26 5:14 PM
Table of Contents
LIST OF ANNEXES vi
LIST OF TABLES vi
LIST OF BOXES vi
LIST OF FIGURES vii
LIST OF ACRONYMS x
ACKNOWLEDGEMENTS xi
INTRODUCTION xii
EXECUTIVE SUMMARY xv
CHAPTER 1 THE URBAN SYSTEM: DEMOGRAPHICS AND ECONOMIC TRENDS 1
I. Demographics 3
II. Urbanization and the Urban System 15
III. Regional Economic Trends 34
IV. Cities of Ukraine: Engines Of Economic Growth 51
CHAPTER 2 CITIES AND THE INTER-GOVERNMENTAL FISCAL SYSTEM 79
I. The Inter-Governmental System 81
II. Revenue Sources 88
III. Analysis of Expenditures  100
IV. Cities and the Fiscal System 108
CHAPTER 3 URBAN PLANNING AND THE SPATIAL DEVELOPMENT 113
I. Regulatory and Institutional Framework 115
II. Spatial Planning 118
III. Housing Market 125
IV. Planning as an Instrument for Managing City Growth And City Decline 130
CHAPTER 4 IMPACT OF THE CURRENT CONFLICT ON THE URBAN SYSTEM  135
ANNEXES141
v
Ukraine_2015_nov26.indd 5 2015-11-26 5:14 PM
List of Annexes
ANNEX I. 	 Special economic zones
ANNEX II. 	 Location quotient
ANNEX III.	 Methodological annex using night-lights data as a proxy for economic activity
ANNEX IV. 	 Robustness of city typologies
ANNEX V. 	 List of Ukranian cities
ANNEX VI.	 Extensive growth
ANNEX VII.	 Assignment of expenditure responsibilities in the budget code
ANNEX VIII. 	 Summary of urban  spatial planning legislation
ANNEX IX. 	 Summary of planning stakeholders
List of Tables
TABLE 1 	 Ukrainian diaspora by country of residence (ca. 2012)
TABLE 2 	 Between 2010 and 2012, migrants came mainly from Ukraine’s Western region
TABLE 3 	 Five largest urban centers in each region by population in 2013
TABLE 4 	 Ranking of Ukraine’s 15 largest cities by population
TABLE 5 	 Ranking of Ukraine’s largest urban agglomerations
TABLE 6 	 Ranking of the fastest growing cities in Ukraine
TABLE 7 	 Growth of sector employment in regions and relation of that sector employment against the 	
		 sector’s employment nationally using location quotients
TABLE 8 	 Cities with the highest number of firms in 2000 and 2008
TABLE 9 	 Typology of cities based on NLS observations between 1996 and 2010: selected statistics
TABLE 10 	 Ukraine’s agglomerations: merged night-light urban footprints
TABLE 11 	 Top global increment of built-up last 40 years
TABLE 12 	 Functional responsibilities
TABLE 13	 Own sources of local Government revenues
TABLE 14 	 Utilization of local revenue instruments by cities as % of UAH per capita, 2013
TABLE 15 	 Age distribution of housing stock
List of Boxes
BOX 1 		 Mono-functional cities system
BOX 2		 Evolution of the Propiska system
BOX 3		 Definition of agglomeration using night lights satellite imaging
BOX 4		 Poverty in Ukraine
BOX 5 		 The rise and fall of Ukraine’s coal industry
vi
Ukraine_2015_nov26.indd 6 2015-11-26 5:14 PM
List of Figures
FIGURE 1	 Ukraine’s population is declining faster than the ECA region average
FIGURE 2	 Aging is increasingly an urban issue in Ukraine
FIGURE 3	 Population dynamics flattened as the 	 younger share of the population has decreased
FIGURE 4	 The urban population age mimics the flattening of the general population pyramids
FIGURE 5	 The decrease in younger population is less in the rural areas. These areas also show a decrease in the
		 older cohorts of the population
FIGURE 6	 A sharp decline in fertility rates is leading to an important reduction of the young cohort
FIGURE 7	 Ukraine is aging more dramatically than neighboring countries
FIGURE 8	 The birth rate has recovered since 2001, but remains very low. fertility rates follow similar trends,
		 remaining under replacement levels at least since 1990
FIGURE 9	 Ukraine’s eastern region has the highest rate of overall population decline
FIGURE 10	 The eastern region has the highest overal decline in population in urban areas
FIGURE 11	 The average age is increasing in all urban areas
FIGURE 12	 Migration is increasingly a factor in ukraine’s population decline
FIGURE 13	 Labor migration rate by regions
FIGURE 14	 Both urban and rural populations declined between 1989 and 2011; yet the country continues to urbanize
FIGURE 15	 There are strong differences among urbanization levels across the regions
FIGURE 16	 Population dynamics are heterogeneous across ukraine’s regions. in all cases, however, population declines
		 yield increased urbanization rates
FIGURE 17	 Distribution of cities across Ukraine
FIGURE 18	 Ukraine has a high percentage of small and mid-sized towns - 2013
FIGURE 19	 Most of the urban population is concentrated in eight major cities - 2013
FIGURE 20	 The western region has the greatest number of small towns. also, its urban population lives mostly in mid-
		 sized cities (100-500k)
FIGURE 21	 All categories of cities in Ukraine are losing population
FIGURE 22	 Ukrainian cities with growing or declining population 2001-2013
FIGURE 23	 Real GDP decreased sharply after Ukraine’s departure from the Soviet Union (1991-1998) and
		 experienced a slow recovery lasting until the recent conflict (1999-2012)
FIGURE 24	 GDP per capita grew steadily from 1998 until the global financial crisis
BOX 6 		 Location quotient estimates of sector employment in the regions
BOX 7 		 A first typology of Ukraine’s cities
BOX 8 		 A second typology of Ukraine’s cities
BOX 9 		 Types of urban/spatial plans in Ukraine
BOX 10	 Kyiv 2025 city development strategy
BOX 11 	 Detroit (USA) master plan
BOX 12 	 Disconnect between reality and plan
BOX 13 	 National level spatial policy: Stadtumbau Ost and West (Germany)
vii
Ukraine_2015_nov26.indd 7 2015-11-26 5:14 PM
FIGURE 25	 EBRD transition INDEX (2012)
FIGURE 26	 GVA shares: the service and finance sectors now lead Ukraine’s economy, but the industrial sector still 	
		 occupies a prominent place
FIGURE 27	 The change in the share of employment by sector between 2001 and 2008 in percentage points against
		 sectoral productivity in 2001. the economy’s average productivity rate is provided for comparison
FIGURE 28	 GDP per person employed in countries of the former Soviet Union 2001
FIGURE 29	 Trend of GDP per person employed in Ukraine
FIGURE 30	 Remittances to Ukraine by expatriates, 2001-2013
FIGURE 31	 GVA shares: the Eastern and Southern regions remain more industrial in nature, while the central region is
		 predominent in trade, services and the financial sector
FIGURE 32	 Sectoral employment in the Western region by location quotient
FIGURE 33	 Sectoral employment in the Central region by location quotient
FIGURE 34	 Sectoral employment in the Eastern region by location quotient
FIGURE 35	 Sectoral employment in the Southern region by location quotient
FIGURE 36	 Ukraine’s urban GVA (upper graph) is much greater than its rural GVA (lower)
FIGURE 37	 Urban-rural GVA ratios are much greater than urban-rural population ratios, indicating much higher
		 productivity in the urban sector
FIGURE 38	 The performance of firms based on firm, city, and industry characteristics
FIGURE 39	 There is a strong positive correlation between urban GDP and night lights
FIGURE 40	 NIght lights and urban footprints in Ukraine 1996 and 2010
FIGURE 41	 Compound growth/decline in NLS in Ukraine between 1996 and 2010
FIGURE 42	 Urban GVA production at the oblast level
FIGURE 43	 Urbanization shows steady growth mainly in the Central and Western regions
FIGURE 44	 Real GVA growth per worker shows strongest increase in the Western region
FIGURE 45	 Distribution of found, appear, disappear, and missed cities by population in 2013
FIGURE 46	 Distribution of missed cities by population in 2013
FIGURE 47	 Distribution of found, appear, disappear, and missed cities by geographic location
FIGURE 48	 Distribution of found, appear, disappear, and missed cities
FIGURE 49	 Changes in NLS urban footprint vs. changes in NLS intensity in the urban core
FIGURE 50	 The distribution of city sizes varies across types in the second typology; type 1 cities are overall larger
FIGURE 51	 The distribution of cities by economic growth varies across types in the second typology; type 1 cities
		 have more cities with positive growth
FIGURE 52	 The distribution of cities by economic growth varies across types in the second typology; type 1 cities
		 have more cities with positive growth
FIGURE 53	 Intensity of night lights has a strong relationship to population dynamics
FIGURE 54	 The distribution of types of cities varies by region; the western region has the majority of thriving (type 1)
		cities
FIGURE 55	 Kyiv’s agglomeration 1996-2010
FIGURE 56	 Distribution of agglomerations and individual cities by city type; agglomerations are disproportionately
		 thriving (type 1)
FIGURE 57	 Ukraine is 4th in absolute number of new built-up areas over the last 15 years
FIGURE 58	 Prosperity is not pushing the massive addition of built-up areas in Ukraine
viii
Ukraine_2015_nov26.indd 8 2015-11-26 5:14 PM
FIGURE 59	 Sub-national governments account for almost half of public expenditures
FIGURE 60	 Sub-national expenditures are dominated by the three social sectors
FIGURE 61	 Composition of sub-national revenues, 2005-2012
FIGURE 62	 Decentralization of social services is associated with transfer dependence
FIGURE 63	 Type of city revenues and % of total provided by different tiers of government, 2013
FIGURE 64	 Composition of city revenues by night light type as % of total, 2013
FIGURE 65	 Composition of city revenues by population size as % of total, 2013
FIGURE 66	 Composition of city revenues as % of total relative to population decline, 2013
FIGURE 67	 Utilization of local revenue instruments by cities, uah per capita, 2013
FIGURE 68	 Utilization of local revenue instruments by city night light typology, UAH per capita, 2013
FIGURE 69	 Utilization of local revenue instruments by city population size, in UAH per capita, 2013
FIGURE 70	 Per capita revenue from own taxes and the night light typology of sub-oblast cities, in UAH, 2013
FIGURE 71	 Per capita revenue from own taxes and population decline of sub-oblast cities, in UAH 2013
FIGURE 72	 Composition of inter-governmental transfers to cities by type, 2013
FIGURE 73	 Composition of inter-governmental transfers to cities by population trend, 2013
FIGURE 74	 Composition of inter-governmental transfers to cities by population size, 2013
FIGURE 75	 Functional composition of city expenditures by sub-type, 2013
FIGURE 76	 Per capita expenditures on social sectors by night light category in sub-oblast cities, in UAH, 2013
FIGURE 77	 Average per capita expenditures by function and city population size, 2013
FIGURE 78	 Per capita expenditures by function and population trend, 2013
FIGURE 79	 Per capita expenditures on social sectors by population decline in sub-oblast cities, in UAH, 2013
FIGURE 80	 Economic composition of city expenditures by city typology, 2013
FIGURE 81	 Economic composition of city expenditures by city population size, 2013
FIGURE 82	 Economies of scale by economic item, 2013
FIGURE 83	 Economic composition of city expenditures by population trend, 2013
FIGURE 84	 Composition of capital expenditures by function and city typology, 2013
FIGURE 85	 Per capita capital expenditures by function and population size, 2013
FIGURE 86	 Per capita capital expenditures by function and population trend, 2013
FIGURE 87	 Hierarchy of spatial plans produced by dipromisto
FIGURE 88	 Dwelling stock by Tenure status 2000-2009
FIGURE 89	 Dwelling stock by country
FIGURE 90	 Level of mortgage penetration
FIGURE 91	 House price to income ratio
FIGURE 92	 Conflict and displacement in Eastern Ukraine (as of February 2015)
ix
Ukraine_2015_nov26.indd 9 2015-11-26 5:14 PM
List of Acronyms
CDS	 	 City Development Strategy
CIS	 	 Commonwealth of Independent States
CIT		 Corporate Income Tax
DN		 Digital Number
EBRD		 European Bank for Reconstruction and Development
ECA		 Europe and Central Asia Region
EU		 European Union
FAOSTAT	 Food and Agriculture Organization of the United Nations Statistics Division
FDI		 Foreign Direct Investment
FSU	 	 Former Soviet Union
GAWC		 Globalization and World Cities (Research Network)
GDP		 Gross Domestic Product
GHSL		 Global Human Settlement Layer
GIS 		 Geographic Information System
GVA		 Gross Value Added
ICT		 Information and Communications Technology
ILO 		 International Labor Organization
IMF		 International Monetary Fund
KM	 	 Kilometer
MGI		 McKinsey Global Institute
NLs		 Night lights
OECD		 Organisation for Economic Co-operation and Development
PIT		 Personal Income Tax
PPP		 Purchasing Power Parity
RPA 		 Recovery and Peacebuilding Assessment
SAR		 Special Administrative Region
SME		 Small and Medium Enterprises
SNG		 Sub-national Public Expenditures
UAH		 Ukrainian Hryvnya
UN		 United Nations
UUR		 Ukrainian Urbanization Review
USD		 United States Dollar
USSR	 	 Union of Soviet Socialist Republics
WDR	 	 World Development Report (World Bank)
WWII	 	 World War II
x
Ukraine_2015_nov26.indd 10 2015-11-26 5:14 PM
Acknowledgements
The Ukraine Urbanization Review was prepared under the Multi-Donor Trust Fund for Sustainable Urban Development,
which funds the World Bank’s urbanization reviews for all countries of the globe.
It was initiated before the onset of the current conflict in Eastern Ukraine and prior to the referenda held in the Autonomous
Republic of Crimea and the city of Sevastopol on 16 March 2014. The report uses historical data sets ranging between
1989 and 2013, as well as historical maps; further, the report does not intend to make any judgment as to the legal or
other status of any disputed territories or prejudice the final determination of the parties’ claims.
The study was developed under the guidance of Qimiao Fan and Sumila Gulyani. It benefitted from guidance and direction
provided by Peter Ellis, Christine Kessides, and Judy Baker.
The team that developed Chapter 1 was led by Paula Restrepo Cadavid and included Luis Eduardo Quintero, Benjamin
Stewart (GIS analysis), Katie McWilliams (GIS analysis and maps), and Sofia Zhukova. Chapter 2 was prepared by Andrey
Timofeev and Iryna Shcherbyna, and inputs from Sebastian Eckardt. Chapter 3 was prepared by Brent Ryan, Yarissa
Lyngdoh Sommer, Olga Mrinska, Kate Owens, and Mariana Kuchlevska. Copyediting was provided by Will Ferroggiaro
and graphic design additions by George Maier. The overall work on the Ukraine Urbanization Review was led by Kremena
Ionkova and Tamara Sulukhia.
The team has benefitted tremendously from guidance and comments provided by Mark Roberts, Denyz Nizalov, Olga
Mrinska, and Klavdiya Maksymenko.
xi
Ukraine_2015_nov26.indd 11 2015-11-26 5:14 PM
1
Eurasian Cities: New Realities along the Silk Road, World Bank (2012).
Objectives, Audience and Limitations
The present report is a diagnostic Economic and Sector Work (ESW) on the urban landscape in Ukraine. Its objective
is to link population dynamics with economic dynamics, and to present emerging spatial characteristics and trends.
Ukraine has experienced a dramatic population decline over the past two decades, which impacts the urban system. This
ESW seeks to elicit a policy dialogue on opportunities to enhance efficiency through dedicated urban planning and fiscal
instruments. The intended primary audience is the Government of Ukraine, including city mayors and city managers;
international partners; and other stakeholders engaged in the area of urban development.
The Ukraine Urbanization Review (UUR) was initiated before the onset of the current conflict in Eastern Ukraine and
prior to the referenda held in the Autonomous Republic of Crimea and the city of Sevastopol on 16 March 2014. The
report uses historical data sets ranging between 1989 and 2013 as well as historical maps. Consequently, events related
to the current conflict are not a part of the present analysis, although they are recognized in the concluding chapter of
this report. This stems from the lack of recent, reliable data from the conflict areas as well as the continuously evolving
and changing characteristics of the conflict. Despite this limitation, the UUR remains relevant and opportune in its
findings on trends, challenges, and opportunities for the urban system in Ukraine.
Report Organization
The UUR is organized into three main Chapters and a concluding Chapter.
Chapter 1
outlines recent demographic changes, presents the urban system and its economic characteristics, and develops city
typologies based on their economic, spatial and demographic patterns.
Chapter 2
offers an analysis of sub-national finance arrangements and examines tiers of government and the city typologies
developed in Chapter 1 for discrepancies that could be explored to enhance efficiency in spending.
Chapter 3
discusses current urban and spatial planning practices and outlines shortcomings in view of changing demographics.
The concluding Chapter touches on the impact of the current conflict on the urban space and system.
For clarity, the section immediately below describes the territorial administrative division of Ukraine as it is used
throughout this report.
Territorial-Administrative System of Ukraine
Ukraine has inherited its territorial-administrative system from the Ukrainian Soviet Socialist Republic and it has not
changed significantly since the 1950-60s when it was formed. Each of the 15 Soviet republics, depending on their
territory and population, was divided into several sub-regional tiers of administration1
. The larger republics— including
the Russian Federation and Ukraine—had three territorial-administrative tiers.
According to Ukraine’s constitution, the territorial–administrative system is as set forth below,
Introduction
xii
Ukraine_2015_nov26.indd 12 2015-11-26 5:14 PM
24 oblasts, 1 Autonomous Republic of Crimea and 2 cities of state
significance – Kyiv and Sevastopol (until 2013)
24 oblasts have elected councils, however they do not have own executive committees and all executive functions are
delegated to oblast state administrations – representative body of the central government. Most of Ukraine’s oblasts are
named after their respective administrative centers. Cities of Kyiv and Sevastopol had (until 2013) special status and are
regulated by separate laws. Cities have councils with executive committee, which at the same time performs functions of
the regional representative of central government (city state administration). Kyiv as well as being a separate territorial-
administrative unit serves as the administrative center for Kyiv oblast.
490 raions and 182 cities of oblast significance,
which have equal status within oblast
Both raions and cities have their elected councils. However only cities of oblast significance have their own executive
committees, which are responsible for implementation of municipal policies in the framework of their own powers. Raion
councils do not have executive committees and delegate all their executive functions to raion state administrations, similar
to oblast councils. In addition to 490 raions there are 111 municipal raions (districts) in larger cities of state and oblast
significance. At the moment only 55 municipal raions have their own councils but all of them have raion state administrations.
For example in Kyiv in 2010 ten raion councils were abolished by the decision of city council and approval of the parliament,
and raion state administrations were left to manage raions’ development. Also some cities might have separate settlements
and villages within their geographical boundaries, which have a separate administrative structures (councils). The oblast
significance status is usually granted to a city, which is an economic, administrative and cultural center. Each oblast has at
least one city of oblast significance as its administrative center.
cities of raion significance, urban and rural settlements,
and villages (united into communities).
Urban populated places can be either cities or urban settlements, while rural populated places can be either villages or rural
settlements. There are no state administrations below raion level and all basic tier territories are governed by their elected
councils and executive committees.
Central Government
Autonomous Republic of
Crimea (until 2013)
276 cities of raion significance
and 28,388 villages and settlements formed in 10,279 village and settlement councils
24 oblasts
490 raions
Cities with special status:
KyivSevastopol (until 2013)
182 cities of oblast significance
(including 111 municipal districts)
TIER 1
TIER 2
TIER 3
Introduction
xiii
Ukraine_2015_nov26.indd 13 2015-11-26 5:14 PM
The total of 458 cities of state, oblast and raion significance is considered for the
analysis presented in this Urbanization Review
Macroregions of Ukraine
Source: Kiev Institute Of Sociology (2013)
Introduction
Luts’k
Rivne
Lvyv
Uzhhorod
Ivano-Frankivs’k
Chernivtsi
Ternopil Khmelnytskyi
Vinnytsya
Zhytomyr
Kyiv
Chernihiv
Sumy
Poltava
Cherkasy
Kirovorad
Mykolayiv
Odesa
Zaporizhzhya
Kherson
Simferopol
Sevastopol
Kharkiv
Luhans’k
Donets’k
East
West
Center
South
Dnepropetrovsk
These are 2 cities of state significance, 182 cities of oblast significance (both types administered by their own councils
and executive committees) and 276 cities of raion significance that have their own councils and executive committees
however are more dependent on oblast state administrations. In addition, there are two cities, Chernobyl and Pripyat
that were abandoned after accident at Chernobyl nuclear power station in 1986 due to unsafe levels of radiation.
Although they officially have the administrative status of a city, they are not considered in the current analysis as they
do not have any population or economic activities and in practice are administered directly by the central government.
Due to the scale of the territory and population Ukraine is sometimes divided into macroregions and mesoregions –
groups of oblasts – that are used for the planning, economic, social, political and other purposes. For example, in USSR
era Ukraine officially had three economic macroregions, which were used for spatial planning of industrial development,
infrastructure, agriculture and system of settlements. This system was effective for large-scale planning however not
suitable for Ukraine when it became an independent state, as the scale of mobilization of resources and population
has downshifted. Ukrainian researchers have been proposing different systems of socio-economic macroregions and
mesoregions since the beginning of XX century, which would correspond to the spatial structure of Ukraine and would
better reflect the potential of each territory.
In order to combine the different oblasts of the country and in order to facilitate the analysis of economic and demographic
trends across the Ukraine territory macroregions have been identified in Ukraine. The model of regionalization used for
this Review has been developed by Kiel Institute of Sociology. In this model Ukraine is divided into four macroregions:
West, East, South and Central, as shown in the figure below. These macroregions do not have any legal or administrative
significance in Ukraine’s territorial-administrative system.
xiv
Ukraine_2015_nov26.indd 14 2015-11-26 5:14 PM
Executive Summary
The UKRAINE URBANIZATION REVIEW is
a DIAGNOSTIC REPORT on the URBAN
LANDSCAPE, linking population dynamics with
economic dynamics and presenting emerging
spatial characteristics and trends. It was initiated before
the onset of the current conflict in Eastern Ukraine and uses historical data sets ranging from 1989
to 2013. Consequently, events related to the current conflict are not part of the present analysis,
although they are addressed in the concluding chapter. The Ukraine Urbanization Review is limited to
data analytics rather than discussion of policy options and recommendations. Still, it outlines areas
and implication for further policy work as well as areas that require further analysis.
The CENTRAL FINDING of this report is that,
over the past two decades (prior to the conflict),
demographic profiles and economic activities in
Ukraine have been changing in a manner that has
not been uniform across the territory. Meanwhile,
urban public policy remained stagnant. Inter-governmental
fiscal relationships as well as urban and spatial planning, two key public policy tools, continue the
legacy of the past and have yet to be fully utilized in supporting economic growth and managing
decline across the urban space.
The key findings of the report are further summarized below.
xv
Ukraine_2015_nov26.indd 15 2015-11-26 5:14 PM
2
In providing a regional overview of the country, this document uses the description of four geographic regions developed by the Kiev
International Institute of Sociology: East, Center, South and West.
Shifting Economic Geography: from East to West
2
Over the past two decades, Ukraine’s population has been declining and aging, but not uniformly among regions. The
sharp decline in population (13 percent nationally over two decades) is linked to an overall aging trend, a significant
decline in fertility (below replacement levels since 1990), and, in part, out-migration. While population is declining across
the territory, the demographic transition has not been uniform across the regions. There is significant variation – the
Eastern Region has seen a sharper decline over the past two decades, while in the West the population decline has been
lower and a few cities, including Kyiv, continue to grow. At the same time, although the urban population is increasingly
aging across all regions, the Eastern Region is losing its youngest population at a faster rate..
Similarly, economic activity has been shifting within and across regions. This is confirmed by analyzing trends in regional
Gross Value Added (GVA), firm-level and employment locational data, and night-lights data (NLs – used to analyze the
dynamics of economic growth). Although the Eastern Region continues to play an important role in the economy, the
Western and Central regions have been much more dynamic. This is partly explained by a combination of lower initial
levels of economic activity in the West – compared to the East – and a faster transformation of the West from agriculture
to more productive sectors. The Eastern Region is also less productive than its urbanization level would suggest. The shift
can be observed clearly in the figure below, which compares night-lights data emissions between 1996 and 2010. The
red- and orange-colored areas are those that have experienced the highest growth in night-lights (proxy for economic
activity), while the blue areas are those with the lowest growth levels.
Compound Growth Rate, 1996-2010
Executive Summary
xvi
Ukraine_2015_nov26.indd 16 2015-11-26 5:14 PM
In terms of structural transformation, Ukraine’s economy has moved slowly from an industrial enterprise-centered
economy to a services-centered economy, with a finance sector at the forefront of this change. Services have grown
significantly in a number of areas, including retail, property, and information and communications technology. Here too,
progress has not occurred uniformly across the regions. Industry remains very important in the Southern and Eastern
regions, while the Western Region has seen a slow increase in the importance of services as the agriculture sector’s
dominance wanes. Finance’s share of national GVA has nearly doubled, but its share of the labor market is still minor and
cannot be expected to replace jobs in traditional sectors.
In the strict sense of the term, Ukraine continues to urbanize despite an overall decline in its urban population (as rural
population has declined even faster). The Eastern and Southern regions, which at the time of the fall of the Soviet Union
were already highly urbanized, have shown slower urbanization rates in the last two decades, while the historically rural
Western Region and to a lesser extent the Central Region experienced higher urbanization rates. The rural population
has migrated to urban areas at greater rates in the Western and Central regions, resulting in greater relative growth of
urban production in the West.
More than 80 percent of the cities have experienced population decline, but shrinking cities are disproportionally
concentrated in the East and growing ones are disproportionally concentrated in the West. An analysis of the evolution
of cities reveals that the Eastern Region has the highest number of cities that in 1996 met the threshold to be classified
as cities (in terms of the amount of night-light emitted), but had “disappeared” (i.e. were no longer classified as such) by
2010. By contrast, the Western Region has the highest number of “appeared” cities, i.e., cities that could not be classified
as cities by night-lights standards in 1996, but passed the night-light threshold in 2010. A similar “disappeared-appeared”
correlation with these regions is found when comparing population trends at the city-level between 1989 and 2013.
A large number of agglomerations are concentrated in the East; however, the agglomerations in the West and the Kiev
agglomeration are more dynamic. Only one city in the Western Region is ranked among the fifteen largest individual
cities. However, five agglomerations among the fifteen largest are located in this region, as well as four of the fastest-
growing cities. This suggests that, despite having the lowest urbanization levels, the cities in this region are taking
advantage of the economies generated by their agglomeration into large-scale urban regions. By contrast, the Eastern
Region has five cities among the largest fifteen individual cities, but has none of the fastest-growing cities. Finally, the
agglomeration patterns are much more concentrated in the Central Region, led by Kyiv’s agglomeration. The figure below
plots the location of Ukraine’s cities and agglomerations (agglomerations are labeled with the name of the main city
in them) with colors assigned according to their population growth rate. Again, this graph shows a strongly declining
Eastern Region, despite the fact it contains a large number of agglomerations. The West, by contrast, shows a higher
concentration of growing cities as well as cities that are at least declining less than the urban population and national
population. The significance of Kyiv’s agglomeration and its pattern of growth are noticeable.
Moving to Opportunity: Push and Pull factors
Observed economic geography shifts might have been even stronger if internal mobility was less constrained. Migration
studies reveal that few people in Ukraine are moving to opportunities. Migration to and between urban areas is typically
an indication that people are looking for better labor opportunities, and is a sign of an efficient re-organization of human
resources within a country (pull factors). In Ukraine, however, studies indicate that few people are moving to seek new
economic opportunities. Instead, their movement seems to be catalyzed by low levels of social spending in their home
regions (push factors). Key barriers to internal migration include very high housing ownership rates and an underdeveloped
rental market, the lack of access to credit and underdevelopment of the housing and mortgage market, the costs of
moving to economically vibrant regions of the country, and high transaction costs. Nevertheless, agglomerations have
been forming slowly.
Executive Summary
xvii
Ukraine_2015_nov26.indd 17 2015-11-26 5:14 PM
Percent Change in Population, 2001-2013
Percent Change
by city
Declining more than national
average (less than -6.3%)
Declining less than national
average (-6.3 to -5.7%)
Declining less than urban
average (-5.7 to 0%)
Growing Cities
Agglomerations: Engines of Economic Growth
Ukrainian cities and agglomerations in particular, are important engines of economic growth. Not only is urban sector
production much greater than rural sector production, in absolute terms, it is also much more productive in per capita
terms. Agglomerations in Ukraine seem to be concentrating the little urban (population) growth currently witnessed in
the country, but they are also engines of economic growth. Cities in all regions, especially smaller ones, have been losing
population, mostly to the largest cities, and usually to those that have formed large urban centers, or agglomerations.
Agglomerations, according to night-lights measurements, are more productive in both per capita and per km2 terms.
Firm-level data also shows that larger cities had a higher concentration of both economic activity and productivity.
The growth of agglomerations is indicative of a movement towards a more efficient urban system. Led by the Kyiv
agglomeration, these city clusters hold the large majority of the cities that are actually growing in population (eleven out
of fifteen fastest growing cities in the country belong to an agglomeration). This growth might be explained by the fact
that these larger groups of cities can through their agglomeration increase productivity by sharing costs, increase access
to and the size of their markets, and enhance interactions between citizens and firms. The agglomerations of Ukraine
are therefore an important source of economic growth in the country.
Overall for Ukraine, steady progress has been observed in the main economic (GDP and GDP per capita) and poverty
indicators over the last decade. However, continued progress in these areas is highly uncertain due to (i) the observed
negative population trends; (ii) the current conflict; and (iii) the slow progress that Ukraine has made in terms of
institutional adaptation and reforms. It is not uncommon that a declining population initially has a positive impact on
Executive Summary
Source: Ukraine Statistics Department
xviii
Ukraine_2015_nov26.indd 18 2015-11-26 5:14 PM
economic indicators, but its effect on economic performance over the long run is uncertain. The higher GDP per capita
that is observed following population decline is generally linked to the fact that capital is durable. Such economies may
experience an increase in their capital per worker ratio, which may render each inhabitant marginally more productive.
Additionally, decreasing population causes an initial shortage of labor, increasing relative demand for it, and potentially
resulting in a reduced unemployment rate as well as higher wages. The negative effects of population decline appear
later, and are generally visible in the decline in demand for consumption. The effects over time of diminished demand as
well as expectations of further population decline reduce incentives for investment and affect GDP growth negatively3
.
Additionally, fixed costs in the provision of services also become more burdensome as they are shared among fewer
people. Overall, given the demographic trends, the observed increase in GDP per capita should be viewed with cautious
optimism; if appropriate measures are not adopted, the increase may not be sustained in the mid-term or long term.
Ukraine’s firms and institutions have been adapting slowly to a market economy system. Compared to other countries
in the region, Ukraine lags behind in its transition from a centrally-planned economy to a market economy, as well as
on its institutional and business environment reforms (for instance, in surveys on the ease of doing business, Ukraine
ranks 96th
worldwide and 22nd
in the ECA region4
). The EBRD transition index finds Ukraine doing poorly in several areas,
including small-scale privatization efforts, enterprise restructuring, price liberalization, and trade and foreign exchange
policy. Unless changes are made in these spheres, continued progress will be threatened.
Emerging City Typology: Growing and Shrinking Cities
An analysis of the urban system reveals the emergence and consolidation of three city types with contrasting economic,
spatial, and demographic patterns. The typologies were constructed based on whether cities have growing or declining
economic activity, growing or declining population, and expanding or shrinking urban footprints5
.
Cities growing in economic activity and expanding in footprint are also performing better in other indicators. These cities
have on average significantly lower declines in population, higher concentrations of economic activity and higher rates
of growth, and higher productivity. 22 percent of Ukrainian cities and the majority of the largest cities in the country
fall within this category (Type 1). These cities are also overwhelmingly concentrated in the Western and Central regions.
However, it is important to highlight that an important number of Type 1 cities continue to grow economically despite
declining in population. This means that in these areas population decline is not necessarily coming at the expense of
growth. While this might be a reflection of a temporal increase in productivity due to an increase in the capital per worker
ratio – as observed at the national level – it might also be linked to a decline in congestion costs associated with the city
moving toward a new population equilibrium.
On the contrary, cities that are declining in economic activity have experienced a sharper population decline. The majority
of cities in Ukraine (68 percent) fall under this category. Compared to their thriving peers, these cities are smaller in
size (averaging 50,000 inhabitants), are concentrated in the Eastern and Southern regions and to a lesser extent in
the Central Region, and have much lower levels of productivity. Two distinct types can be found here: those that are
declining in economic activity and shrinking in urban footprint (Type 2) and those that despite economic decline present
an expanding urban footprint (Type 3). Type 2 and Type 3 cities are and will continue to experience important urban
development challenges including financing and operating their infrastructure as economies of scale decrease with falling
population density. These challenges are greater for declining and sprawling cities (Type 3).
Executive Summary
xix
Ukraine_2015_nov26.indd 19 2015-11-26 5:14 PM
Urban Public Policy Tools: Intergovernmental
Fiscal Policy
Intergovernmental fiscal relations have lagged behind as a key instrument of urban public policy. Until 2014, the majority
of fiscal revenues were not raised by city governments, but came from retained shares of national taxes and transfers.
The allocation of these transfers was largely based on the existing network of service facilities and staffing rather
than on the demand for services. The system of inter-governmental transfers has led to wide disparities across city
types in per capita levels of expenditures per function. The highest per capita expenditures were observed in cities with
declining cores and peripheries, while the lowest were observed in growing cities with expanding footprints. Such financial
disincentives, combined with legal constraints on local government’s discretion in downsizing the network of facilities
and staff, impede the fiscal adjustments necessitated by Ukraine’s demographic and economic changes.
In December 2014, the Budget Code was significantly changed; it is expected to help improve the alignment of resources
to actual population as part of the ongoing decentralization reform in Ukraine. As a result, the new equalization system
will factor in per capita revenue levels and thus significantly decrease the disincentive that focuses on infrastructure
need. Such re-design of the transfer mechanism will likely realign resources among local governments, channeling more
resources to large and growing cities. Derivation-based sharing of revenues, although partially mitigated with a new basic
grant, will likely exacerbate the impact on shrinking cities. It will, however, improve the efficiency of spending. These
changes are expected to improve fiscal autonomy and to better align public services with the needs of local communities.
Urban Public Policy Tools: Urban Planning
Planning has also lagged behind as a key instrument of urban public policy. Urban planning in Ukraine bears the legacy of
a centralized planning system. It is not sufficiently flexible to respond to market conditions and to be an effective tool in
developing the urban space. Centralized development of master plans and zoning plans is inefficient, costly, and distant
from realities on the ground. It is also not sufficiently transparent or welcoming to public input and debate. In addition,
the planning framework is not equipped to adequately support strategies that reflect the reality of population loss and
economic decline. Existing urban plans are aligned with national growth policies, and so propose expansions of housing
and economic activity across all cities despite different local contexts.
Recent steps outlined in the Government’s Action Plan on Decentralization that orchestrate towards a planning reform,
if implemented in full, have the potential to place planning at the local level, which will permit cities to correlate their
own priorities with their economic and social needs. It will promote a more transparent system resulting in plans more
closely attuned to the actual conditions of growing and shrinking cities. Such changes will require increased funding and
intense capacity-building at the local level. In addition, there is an increased need to raise awareness about the scale and
consequences of urban decline so that local governments start to reflect their population’s realities in their urban plans.
3
Markus Brückner and Hannes Schwandt, Income and Population Growth: Discussion Paper No. 7422, Bonn: Institute for the Study of Labor,
May 2013, available at http://ftp.iza.org/dp7422.pdf.
4
World Bank Group, Doing Business 2015: Going Beyond Efficiency, available at http://www.doingbusiness.org/data/exploreeconomies/
ukraine/. Only Kiev is considered.
5
A fourth city type (Type 4) with growing light intensity in the core but shrinking urban footprint was found. However, only two cities –
Donetsk and Zaporizhia – comprised this classification.
Executive Summary
xx
Ukraine_2015_nov26.indd 20 2015-11-26 5:14 PM
What Does It All Mean for the Future? Implications
for Further Analysis and Policy Work, and the Role
of the Conflict
The overall decline and aging of the Ukrainian population poses important economic and urban development challenges
with implications in terms of fiscal policy and demand for public services. Overall labor participation might decline, as
older workers leave the labor force and become a larger share of the population. This aging may lead to a reduction of
tax revenues due to a diminishing workforce and lower private savings of workers, while it is also expected to lead to an
increase in demand for public expenditures related to healthcare, long-term care, and pensions. However, as argued in
the recent World Bank Study “The Golden Age of Aging,”6
an aging and declining population does not necessarily lead to
economic catastrophe. For instance, a reduction of the labor force can make more capital available to existing workers
and lead to increased productivity. To lessen the potential negative consequences of an aging population, the report
recommends increasing the retirement age to better reflect gains in life expectancy; focusing on policies that increase
fertility to sustainable levels; reforming health and long-term care systems to allow for healthier aging; and embracing
migration as a part of the solution. Local governments have a key role to play in this.
As cities shrink, Ukraine needs to put in place the right national policies to better manage the population decline of most
of its cities while managing population growth in the large agglomerations. The Central Government should create the
right mechanisms and incentives (e.g., financial transfers) so that cities focus on declining efficiently and shifting their
focus from existing infrastructure to future demand such as agglomerating schools when needed. Given the extent of
urban decline, the country should explore the need for establishing national-level programs, such as technical assistance
and funds for downsizing, that provide resources to better manage decline. There is also a need to increase awareness of
the scale and type of urban decline as many cities continue to follow unrealistic population growth projections.
At the same time, local authorities will need to re-assess how infrastructure is planned and maintained and the way
services are financed and delivered. Neighborhoods may need to be consolidated as cities lose density. Public service
plans, designed for larger populations, may have to be re-considered to address lower demand. In addition, an aging
urban population has consequences for the demand for and type of housing (e.g., long-term care facilities), the demand
for public transportation (as elderly tend to commute less and have different design needs), and other basic services. The
combination of an overall aging urban population and declining fertility rates will also likely shift demand from education
to health services. Urban areas will, therefore, need to adapt their social and material infrastructure to better serve the
changing needs and demands of their populations.
Ukraine should also recognize the role of urban areas in economic growth and make sure that they use the right tools to
reach their full potential. To achieve increased productivity in urban centers, the right mix of good governance, a beneficial
business climate, and an efficient provision of public goods, usually in the form of public services and infrastructure, is
necessary so that agglomeration economies are fostered and congestion costs reduced. In urban areas experiencing
population growth, cities should focus on adapting infrastructure and services to ensure that new-comers are well-
absorbed and integrated into the city and manage peri-urban growth to avoid sprawl, etc. In addition, the realignment
of city boundaries or introduction of metropolitan governance mechanisms might be needed to achieve an effective
coordination of agglomerations which span across administrative units. This might require the involvement of the Central
Government and is particularly important in the case of public transport. The country also needs to put in place the
right policies in cities that continue to grow economically, but are experiencing population decline. In these cases, city
administrators should aim at managing population decline in an efficient and harmonious way making the best out of it,
for example, turning brownfields into public space and optimizing public transportation.
Executive Summary
xxi
Ukraine_2015_nov26.indd 21 2015-11-26 5:14 PM
13
Ukraine should reduce barriers to move internally. The low mobility of Ukraine’s internal population is an obstacle preventing
the country from reaping the rewards of its urban potential. Improved mobility might further spur the growth of urban
centers with emerging employment opportunities. However, increased mobility most likely will also deepen the decline
of most Ukrainian cities, which will then require policies to protect the less mobile and more vulnerable population that
is left behind. Increasing population mobility will require eliminating or reducing some of the obstacles to move including
making the housing market more fluid and permeable (e.g., by increasing rental options and improving access to housing
finance) and lowering the transaction costs of moving. In addition, as outlined in the World Development Report 20097
,
governments should be neutral in regards to the migration of unskilled labor: encouraging migration for economic reasons,
discouraging migration in search of public services, and strongly supporting internal migration of skilled labor. The latter
can be done through investment in services in lagging areas to build portable human capital and to increase the flow of
labor market information, among other initiatives, so migrants arrive better informed of employment opportunities.
In terms of fiscal policy, Ukraine’s policy makers might re-think the structure of functional sub-national expenditure
in view of changing demographics. So far, expenditures for education have been steadily increasing despite the rapidly
aging population, which itself has placed increasing demands on the health system. By earmarking new subventions
separately for education and health, the new system can take advantage of under-utilized social infrastructure and focus
on increasing capacity in places with growing demand. More generally, the focus of reforms in the short-term might be
on increasing the yield of user fees and property taxes as a way to make cities assume their responsibility to collect own
revenue. In the medium-term, some of these taxes could be re-assigned from national to the sub-national level as a way
to increase horizontal accountability of local officials to their residents as well as fiscal responsibility. Addressing fiscal
fragmentation and amalgamating the bottom tier should remain a priority for government as a way to improve fiscal
efficiency in service provision.
Finally, urban planning and spatial development should take note of the continuing demographic changes and shifts
in the country. Current mobility remains low and the high homeownership rate has prevented the widespread housing
abandonment that characterizes typical shrinking cities in Europe and United States. Once mobility increases and
people start migrating to opportunity, declining cities are likely to decline even faster, while the growing centers and
agglomerations may experience peri-urban growth and sprawled development. In both cases, authorities will need to
reassess how infrastructure is planned and maintained to ensure that shrinking cities continue to provide acceptable
levels of service to their populations at reasonable cost, while growing urban centers are supported to foster further
growth.
13
6
World Bank Group, The Golden Age of Aging (2014).
7
World Bank (2009), Reshaping Economic Geography – World Development Report.
Executive Summary
xxii
Ukraine_2015_nov26.indd 22 2015-11-26 5:14 PM
xxiii
Ukraine_2015_nov26.indd 23 2015-11-26 5:14 PM
CHAPTER 1
The Urban System:
Demographics and
Economic Trends
1
CHAPTER 1
The Urban System:
Demographics and
Economic Trends
Ukraine_2015_nov26.indd 1 2015-11-26 5:14 PM
Key Highlights and Implications for Further Policy
and Analytical Work
Over the past two decades, Ukraine has experienced population decline and aging trends, which have had important
consequences at the city level. Over this time, national population has declined by 13 percent; urban population has declined
by around 9 percent. In the strict sense of the term, the country continues to urbanize as its rural population is declining
at faster rates than its urban population. However, more than 80 percent of its cities are losing population. There are
important geographic differences in this demographic transition with the Eastern region observing a sharper population
decline when compared to the Western and Central regions. In a similar way, shrinking cities are disproportionally
concentrated in the East while growing ones are disproportionally concentrated in the West. The observed demographic
shifts across the territory might have been stronger if mobility had been less constrained, as internal migration has been
low. In fact, recent migration studies reveal that in Ukraine few people are moving to economic and social opportunity.
Economic activity has been shifting within and across regions, but Ukraine’s firms and institutions have been slow in
adapting to a market economy. This is confirmed by analyzing trends in regional Gross Value Added (GVA), firm-level and
employment location data, and night-light (NLs) data (used as a proxy for economic activity). Although the Eastern region
continues to play an important role in the economy, the Western and the Central regions have been much more dynamic.
This is partly explained by a combination of lower initial levels of economic activity in the West – compared to the
East – and a faster transformation of the West from agriculture to more productive sectors. The Eastern region is also
less productive than its urbanization level would suggest. There has also been a shift in the structure of the Ukrainian
economy with the service sector growing significantly in importance in the Western and Central regions. The structural
shift has been accompanied by steady progress in the main economic indicators of the country (GDP, GDP per capita,
and poverty). However, continued progress in these areas is highly uncertain due to (i) the observed negative population
trends, (ii) the current conflict, and (iii) the slow progress that the country has made in terms of institutional adaptation
and reforms towards a market-oriented system.
Ukrainian cities and agglomerations, in particular, are important engines of economic growth. The urban sector is more
productive than the rural both in absolute and per capita terms. Agglomerations – cities whose NLs footprint merge
– account for the little urban population growth currently witnessed in the country, and are more productive in both
per capita and per km2 terms than their smaller peers. Firm-level data also show that larger cities have a higher
concentration of both economic activity and productivity. This growth might be explained by the fact that these larger
groups of cities can through their agglomeration increase productivity by sharing costs, increasing access to and the size
of their markets, and enhancing interactions between citizens and firms.
Over the past decade, three City Types with contrasting economic, spatial and demographic patterns have emerged
and consolidated in Ukraine. The first type corresponds to cities that are growing in economic activity and expanding in
footprint (Type 1). Type 1 cities – which comprise 22 percent of the urban system – are also performing better in other
indicators; they have, on average, significantly lower declines in population, higher concentrations of economic activity
and rate of growth, and higher productivity. However, an important number of Type 1 cities continue to grow economically
despite declining in population. This means that in these areas – at least in the short term – population decline is not
coming at the expense of growth. The second and third types of cities correspond to cities that are declining in economic
activity, but either shrinking (Type 2) or expanding (Type 3) in footprint. They have much lower productivity levels, have
experienced a sharper population decline, are smaller in size (average 50,000 inhabitants), and are overwhelmingly
concentrated in the Eastern and Southern regions. These cities are experiencing and will continue to experience important
urban development challenges, including financing and operating their infrastructures as economies of scale decrease
with falling population density.
1 Figures that do not include a source in this Chapter were developed by World Bank staff working on the report.
CHAPTER 1 The urban system: Demographics and Economic Trends1
2
Ukraine_2015_nov26.indd 2 2015-11-26 5:14 PM
Going forward, Ukraine needs to put in place the right policies to better manage urban population decline while managing
growth in the number of large agglomerations. On the one hand, the overall decline and aging of the Ukrainian population
poses important economic and urban development challenges with implications in terms of fiscal policy, infrastructure
financing, and demand for public services. In shrinking cities, neighborhoods may need to be consolidated and public
service plans designed for larger populations may have to be re-considered to address lower demand. The combination
of an overall aging urban population and declining fertility rates will also likely shift demand from education to health
services. The Central government should in turn create the right incentive frameworks so that cities focus on declining
efficiently. Given the scale of urban population decline, the country should explore the need for establishing national-level
programs, such as technical assistance and funds for downsizing. On the other hand, the country should recognize the
role of urban areas in economic growth and make sure that growing urban centers have the right tools to reach their
full potential. To increase productivity in urban centers, the right mix of governance, a beneficial business climate, and
efficient provision of public services and infrastructure is necessary so that agglomeration economies are fostered and
congestion costs are reduced. In the case of agglomerations that span across administrative units, the country might
need to assess the benefits of realigning city boundaries or the introduction of metropolitan governance mechanisms.
In addition, to reach its full economic potential the country needs to reduce barriers so that people can move to
opportunity. However, increased mobility will likely deepen the decline of most Ukrainian cities, which will then require
policies to protect the less mobile and more vulnerable population that is left behind. Increasing population mobility will
require eliminating or smoothening some of the obstacles to move, including making the housing market more fluid and
permeable (e.g., increase rental options and improve access to housing finance) and lowering the transaction costs of
moving.
I. Demographics2
A declining and aging population presents challenges
going forward
Over the past two decades Ukraine has experienced a dramatic population decline. In 1993, Ukraine had 52.2 million
inhabitants while in 2013, it was estimated to have 45.5 million inhabitants. Over this period the country lost 13 percent
of its population. While similar levels of population decline can be found in other countries in the region, such as Bulgaria
(-14 percent) and Romania (-13 percent), the degree of decline in Ukraine’s population growth rate is below the ECA
regional average (Figure 1). The sharp decline in population growth rate observed in the decade after the fall of the Soviet
Union – 1990 to 2000 – was partly the result of out-migration but was also very much linked to an overall aging trend
of the population and a significant decline in fertility. However, the sharp decline in the growth rate appeared to be
rebounding toward population stabilization prior to the current conflict.
CHAPTER 1 The urban system: Demographics and Economic Trends
2 In order to provide a regional overview of the country, this document uses the definition of four geographic regions developed by the Kiev
International Institute of Sociology: East, Center, South, and West.
3
Ukraine_2015_nov26.indd 3 2015-11-26 5:14 PM
The overall decline in the population, much like in the region, is driven by a strong decline in fertility rates and a fast
aging population, but it is also exacerbated by still high old-age mortality rates. The average age in Ukraine has increased
from 33 to 39 over the last 20 years, led largely by a dramatic increase in the average age in urban areas. Measured by
average remaining life expectancy, Central and Eastern Europe is by far the oldest region in the world, even significantly
older than Western Europe. As in Ukraine, this is caused by low fertility rates and high old-age mortality rates. As an
example, in France a 71-year-old man in 2009 had the same risk of dying as a 60-year-old man in 1959, while in Ukraine
a 54-year-old man in 2009 had the same risk of dying as a 60-year-old in 1959.
Figure 2 – Aging is increasingly an urban issue in Ukraine
Source: World Development Indicators
Source: Ukraine Statistics Department
CHAPTER 1 The urban system: Demographics and Economic Trends
Figure 1 – Ukraine’s population is declining faster than the ECA region average
Azerbaijan
Kyrgyz Republic
Turkey
Romania
Russian Federation
Ukraine
Europe  Central Asia
(developing only)
AnnualPopulationGrowth(%)
1961
1964
1967
1970
1973
1976
1979
1982
1985
1988
1991
1994
1997
2000
2003
2006
2009
2012
4
3
2
1
0
-1
-2
40
38
36
34
Averageage
Total Avg age
Urban Avg age
Rural Avg age
1990 1995 2000 2005 2010
4
Ukraine_2015_nov26.indd 4 2015-11-26 5:14 PM
17
Ukraine’s population dynamics are very different across the age distribution, with declining fertility rates creating a
diamond-shaped population pyramid (Figure 3). Both Figure 3 and Figure 4 below suggest that the overall negative
population growth is better demonstrated with data disaggregated by age. The decline in the 0-10 years cohorts is much
sharper (-41 percent) than the one observed in the 11-39 years cohorts (-6 percent) between the years of 1989 and 2011.
In addition, the decline of these younger cohorts is higher, in percentage terms, in urban areas (-42 percent) than in
rural areas (-38 percent), which is probably due to lower urban fertility rates. This also supports our previous point of an
increasingly accelerating average age in urban areas.
The fastest growing segment of the population – by age cohort – is the 60+ cohort living in urban areas (Figures 4 and 5).
Between 1989 and 2011, this age cohort grew 21 percent in urban areas. By contrast, a 19 percent decrease of this cohort
in the rural areas offset the effect of this urban growth, such that national growth was 3 percent. The dynamics within
this older age cohort are different between genders, with the 60+ overall population increasing 11 percent among men,
while increasing less than 1 percent for women between 1989 and 2011. Some analysts suggest that the large number
of men that died during the Second World War3
could explain the low numbers observed in 1989 in this cohort and the
subsequent large percentage increase in 2011. Large increases can be observed in the urban population of men in the
60+ age cohort, which grew 26 percent, and of women of the same age group, which grew 18 percent. In contrast, in the
rural sector, population in this age cohort decreased for both men and women, but more than twice as fast for women
than men (23 percent for women and 10 percent for men). These trends are a result of the combination of internal and
external migration dynamics, where more men can be found migrating internally from rural to urban areas, and relatively
more women migrating outwards.
CHAPTER 1 The urban system: Demographics and Economic Trends
Figure 3 – Population dynamics flattened as the younger share of the population has decreased
Source: Ukraine Statistics Department
3 It is estimated that around 7 million people died in this period (Andrew Gregorovich, World War II in Ukraine: Total Losses by Country).
3 000 3 0002 000 2 0001 000 1 0000
100
95-99
90-94
85-89
80-84
75-79
70-74
65-69
60-64
55-59
50-54
45-49
40-44
35-39
30-34
25-29
20-14
15-19
10-14
5-9
0-4
Population Pyramid 1989
WomenMen
3 000 3 0002 000 2 0001 000 1 0000
100
95-99
90-94
85-89
80-84
75-79
70-74
65-69
60-64
55-59
50-54
45-49
40-44
35-39
30-34
25-29
20-14
15-19
10-14
5-9
0-4
Population Pyramid 2011
WomenMen
ThousandsThousands
5
Ukraine_2015_nov26.indd 5 2015-11-26 5:14 PM
Figure 4 – The urban population age mimics the flattening of the general population pyramids
Figure 5 – The decrease in younger population is less in the rural areas. These areas also show a
decrease in the older cohorts of the population
Source: Ukraine Statistics Department
Despite its similarities to populations of other countries of the Former Soviet Union (FSU), Ukraine’s population is aging
more dramatically. As shown in Figure 7, for both 1991 and 2008, Ukraine had the lowest percentage of population aged
0-14 than any other country of the FSU. At the same time, Ukraine’s share of population that is age 65 and older is the
region’s largest and is increasing. These trends are accompanied by a slightly recovering but still very low birth rate since
2001 (Figure 8). More importantly, fertility rates remain very low and under replacement levels at least since 1990.
CHAPTER 1 The urban system: Demographics and Economic Trends
2 000 2 0001 500 1 5001 000 500 500 1 0000
100
95-99
90-94
85-89
80-84
75-79
70-74
65-69
60-64
55-59
50-54
45-49
40-44
35-39
30-34
25-29
20-14
15-19
10-14
5-9
0-4
Urban Population Pyramid 1989
WomenMen
Thousands
2 000 2 0001 500 1 5001 000 500 500 1 0000
100
95-99
90-94
85-89
80-84
75-79
70-74
65-69
60-64
55-59
50-54
45-49
40-44
35-39
30-34
25-29
20-14
15-19
10-14
5-9
0-4
Urban Population Pyramid 2011
WomenMen
Thousands
10 000 10 0004 000 4 0006 000 6 0008 000 8 0002 000 2 0000
100
95-99
90-94
85-89
80-84
75-79
70-74
65-69
60-64
55-59
50-54
45-49
40-44
35-39
30-34
25-29
20-14
15-19
10-14
5-9
0-4
Rural Population Pyramid 1989
WomenMen
Thousands
10 000 10 0004 000 4 0006 000 6 0008 000 8 0002 000 2 0000
100
95-99
90-94
85-89
80-84
75-79
70-74
65-69
60-64
55-59
50-54
45-49
40-44
35-39
30-34
25-29
20-14
15-19
10-14
5-9
0-4
Rural Population Pyramid 2011
WomenMen
Thousands
6
Ukraine_2015_nov26.indd 6 2015-11-26 5:14 PM
Ukraine’s population dynamics vary across its regions, with the Eastern region losing its youngest population at a faster
rate than others. This region presents negative growth at all cohort levels, except for the 60+ age cohort (See Figure 9
below). By contrast, all of the other regions present positive growth of the 40-60 years cohort. The population in the
Western region is declining at a slower pace; this is due both to its – on average – higher fertility rates (12.76 births per
1,000 inhabitants in Western versus 9.7 births per 1,000 inhabitants in the Eastern region) and lower mortality rates
(13.62 per 1,000 inhabitants in the Western versus 15.56 per 1,000 inhabitants in the Eastern region) than Eastern,
central and southern regions. Additionally, higher mortality rates in the Eastern region may be explained by a significant
share of employment in the region in the mining sector, a sector that generally presents higher rates of employee
mortality and disability4
.
4 The Jamestown Foundation states that Ukraine has the world’s second-highest mining fatality rate, behind only China (Eurasia Daily Monitor
Volume: 6 Issue: 167). This is a common trend worldwide. For example, mining has the second highest fatality rate among all sectors in the US
(US Bureau of Labor Statistics; national census of fatal occupational injuries in 2006).
Figure 6 – A sharp decline in fertility rates is leading to an important reduction of the young cohort
Source: Ukraine Statistics Department
CHAPTER 1 The urban system: Demographics and Economic Trends
Figure 7 – Ukraine is aging more dramatically than neighboring countries
Source: Eurasian Cities 2012
national
urban
rural
all ages 0-10 11-24 25-39 40-60 60 plus
30%
20%
10%
0%
-10%
-20%
-30%
-40%
-50%
Population changes by age cohort in Ukraine (1989-2011)
20081991
Tajikistan
Uzbekistan
Turkmenistan
Kyrgyz Republic
Azerbaijan
Kazakhstan
Armenia
Moldova
Georgia
Belarus
Russian Fed.
Ukraine
Percentageoftotalpopulation
Population ages 0-14
50
45
40
35
30
25
20
15
10
5
0
20081991
Tajikistan
Uzbekistan
Turkmenistan
Kyrgyz Republic
Azerbaijan
Kazakhstan
Armenia
Moldova
Georgia
Belarus
Russian Fed.
Ukraine
Percentageoftotalpopulation
Population ages 65 and older
18
16
14
12
10
8
6
4
2
0
7
Ukraine_2015_nov26.indd 7 2015-11-26 5:14 PM
Figure 8 – The birth rate has recovered since 2001, but remains very low. Fertility rates follow
similar trends, remaining under replacement levels at least since 1990
Figure 9 – Ukraine’s eastern region has the highest rate of overall population decline
Source: Ukraine Statistics Department (left) and World Bank WDI (right)
Source: Ukraine Statistics Department
CHAPTER 1 The urban system: Demographics and Economic Trends
Urban areas are aging rapidly across all Ukraine’s regions. While increases in aging in the urban population’s first three
age cohorts—0 to 10, 11 to 24, and 25 to 39—look very similar to those observed for all Ukraine, the 60+ urban cohort
is growing at a much faster pace than other cohorts in urban areas (Figure 10). Among this cohort, the fastest growing
population is in the Western Region, which is also observing a significant increase in its 40 to 60 age cohort. The fast-
aging urban population, across all regions, is reflected in an increase in Ukraine’s average age as shown below in Figure 11.
Western Eastern Central
Southern Ukraine
1995 20122001
13
11
9
7
5
Births per 1000 inhabitants
1990
1992
1994
1996
1998
2000
2002
2004
2006
2008
2010
2012
2.2
2.1
2.0
1.9
1.8
1.7
1.6
1.5
1.4
1.3
1.2
1.1
1.0
Fertility Rates
Fertility Rates Replacement rate
Ukraine
Central Region
Southern Region
Western Region
Eastern Region
20%
10%
0%
-10%
-20%
-30%
-40%
-50%
all ages 0-10 11-24 25-39 40-60 60 plus
Population changes by age cohort and by regions (1989-2011)
8
Ukraine_2015_nov26.indd 8 2015-11-26 5:14 PM
CHAPTER 1 The urban system: Demographics and Economic Trends
Figure 10 – The Eastern region has the highest overal decline in population in urban areas
Figure 11 – The average age is increasing in all urban areas
Source: Ukraine Statistics Department
Ukraine
Central Region
Southern Region
Western Region
Eastern Region
40%
30%
20%
10%
0%
-10%
-20%
-30%
-40%
-50%
-60%
all ages 0-10 11-24 25-39 40-60 60 plus
Urban population changes by age cohort and by regions (1989-2011)
45
40
35
30
45
40
35
30
Averageage
Total Avg age Urban Avg age Rural Avg age
1990 19901995 19952000 20002005 20052010 2010
Western Eastern
Central Southern
9
Ukraine_2015_nov26.indd 9 2015-11-26 5:14 PM
CHAPTER 1 The urban system: Demographics and Economic Trends
Although both a decline in fertility and aging play a central role in the overall population decline, out-migration is also
playing an important role. An analysis of implied migration5
data across regions suggests that a large part of the
population decline is the result of net out-migration reveals the potential role that outmigration can be playing on the
overall population6
decline. In addition, the Western region presents an interesting shift in behavior when comparing
annual data from 1995 to 2001 and from 2001 to 2010. As the analysis of implied migration is imperfect, secondary
sources of information are used to further review migration patterns.
Recent studies confirm that negative net migration has contributed to further population decline, becoming one of the
biggest challenges in the country. The International Labor Organization (ILO) estimated that between January 2010
and June 2012, 1.2 million people (or 3.4 percent of the population) were working or searching for employment abroad7
.
Additionally, according to the Ukrainian statistics bureau, in 2013 alone, 621,842 people left the country8
.
Labor migration from Ukraine is mostly of cyclical and seasonal character. According to the Modular Sample Survey on
Labor Migration in Ukraine 2013, the average duration of stay abroad for migrants on their most recent labor trip taken
was 5 months. Persons migrating to neighboring countries (Russia, Belarus, Poland, the Czech Republic, and Hungary)
generally undertake periodic short trips with a permanent return to Ukraine. However, those travelling to the South
European countries and Germany usually remain working there for longer periods of time.
Evidence suggests that most of the recent migration from Ukraine – prior to the current conflict – was to the countries
of the Commonwealth of Independent States (CIS) countries and the European Union (EU). For the 2010-2012 period,
the largest recipient countries were the Russian Federation (43.2 percent of Ukraine migrants), Poland (14.3 percent),
Italy (13.2 percent), and the Czech Republic (12.9 percent). Spain, Germany, Hungary, Portugal, and Belarus also received
significant influxes of migrants from Ukraine. Historically, there have been three distinct waves of migration from Ukraine:
in 1890-1914, before and after WWII, and after Ukraine became independent. The Ukrainian diaspora abroad can be
measured under different criteria of, one being the country of birth and country of nationality. Table 1 below presents the
distribution of the Ukrainian diaspora according to both criteria by the Migration Policy Center. According to the official
statistical institute of Ukraine, the following countries have the biggest stock of Ukrainians: the Russian Federation (1.93
million), Canada (1.2 million), the USA (893 thousand), Brazil (500 thousand), Kazakhstan (333 thousand), Moldova (477
thousand) and Argentina (250 thousand).
The vast majority of migrants in the wave of migration after Ukraine’s independence but prior to the conflict came from
oblasts located in the Western region (Figure 12 and Figure 13). According to the ILO’s 2012 Modular Sample Survey
on Migrations in Ukraine, in fact, 72 percent of migrants in the period of 2010-2012 were estimated to come from this
area. It is important to note that official statistics may underestimate the real flow of migrants, many of whom may
be illegal and undocumented. Specifically, the oblast with the highest migration rate was Zakarpattia, whose population
is relatively young and diverse, with large shares of Hungarians (12 percent), Romanians (2.6 percent), Russians (2.5
percent), and Slovaks (0.5 percent). This is also the oblast with the highest percentage of Gypsy population (1.1 percent),
whose mobility might add to the migration balance. The others regions contributed to a lesser extent to Ukraine’s out-
migration. Some patterns regarding migration destinations can be observed in the ILO sample; as expected, most of the
Eastern region’s migrants headed to Russia, while the Western region’s migrants had a greater variety of destinations.
Apart from Russia, Germany was a popular destination for migrants from the South, while nearby Poland attracted a
significant number of migrants from the Western region.
5 Implied migration is estimated as the residual after births and deaths are considered in population comparisons.
6 International Organization for Migration, Migration in Ukraine: Facts and Figures, 2011.
7 ILO, Modular Sample Survey on labor Migration in Ukraine (2013).
8 Ukrstat.org – “публикація документів Державної Служби Статистики України”
10
Ukraine_2015_nov26.indd 10 2015-11-26 5:14 PM
CHAPTER 1 The urban system: Demographics and Economic Trends
Table 1 – Ukrainian diaspora by country of residence (ca. 2012)
Source: : Migration Policy Center, Mpc - Migration Profile: Ukraine (2013)
Definition: Depending on the country of destination, Ukrainian migrants are classified by country of birth (A) orcountry of nationality
(B). As Russia reports numbers using both definitions, total estimations are used for Russia (A) and for (B).
Country of
residence
Definition Reference
date
Number
(Russia –A)
Number
(Russia – B)
%
(Russia-A)
%
(Russia B)
EU of which 1,052,184 19.7 53.3
Poland (A) 2012 227,446 4.3 12.2
Italy (A) 2012 201,830 3.8 10.8
Germany (B) 2012 153,393 2.9 8.2
CSI Countries
and Georgia
3,581,104 114,519 67.1 6.1
of which
Russia
(A) 2002 3,581,104 x 66.7 x
Russia (B) 2010 3,559,975 59,339 x 5.0
Belarus (B) 2009 16,874 0.3 0.9
Moldova (B) 2010 0.1 0.2
Other
countries of
which
702,551 13.2 37.6
US (A) 2011 352,793 6.6 18.8
Israel (A) 2005 258,793 4.9 13.8
Canada (A) 2006 59,460 1.1 3.2
TOTAL 5,335,840 1,869,255 100 100
11
Ukraine_2015_nov26.indd 11 2015-11-26 5:14 PM
CHAPTER 1 The urban system: Demographics and Economic Trends
Figure 12 – Migration is increasingly a factor in Ukraine’s population decline
Source: Authors’ analysis of data from Ukraine Statistics Department
Figure 13 – Labour migration rate by regions
Source: Authors’ analysis; ILO, Modular Sample Survey on Labor Migration in Ukraine (2012)
Population change
Deaths
Implied migration
Births
Thousandsperyear
2001-2011
600
400
200
0
-200
-400
-600
-800
-1000
Ukraine central western southern easthern
Population change
Deaths
Implied migration
Births
Thousandsperyear
1995-2001
600
400
200
0
-200
-400
-600
-800
-1000
Ukraine central western southern easthern
Volyn
Lviv
Ternopil
Zakarpat
Chernivtsi
Ivano-
Frankyvsk
Rivne
Zhytomyr
Chernihiv
Sumy
Cherkasy
Kirovohrad
Mykolaiv
Odessa
Kherson
Crimea
Sevastopol
Poltava Kharkiv
Luhansk
Donetsk
Dnipropetrovsk
Zaporizhzhia
Vinnytsya
Kyiv
Khmelnytskyi
KyivCity
RUSSIAN FEDERATION
BELARUS
ROMANIA
POLAND
MOLDOVA
Participation Rate
Population, Aged 15-70
Very High
Average
Low
Very Low
High
12
Ukraine_2015_nov26.indd 12 2015-11-26 5:14 PM
Total
(000)
Total
(%)
Total (thousands) Percentage by destination Percentage by origin
Central South East West Central South East West Central South East West
Russian Fed. 511 43.2 76,1 50,6 102,2 282,1 14.9 9.9 20.0 55.2 64.5 49.9 88.1 33.2
Poland 168,4 14.3 6,6 3,9 0,0 158,0 3.9 2.3 0.0 93.8 5.6 3.8 0.0 18.6
Italy 156 13.2 9,0 10,9 2,7 133,4 5.8 7.0 1.7 85.5 7.7 10.8 2.3 15.7
Czech Republic 153 12.9 10,3 0,0 0,0 142,7 6.7 0.0 0.0 93.3 8.7 0.0 0.0 16.8
Spain 52,6 4.5 1,3 10,0 0,0 41,3 2.5 19.0 0.0 78.5 1.1 9.9 0.0 4.9
Germany 27,8 2.4 2,0 11,8 4,5 9,5 7.2 42.4 16.2 34.2 1.7 11.6 3.9 1.1
Hungary 23 1.9 0,0 0,0 0,0 23,0 0.0 0.0 0.0 100.0 0.0 0.0 0.0 2.7
Portugal 21,7 1.8 9,1 0,0 0,0 12,6 41.9 0.0 0.0 58.1 7.7 0.0 0.0 1.5
Belarus 21,5 1.8 2,4 0,0 0,0 19,1 11.2 0.0 0.0 88.8 2.0 0.0 0.0 2.2
Other
Countries
46,6 3.9 1,3 14,1 6,7 29,1 2.8 30.3 14.4 62.5 1.1 13.9 5.8 3.4
TOTAL 1181,6 100 118,1 101,3 116,1 850,8 10.0 8.6 9.8 72.0 100.0 100.0 100.0 100.0
TheCzechRepublicandHungarywerethemainrecipientsofmigrantsfromZakarpattia.Thisisprimarilyduetogeographical
proximity. Further, the Western region’s ethnic specificity is a contributing factor – most Ukrainian Hungarians live there
– and Zakarpattia was historically part of the Austro-Hungarian Empire. Other western oblasts generated a large number
of migrants to Southern European countries such as Portugal, where in relative terms Ukrainians are the second biggest
immigrant group after Brazilians – with about 44 thousand migrants officially registered.
The profile of Ukraine’s migrants is diverse, but they are disproportionally young and approximately two-thirds of
emigrants are male. However, certain distinctions can be observed among the emigrant populations of the destination
countries. Some Southern European countries receive a larger share of women because of the demand for service-
oriented jobs in those countries, whereas the Russian Federation receives a higher share of migrant men because of the
demand for manual or mechanical jobs. Moreover, 45 percent of migrants are between 15 to 35 years of age, while this
age cohort comprised 29% of Ukraine’s total population, demonstrating an over-representation of young people among
Ukraine’s migrants. In addition, migrants’ origins were almost equally divided between rural (55 percent) and urban areas
(45 percent).
CHAPTER 1 The urban system: Demographics and Economic Trends
Table 2 – Between 2010 and 2012, migrants came mainly from Ukraine’s western region
Source: ILO, Modular Sample Survey on Labor Migration in Ukraine (2012)
13
Ukraine_2015_nov26.indd 13 2015-11-26 5:14 PM
Regarding the educational level of migrants, an ILO study9
concluded that for most European countries Ukrainian migrants
are more educated than the local labor. Nevertheless, most of Ukraine’s temporary migrants are from segments of the
Ukrainian population with lesser educational achievement (e.g., construction workers going to Russia as well as service
workers going to Southern Europe). By contrast, younger, highly-educated migrants are usually leaving permanently in
order to find better opportunities professionally and financially.
Figure 13 shows that higher labor migration rates were in the Western region in Ukraine between 2010 and 2012. An
analysis of the migration patterns since the conflict’s onset is provided in the Conclusion Section. An analysis of internal
labor migration patterns prior to the conflict has been included in Section 2 following the urbanization analysis.
Key messages and implications for further policy
and analytical work
Over the past two decades Ukraine’s population has been declining and aging. Over this period the country lost 13
percent of its population. The sharp decline in population was partly the result of out-migration but is also very much
linked to an overall aging trend of the population in the country and a significant decline in fertility. Fertility rates remain
very low and have been below replacement levels since 1990. Population dynamics differ across age cohorts, urban and
rural, and regions. The decline in the youngest cohorts, from 0 to 10 years, is much sharper – at 41 percent – than the
one observed in the 11 to 39 years old cohort. The youngest cohort is also declining more in urban areas than in rural
areas. On the contrary, the fastest growing segment of the population is the 60+ cohort living in urban areas, which
grew by 21 percent over the past two decades. Variation in population dynamics is also visible across regions, with the
Eastern region losing its youngest population at a faster rate than others. In terms of out-migration, the vast majority
of migrants – prior to the conflict – came from Oblasts located in the Western region; were disproportionately young
and to a large extent male. As will be discussed in subsequent sections, the overall population decline is leading to an
important decline of the population in the majority of urban centers in Ukraine, and even more dramatically since the
conflict started in 2014.
The overall decline and aging of the Ukrainian population poses important economic and urban development challenges
with implications in terms of fiscal policy and demand for public services. Overall labor participation might decline, as
older workers leave the labor force and become a larger share of the population. This aging may lead to a reduction of
tax revenues due to a diminishing workforce and lower private savings of workers, while it is also expected to lead to an
increase in demand for public expenditures related to healthcare, long-term care, and pensions. However, as argued in
the recent World Bank Study “The Golden Age of Aging”10
, an aging and declining population does not necessarily lead
to economic catastrophe as the demographics observed in the region may prove temporary in nature. For instance, a
reduction of the labor force can make more capital available to existing workers and lead to increased productivity. To
lessen the potential consequences of an aging population, the report recommends increasing the retirement age to better
reflect gains in life expectancy; focusing in policies that increase fertility to sustainable levels; reforming health and long-
term care systems to allow for healthier aging; and embracing migration as a part of the solution. Local governments
have a key role to play in this.
9 Ganna Vakhitova and Tom Coupe, The Relations between Education and Migration in Ukraine, International Labor Organization, 2014.
10 World Bank Group: The Golden Age of Aging, 2014.
CHAPTER 1 The urban system: Demographics and Economic Trends
14
Ukraine_2015_nov26.indd 14 2015-11-26 5:14 PM
Ukraine’s cities during the soviet period
Large-scale urbanization in Soviet Ukraine commenced only after 1945 and resulted from an increase in the demand for labor
by the country’s industries and a massive housing production initiative. In 1945 only 34 percent of the population of Ukraine
lived in urban areas and Ukraine was still predominantly rural. Rapid urbanization only came later and was caused by
an increase in the demand for labor in the industrial centers in the cities of Soviet Ukraine and a large campaign for the
construction of residential housing units driven by the housing reform of Nikita Khrushchev in the late 1950s. The growth
of the urban population throughout the USSR was mainly due to a large-scale migration of rural population to the cities.
In Ukraine, urbanization and industrialization went hand-in-hand; as the USSR restored infrastructure and factories
demolished in the war and built new one and workers started arriving from the central parts of Russia and from further
away in the USSR.
At the time, the majority of Ukraine’s population lived in multi-family apartments, hostels, or barracks, and the drive
for single-family dwellings with all basic amenities became an important national policy in the 1950s-1960s. Urban
development policies were strongly linked to the decision to expand housing construction. The industrialization and
standardization of housing construction made it possible to rapidly increase the supply of housing and played an elemental
role in the growth of Ukrainian cities. The idea of simple and utilitarian blocks of flats came to the USSR from Germany
and the US, where pre-fabricated construction took off in the 1930s and expanded significantly immediately after WWII
(e.g., Concept of Plattenbau in Germany). New buildings were produced in factories using panel construction that could
then be assembled on site. It was estimated that more buildings were built in Ukraine from 1956 to 1964 than in the
previous 38 years of Soviet rule12
.
Urban development at the time was viewed through the perspective of achieving higher socio-economic equity across
Ukraine’s cities. The 22nd
Communist Congress held in 1961 outlined a roadmap, which aimed to eliminate disparities in
social infrastructure between cities and villages. However, officials were also instructed to avoid an excessive concentration
of population in big cities, to promote the development of small cities and towns, and to transform farm villages into
bigger town-like settlements. The optimal size for a city in terms of population was considered to be between 20,000
and 300,000 inhabitants13
. The national policy was also influenced by meager per capita size of the housing stock, which
was around 4-5 m2
in cities like Moscow or Kyiv.
Going forward, as cities shrink, local authorities will need to re-assess how infrastructure is planned and maintained, and
the way services are financed and delivered. Neighborhoods may need to be consolidated as cities lose density. Public
service plans, designed for a larger population, may have to be re-considered to address lower demand. In addition, an
aging urban population has consequences for the demand for and type of housing (e.g., long-term care facilities), the
demand for public transportation (as elderly tend to commute less and have different design needs), and other basic
services. The combination of an overall aging urban population and declining fertility rates will also likely shift demand
from education to health services. Urban areas will, therefore, need to adapt their social and material infrastructure to
better serve the changing needs and demands of their population.
II. Urbanization and the Urban System11
11 In providing a regional overview of the country, this document uses the description of four geographic regions developed by the Kiev
International Institute of Sociology: East, Center, South, and West.
12 Yaroslav Hyrych, “Urbanization According to Plan,” The Ukrainian Week, 26 September 2012, available at http://ukrainianweek.com/
History/60924 .
13 Urban Development Institute under the Academy for Construction and Architecture of Ukrainian SSR (1950).
CHAPTER 1 The urban system: Demographics and Economic Trends
15
Ukraine_2015_nov26.indd 15 2015-11-26 5:14 PM
The emergence and later obsolescence of Ukraine’s cities was facilitated by the Soviet command-administrative system.
Between 1956 and 1965 the number of cities increased substantially due in part to legal changes that allowed Oblast
councils to grant city status to settlements – a power previously limited to Ukraine’s central government (or Verkhovna
Rada). While in 1946 Ukraine urban system was composed of 258 cities, by 1959 the number had grown to 331 and by
1970 to 385. Uzhhorod, for example, was a town that had only 17,000 inhabitants at the war’s end, but experienced a
population increase when it was granted oblast center status (in 1946) and a university opened there. By 1989, it counted
more than 100,000 inhabitants. By contrast, settlements that lost their “city” status eventually declined.
Cities in the post-war era were developed around a core industry and guided by industrialization policies. The majority of these cities
emerged in priority industrial areas identified and established by the central Government such as Donetsk, Luhansk,
and Dnipropetrovsk oblasts and along the Black Sea coast. These policies produced flourishing, mono-functional cities14
,
where the majority of the population was employed by one or few inter-connected industries and the city’s economy was
fully dependent on them. A more detailed review of the mono-functional cities system is described in Box 1 below.
14 Law on the Approval of the National Programme of Development of Small Cities # 1580-IV approved on 04.03.2004 (in Ukrainian) - http://
zakon2.rada.gov.ua/laws/show/1580-15
The term mono-functional city or mono-town refers to a city whose economic performance and employment is
highly dependent on one or few industries. In Ukraine, this term is defined in law as cities where the employment
of economically active population works in enterprises mainly focused on one or two main economic sectors that
also support a substantial part of the city’s budget and social infrastructure.
At present, there are 111 mono-functional cities in Ukraine: 32 are focused on coal extraction, 27 on the
processing industry, 18 are agricultural centers, nine are focused on transport and nine on power engineering,
seven focused on production of ore and non-metallic resources, six on chemicals and the oil refining industry, two
on therapeutics, and one on art.
The Donetsk oblast counts with the highest number of mono-functional cities with 27 of them. This is partly
explained by the decision to have eastern Soviet Ukraine specialize as a region in coal-mining, metallurgy, heavy
machinery, chemicals, etc., based on the abundance of natural resources found in the Eastern Region. A mono-
functional city approach was extensively used in the period of the centrally-planned economy as the instrument
for implementing industrialization and the territory management policy, which was heavily oriented towards large-
scale industry and its accompanying infrastructure. During the 1950s-1970s, the narrow industrial specialization
of individual cities combined with large-scale infrastructure and intensive transport flows were features of the
paradigm of ‘territorial industrial complexes’ implemented throughout the USSR.
Due to the heritage of this narrow economic specialization, mono-functional cities are highly vulnerable to the
economic changes that have occurred in the country since the post-Soviet era. For example in the Donetsk and
Lugansk oblasts, the economic performance of these cities is highly dependent on the status of the region’s
mineral reserves, the degree of their industrial development, and the competitiveness of enriched raw materials
extracted by local enterprises. It is also dependent on the ability of new private owners to manage local enterprises
in a way that enhances their competitiveness. Many of these cities, which are dependent on the coal mining
industry, struggled to find new economic growth following the massive industry restructuring and closure of
enterprises due to their low level of competitiveness in the post-Soviet era.
Source: L.M. Kuzmenko, M.O. Soldak, Mono-functional cities: Problems, support provision and development, 2010.
CHAPTER 1 The urban system: Demographics and Economic Trends
BOX 1 – MONO-FUNCTIONAL CITIES SYSTEM
16
Ukraine_2015_nov26.indd 16 2015-11-26 5:14 PM
15 Paul R. Magocsi, A History of Ukraine: The Land and Its Peoples, 2nd ed., 2010.
Ukraine’s major urban agglomerations emerged between 1957 and 1979. The city of Kyiv hit the one million-inhabitant
mark in 1957, followed by Kharkiv in 1962 and Odessa in 1974. By 1976, Kyiv had already two million inhabitants, and
by 1979, Dnipropetrovsk and Donetsk counted more than a million residents. Urbanization was rapid; while in 1959,
Soviet Ukraine had only 25 cities with more than 100,000 inhabitants, by 1979 it had 46 such cities15
. At the same
time, internal migration was very restricted by regulations such as the “propiska” system, (name of the registration
system during soviet times, a brief review is included in Box 2) which made it very difficult for residents of the former
Soviet Union to move within the country. Internal migration policies were relaxed only after the country entered the
post-Soviet transition. Between 1935 and 1974 there was a de facto ban on mobility of rural inhabitants. Only in 1974
were residents of collective farms that had the name of kolkhoz able to obtain passports. Prior to that date, they had
no national documents and could not leave their place of residence without fear of criminal prosecution.
One of the main restrictions for internal mobility in Ukraine was the propiska system, (the registration system in
the Soviet countries) developed in the 1930s to serve as both a residency permit and a tool to monitor migration
in the Soviet Union. The name propiska literally means an inscription and in this case, alludes to the inscription
in a state internal passport permitting a person to reside in a given place. Propiska was documented in local
police (Militsiya) registers and certified by a stamp made on internal passports. Official permission from local
authorities was required to register one’s residence or change of residence; residing anywhere without a propiska
was prohibited until the collapse of the USSR.
Beginning in 1933, an additional feature of the propiska system was the existence of separate passports
for residents of the so-called “regime” places, which were settlements where it was practically impossible for
an outsider to receive a passport and, therefore, the required propiska. The state authorities exercised full
control over the issuance of passports and propiska in this places. The first “regime” places were Kyiv, Odessa,
Dnipropetrovsk, and Donetsk (then known as Stalino). Later on, other cities were added. By 1953, there were 340
“regime” cities, locations, and railway connections.
Ukraine officially discontinued the institution of propiska with the adoption of a new regulation on identification
documents on September 2, 1993. However, in practice there was little difference between the old Soviet system
of propiska and the newly-adopted regulation system. In 2004, after years of debate, the Law on the Right to
Freedom of Movement and Choice of Place of Residence came into effect replacing the old registry system. Human
rights groups stressed that a major difference between the propiska system and the new system of registration,
which is required by law, is that a person may live, work, and receive services anywhere in the country. The
rationale for the law was not based on denial of services; there was no indication that individuals were denied
access to services because they were not registered in the locality where they resided. However, the new system
still has some rigidities that makes it difficult to “de-register” when selling property and “register” while buying
new property (buyers need to present proof of prospective place of residence while receiving certificate of “de-
registration” from the old residence, which is not always feasible).
Sources: Immigration and Refugee Board of Canada, Ukraine: Information on whether the residence permit (propiska)
system still exists, 1992; Court Abolishes Propiska Law, Kyiv Post, 29 November 2001, available at http://www.kyivpost.
com/content/ukraine/court-abolishes-propiska-law.html; Evgenija Navrotskaja, Roma and propiska in Ukraine, 3 April 1999,
available at http://www.errc.org/article/roma-and-propiska-in-ukraine/593; Immigration and Refugee Board of Canada,
Responses to Information Requests: UKR42598.E, available at http://www.irb-cisr.gc.ca/Eng/ResRec/RirRdi/Pages/index.
aspx?doc=445385; United Kingdom, Home Office, Country of Origin Information Service, Country of Origin Information
Report: Ukraine, available at http://www.justice.gov/eoir/vll/country/uk_cntry_assess/2006/ukraine0606.pdf
CHAPTER 1 The urban system: Demographics and Economic Trends
BOX 2 – EVOLUTION OF THE PROPISKA SYSTEM
17
Ukraine_2015_nov26.indd 17 2015-11-26 5:14 PM
Ukraine’s system of cities was developed during the Soviet period; as such, their emergence and growth was developed in
a centralized way and was not based on market principles. The demand and supply of housing and other resources and
services was rigid and highly regulated. The dominant approach was development based on economy of scale, narrow
specialization of individual industrial cities, and extensive co-operation among cities and their metropolitan areas. The
territory of the USSR was divided into economic macro-regions hosting a limited number of specialized industrial cities
that would have self-sufficient industries and infrastructure (electricity, water, roads, etc.). With the fall of the Soviet
Union and the introduction of market forces, it became evident that, from a spatial point of view, many of its cities had
been developed in places where they should not have been. For example, many cities had no rural hinterland to rely on
for daily food needs and therefore depended on the supply of subsidized goods. Further, many of the industrial cities in
the Eastern Region were highly dependent on raw materials and subsidized energy provided by other Soviet Republics
were not competitive internationally once borders were opened. Mono-functional cities, which depended economically on
a single or a few industries, were particularly vulnerable to this.
While the fall of the Soviet Union brought the opportunity to move towards a more efficient settlement system, policies implemented
during the transition period re-enforced barriers for internal mobility within Ukraine. During that period, ownership of dwellings
was transferred to the occupants with little or no cost, resulting in a high home-ownership rate—occupants owned 95
percent of households in 2012, according to a World Bank estimate16
. Ukraine’s internal migration and urbanization
process and the reorganization of Ukraine’s urban system will be examined in the following sub-sections.
Ukraine’s people do not always move to economic
opportunity
Migration to and between urban areas is an indication that people are looking for better labor opportunities, and is a sign of an
efficient re-organization of human resources within a country. Achieving economic growth and improving living standards
require connecting or bringing people from places that are lagging or declining to places with economic opportunities17
,
an essential element to promote Ukraine’s development.
The most notable characteristic of internal migration after the collapse of the Soviet Union is a decrease in the volume of movement.
However, a caveat is necessary when comparing internal migration in the USSR and subsequent internal migration in
Ukraine, especially in the first several years after independence. The termination of the obligatory practice of distributing
higher educational institutions’ graduates across the USSR, as well as the broader economic troubles of the 1990s
(unemployment, high housing prices, restriction of access to higher education due to high cost, increases in transport
tariffs, etc.), led to a decrease in the number of internal migrants. In addition, there was a surge in external migration,
mainly due to the relocation of people between the republics of the former Union, which was only recently classified as
internal migration. After the mid-1990s, the country’s economic performance improved and internal migration increased
slightly18
. A final caveat to consider about migration data is that official statistics might not show the entire picture of
internal migration, as many people remained outside the radar of registration but moved through the country.
Recent studies of internal migration in Ukraine reveal that few people are moving to seek new economic opportunities. A
2012 World Bank report on that theme shows that Ukraine migrants are not leaving areas with lagging labor opportunities
16 World Bank, In Search of Opportunities: How a More Mobile Workforce Can Propel Ukraine’s Prosperity, 2012, available at https://
openknowledge.worldbank.org/bitstream/handle/10986/12268/NonAsciiFileName0.pdf?sequence=1
17 The World Bank’s World Development Report 2009: Reshaping Economic Geography provides an extensive policy oriented discussion about
the aspects that make urban conditions optimal for the increase of productivity.
18 European Commission and GVG, Social Impact of Emigration and Rural-Urban Migration in Central and Eastern Europe, Final Country
Report: Ukraine, 2012, available at ec.europa.eu/social/BlobServlet?docId=8820langId=en
CHAPTER 1 The urban system: Demographics and Economic Trends
18
Ukraine_2015_nov26.indd 18 2015-11-26 5:14 PM
as fast as they should19
, and that they are not necessarily going to regions with better job conditions. Instead, their
movement seems to be catalyzed by low levels of social spending in their home regions20
. The study suggests that
the internal migration rate is half of what might be expected from a country like Ukraine. In addition, an ILO study of
migrants in 2013 found that those who are moving are predominantly male and young; although they make up only 22
percent of the population, migrants aged 15-29 years comprised over 50 percent of internal migrants that year21
.
In Ukraine, migrants are predominantly from the age cohort of 15-29 years. The number of people who have higher
education in Ukraine is relatively high and migration to the main education centers of Kyiv, Kharkiv, Lviv, Odessa,
and Donetsk is common as well as to several dozen smaller centers. These young educated people tend to stay in the
big centers as they are attracted by bigger labor market and better opportunities. Further, as there is little support
infrastructure for entrepreneurs beyond the large cities, it is easier to work in these centers with the minimum set of
support instruments. The 2010 Housing Market and Labor Mobility study describes the average renter of accommodation
in Ukraine as someone in their 20-30s, with one or fewer children, and an average salary of about 1200 USD. By contrast,
people with families and generational obligations are more static, and in even more so in inter-generational settings,
where earners take care of not only children but also elderly relatives.
Some of the main barriers to internal migration in Ukraine are: (i) the lack of access to credit and underdevelopment of
the housing and mortgage market; (ii) the costs of moving to economically vibrant regions in the country; and (iii) the
high transaction costs of moving. First, there are poor financial options and access to credit necessary to encourage
internal labor migration. Well-functioning credit markets can help finance mobility and housing arrangements, but in
Ukraine they are underdeveloped, leading to high out-of-pocket payments from households’ savings or borrowing from
relatives, friends, or informal intermediaries to cover the costs of migration from one place to another22
. Second, there is
a very limited rental market as well as significant price differentials across the regions of Ukraine, with considerably more
expensive housing in the leading regions than in the lagging regions. This makes it difficult for people in lagging regions
(e.g., Zaporizhzhya and Zakarpatska oblasts) to sell their houses and move to areas with improved job opportunities, but
with higher housing costs23
. Lastly, while the propiska registration process (described in detail in Box 2) was reformed in
2004, it is still difficult to obtain residency for migrants in their new destination.
Ukraine continues to urbanize despite its population
decline
The limited internal movement is reflected in a continued but more or less static “urbanization” of the population. In fact, despite its
rapid population decline, Ukraine continues to slowly “urbanize.”24
As discussed in the demographics section, both urban
and rural populations have decreased over the past two decades. However, population decline has been higher in rural
areas, which has caused urbanization levels to continue to slowly increase (see Figure 14 below). We need to distinguish
between the level of urbanization and the share of population living in the cities, since this last one is the passive number
which depends on the whole number of population, which is the case for Ukraine.
CHAPTER 1 The urban system: Demographics and Economic Trends
19 Based on the concept of efficient mobility of people for development.
20 In Search of Opportunities, 2012.
21 International Labour Organization, Report on the methodology, organization and results of a modular sample survey on labour migration
in Ukraine, 2013.
22 Koettl, J., et. al., In Search of Opportunities? The Barriers to More Efficient Internal Labor Mobility in Ukraine, Institute for the Study of
Labor, 2014.
23 As examples, leading regions include Kiev and Donetsk (before the conflict), while lagging regions include Zaporizhzhya and Uzhgorod.
19
Ukraine_2015_nov26.indd 19 2015-11-26 5:14 PM
24 Usually, urbanization is understood as growth in the urban population, which causes an increase in the urban/rural population ratio. In the
case of declining population, like the case of Ukraine, urbanization can be understood as the increase of the urban/rural population ratio despite
the decline of both urban and rural population—so long as the rural population is declining faster.
CHAPTER 1 The urban system: Demographics and Economic Trends
Figure 14 – Both urban and rural populations declined between 1989 and 2011;
yet the country continues to urbanize
Source: Ukraine Statistics Department
However, there are some differences in urbanization trends among the regions over the past two decades (see Figure 16). The Eastern
and Southern regions were already highly urbanized in 1989 – with 84 percent and 70 percent of their populations living
in urban areas respectively. These regions maintained a more or less stable urbanization level over the 1989-2011 period
as their urban populations declined at similar rates as their rural populations (See Figure 15). The Central and Western
regions were the least urbanized in 1989 with 60 and 45 percent of their populations living in urban areas respectively.
However, the Western region’s urbanization levels remained more or less stable, while the Central region continued to
slowly urbanize reaching 67 percent urbanization by 2011 (by contrast, the Western region shows the lowest urbanization
level of all regions in 2011 at 49 percent). This was possible because the Central region’s urban population remained more
or less stable as its rural population continued to decline.
Urban Population
Urbanization
Rural Population
Population(millions)
Urbanization%
50
40
30
20
10
80
70
60
50
1990 1995 2000 2005 2010
Urbanization trends in Ukraine
1989-2011
In 1989, 66 percent of Ukraine’s population lived in urban areas. Between 1989 and 2001, the rural population decreased from
17 million to 16 million (a 6 percent decline), while the urban population fell from 34 million to 33 million (a 4 percent
decline). The interaction of these dynamics resulted in an increase of 1 percent in Ukraine’s urbanization to 67 percent
in 2001. Between 2001 and 2011, the rural population further dropped to 14 million (a 10 percent decline), while the
urban population itself fell further to 31 million (a 4 percent decline). As a result, in 2011 the urbanization level rose to
68 percent. On average, this shows a steady growth of urbanization levels of approximately 0.15 percent per year since
1989.
20
Ukraine_2015_nov26.indd 20 2015-11-26 5:14 PM
CHAPTER 1 The urban system: Demographics and Economic Trends
Figure 15 – There are strong differences among urbanization levels across the regions
Figure 16 – Population dynamics are heterogeneous across Ukraine’s regions. In all cases, however,
population declines yield increased urbanization rates
Source: Ukraine Statistics Department
Population(millions)
Urbanization%
Western Eastern
Central Southern
15
10
5
0
80
60
40
20
0
80
60
40
20
0
15
10
5
0
1990 19901995 19952000 20002005 20052010 2010
Urban Population
Urbanization
Rural Population
Western Eastern
Central Southern
0
-.5
-1
-1.5
70
50
70
50
0
-.5
-1
-1.5
Urbanizationrate(%)
%change
2000 20002011 2011
Urban pop change
Rural pop change
Total pop change
Urbanization
Graphs by region
21
Ukraine_2015_nov26.indd 21 2015-11-26 5:14 PM
CHAPTER 1 The urban system: Demographics and Economic Trends
A slowly evolving system of cities
Ukraine has 458 cities25
that serve as the urban element of basis for an analysis of Ukraine’s settlement system. As
previously mentioned, of these, Kyiv and Sevastopol until 2013, had the same administrative status as the other 24
Oblasts; 182 are cities of Oblast significance, which have the same autonomy as Raions; and 276 cities are subordinated
to Raions. Figure 17 below presents the spatial distribution of Ukraine’s cities and their population in 2013.
Ukraine is much more densely urban in the Eastern region, which has a significant number of cities concentrated near the
Russian border (see Figure 17). By contrast, the density of cities is much lower in the Western region, which also has a
large number of small towns (less than 10,000 inhabitants). This is partly a reflection of the lower levels of urbanization
of the Western region as well as the high levels of urbanization found in the Eastern region (as discussed in the previous
sub-section). The Southern region has a significant number of cities with population between 50,000 and 100,000 as
well as fewer smaller cities.
25 Two additional cities, Chernobyl and Pripyat, are not considered as part of the urban system as they have been abandoned due to radiation
contamination in the aftermath of the accident at the Chernobyl nuclear power station in 1986.
Figure 17 – Distribution of cities across Ukraine
Source: Ukraine Statistics Department
City Population, 2013
Population
Estimated, 2013
0 - 10,000
10,001 - 20,000
20,001 - 50,000
50,001 - 100,000
100,001 - 500,000
500,000
22
Ukraine_2015_nov26.indd 22 2015-11-26 5:14 PM
CHAPTER 1 The urban system: Demographics and Economic Trends
While most Ukrainian cities have less than 20,000 inhabitants, the majority of the urban population26
lives in cities having more
than 100,000 inhabitants (see Figure 18 and Figure 19). In fact, some 34 percent of the urban population is concentrated in
just eight urban centers (Kyiv, Kharkiv, Odessa, Dnipropetrovsk, Donetsk, Zaporizhzhia, Lviv, and Kryvyi Rih). Moreover,
if the population living in the functional urban area of these eight cities were counted, it would comprise an even larger
percentage of Ukraine’s urban population (62 percent), as each of these urban centers is at the core of significant urban
agglomerations.
26 For this analysis, the urban population is the population located in the 458 cities identified in the Ukrainian urban system.
27 TIn this case larger than what would be indicated by a Zipf law. See Gabaix, X. Zipf’s Laws for Cities: An Explanation, The Quarterly Journal
of Economics, 1999.
Figure 18 – Ukraine has a high percentage of small and mid-sized towns 2013
Figure 19 – Most of the urban population is concentrated in eight major cities 2013
Source: Ukraine Statistics Department
The Western region has many small towns with less than 10,000 inhabitants (Figure 20), but most of the urban population lives in
mid-sized cities. In the other three regions, major urban centers account for a larger amount of the urban population as
they have a large number of mid-sized and large cities. Table 3 shows the five largest urban centers for each region. The
Western and Central regions show a pattern where one city comprises a much larger percentage of the population than
the next four largest of the region’s cities27
. A similar pattern is observed in the Eastern and Southern regions, but here
the difference between the largest and the following cities is smaller.
2%
15%
35%
27%
12%
9%
Small towns (10k)
Mid-size towns (10k-20k)
Large towns (20k-50k)
Small cities (50k-100k)
Mid-size cities (100k-500k)
Major cities (500k)
Small towns (10k)
Mid-size towns (10k-20k)
Large towns (20k-50k)
Small cities (50k-100k)
Mid-size cities (100k-500k)
Major cities (500k)
Percentage of cities in each category
Population in each category
2%
8%
34% 13%
11%
32%
23
Ukraine_2015_nov26.indd 23 2015-11-26 5:14 PM
Oblast City Population 2013 Region
Percentage of region’s
population
Lviv Lviv 730272 Western 16.0
Khmelnytskyi Khmelnytskyi 264988 Western 5.8
Chernivtsi Chernivtsi 258842 Western 5.6
Rivne Rivne 250333 Western 5.4
Ivano-Frankivsk Ivano-Frankivsk 226018 Western 4.9
Kharkiv Kharkiv 1451028 Eastern 20.6
Donetsk Donetsk 953217 Eastern 13.5
Donetsk Mariupol 461810 Eastern 6.5
Lugansk Lugansk 425848 Eastern 6.0
Donetsk Makiivka 353918 Eastern 5.0
Kyiv Kyiv 2757900 Central 34.0
Vinnytsia Vinnytsia 371698 Central 4.5
Poltava Poltava 296852 Central 3.6
Chernihiv Chernihiv 296089 Central 3.6
Cherkasy Cherkasy 285605 Central 3.5
Odessa Odessa 1014852 Southern 13.1
Dnipropetrovsk Dnipropetrovsk 997754 Southern 12.8
Zaporizhzhia Zaporizhzhia 770672 Southern 9.9
Dnipropetrovsk Kryvyj Rih 656478 Southern 8.4
Mykolaiv Mykolaiv 496188 Southern 6.4
CHAPTER 1 The urban system: Demographics and Economic Trends
Table 3 – Five largest urban centers in each region by population in 2013
Source: Ukraine Statistics Department
24
Ukraine_2015_nov26.indd 24 2015-11-26 5:14 PM
CHAPTER 1 The urban system: Demographics and Economic Trends
Figure 20 – The Western region has the greatest number of small towns. Also, its urban population
lives mostly in mid-sized cities (100-500k)
Source: Ukraine Statistics Department
Small towns (10k)
Mid-size towns (10k-20k)
Large towns (20k-50k)
Small cities (50k-100k)
Mid-size cities (100k-500k)
Major cities (500k)
Small towns (10k)
Mid-size towns (10k-20k)
Large towns (20k-50k)
Small cities (50k-100k)
Mid-size cities (100k-500k)
Major cities (500k)
Percentage of cities
in each category
Percentage of population
in each category
100%
90%
80%
70%
60%
50%
40%
30%
20%
10%
0%
100%
90%
80%
70%
60%
50%
40%
30%
20%
10%
0%
Western
Western
Eastern
Eastern
Central
Central
Southern
Southern
Ukraine
Ukraine
25
Ukraine_2015_nov26.indd 25 2015-11-26 5:14 PM
Between 1989 and 2001, Ukrainian cities in all size categories saw a significant decline in their population, on average 6.3 percent of
their population (See Figure 21). Small cities – having a population between 50,000 and 100,000 in 1989, were the most
affected category over the 1989 – 2001 period, losing on average 7.4 percent of their population. Over this period, mid-
sized cities with populations of 100,000-500,000 inhabitants fared better, losing less population than any of the other
categories.
Over the subsequent 2001-2013 period, cities continued to lose population at more or less same rate, although the situation was
worse for Smaller Cities. Also, over this period more Small Towns were shrinking and the category as a whole was losing
population at a higher rate than the average across the urban system with 75 percent of small towns losing population.
Mid-size towns also experienced greater declines than the urban system average.
On average, Major Cities did better than Small Cities or Small Towns, but the situation was mixed when looking at individual cities.
In fact, when limiting the analysis to administrative divisions, among the 15 largest cities only Kyiv, Sevastopol, and
Vinnytsia grew over the last decade. Among large cities, Kyiv consolidated itself as the country’ growth center, and
remains the main recipient of the cross-regional exchange of population. For Kyiv, the inflow of migrants provides enough
of an increase in population to compensate for natural population decline. Population growth due to internal migration
can also be observed in the largest industrial regions of Ukraine (Kharkiv and Dnipropetrovsk Oblasts)28
.
Kyiv Oblast and the neighboring Chernihiv and Zhytomyr Oblasts are the main suppliers of labor migrants to Kyiv city. Odesa
oblast, known for its opportunities in seasonal employment in both agriculture and recreational spheres, also attracts
a significant number of internal labor migrants. Among other regions supplying labor migrants (beside Kyiv, Chernihiv,
and Zhytomyr oblasts supplying labor migrants for the capital), Ivano-Frankivsk Oblast yields a significant number of
migrants for work in Lviv and Kyiv29
.
Relative to the population patterns observed in individual cities, agglomerations30
fared much better. The largest agglomeration,
formed around Kyiv, has grown steadily since 1989, so that it is the largest urban center in Ukraine. It is also the
fastest growing one, with total population growth of 7.2 percent between 2001 and 2013. Tables 4 and 5 contrast
the performance of the 15 largest individual cities in Ukraine, where three registered growth, and the 15 largest urban
agglomerations, where six had positive population growth in the last decade.
Even more important, if we look at all the cities in the country, individual cities that showed positive population growth are, in
a significant majority of cases, cities that are part of a larger agglomeration - either as centers themselves or as part of an
agglomeration’s periphery. When ranked by order of population growth between 2001 and 2013 (see Table 6), eleven out of
the fifteen fastest growing cities in the country were part of an agglomeration.
28 European Commission and GVG, Synthesis Report: Social Impact of Emigration and Rural-Urban Migration in Central and Eastern Europe,
VT/2010/001, June 2012.
29 European Commission and GVG, Synthesis Report: Social Impact of Emigration and Rural-Urban Migration in Central and Eastern Europe,
VT/2010/001, June 2012.
30 Agglomerations are defined using Night Lights data and are formed by cities that in 2013 had a merged Night Lights urban footprint. See
Box 3 and the subsequent discussion in Section 4.
CHAPTER 1 The urban system: Demographics and Economic Trends
26
Ukraine_2015_nov26.indd 26 2015-11-26 5:14 PM
CHAPTER 1 The urban system: Demographics and Economic Trends
Figure 21 – All categories of cities in Ukraine are losing population
Source: Ukraine Statistics Department
Small towns (10k)
Mid-size towns (10k-20k)
Large towns (20k-50k)
Small cities (50k-100k)
Mid-size cities (100k-500k)
Major cities (500k)
Average loss over the
cities
Small towns (10k)
Mid-size towns (10k-20k)
Large towns (20k-50k)
Small cities (50k-100k)
Mid-size cities (100k-500k)
Major cities (500k)
0.0
-1.0
-2.0
-3.0
-4.0
-5.0
-6.0
-7.0
-8.0
1989-2001
1989-2001
2001-2013
2001-2013
Average population
growth (decline)
Percentage of cities
losing population
100%
90%
80%
70%
60%
50%
40%
30%
20%
10%
0%
27
Ukraine_2015_nov26.indd 27 2015-11-26 5:14 PM
CHAPTER 1 The urban system: Demographics and Economic Trends
Agglomerations are groupings of individual cities that function as a single city due to the proximity of
and interaction between their housing, labor and commercial markets. People might work in one city in the
agglomeration and live in another one. These cities usually have separate geographic and political boundaries
and had their markets initially separate as well, but they became agglomerated as the cities grew. Satellite night
lights can be used to trace the evolution of urban ‘footprints,’ which may merge and form an agglomeration (see
Section 4 below). In total, Ukraine has 23 agglomerations that are composed of 79 cities, approximately four
cities per agglomeration. The figure below presents Kyiv’s agglomeration and the growth of its night light urban
footprint between 1996 and 2010. Some of the cities separate from Kyiv in 1996 have grown to become a single
urban footprint in 2010.
Figure – Kyiv urban agglomeration (between 1996 and 2010)
BOX 3 – DEFINITION OF AGGLOMERATION USING NIGHT LIGHTS SATELLITE IMAGING
01 2.5 25 75 100
Kilometers
1996
2010
Chernihiv
28
Ukraine_2015_nov26.indd 28 2015-11-26 5:14 PM
CHAPTER 1 The urban system: Demographics and Economic Trends
City
Rank
2013
Rank
1989
Population
1989
Population
2013 e
Change
1989-2001
Change
2001-2013
Oblast Region
Kyiv 1 1 2,572,212 2,757,900 -0.2 7.4 Kyiv Central
Kharkiv 2 2 1,609,959 1,451,028 -8.6 -1.4 Kharkiv Eastern
Odessa 3 4 1,115,371 1,014,852 -7.7 -1.4 Odessa Southern
Dnipropetrovsk 4 3 1,215,941 997,754 -9.2 -9.6 Dnipropetrovsk Southern
Donetsk 5 5 1,109,102 953,217 -8.4 -6.2 Donetsk Eastern
Zaporizhzhia 6 6 883,909 770,672 -7.5 -5.8 Zaporizhzhia Southern
Lviv 7 7 790,908 730,272 -7.3 -0.3 Lviv Western
Kryvyj Rih 8 8 739,139 656,478 -7.2 -4.3 Dnipropetrovsk Southern
Mykolaiv 9 9 522,343 496,188 -1.6 -3.5 Mykolaiv Southern
Mariupol 10 10 518,933 461,810 -5.2 -6.2 Donetsk Eastern
Lugansk 11 11 496,813 425,848 -6.8 -8.0 Lugansk Eastern
Vinnytsia 12 13 374,304 371,698 -4.7 4.2 Vinnytsia Central
Makiivka 13 12 430,201 353,918 -9.4 -9.2 Donetsk Eastern
Sevastopol 14 14 356,123 342,580 -3.8 0.0 Sevastopol Southern
Simpheropol 15 16 343,565 337,285 0.0 -1.9 Crimea Southern
Table 4 – Ranking of Ukraine’s 15 largest cities by population
Source: Ukraine Statistics Department
29
Ukraine_2015_nov26.indd 29 2015-11-26 5:14 PM
Agglomeration
Rank
2013
Rank
1989
Population
1989
Population
2013
Change
1989-2001
Change
2001-2013
Oblast Region
#
Cities
Kyiv 1 1 2946438 3171833 0.5% 7.2% Kyiv Central 11
Kharkiv 2 2 1818712 1620927 -8.8% -2.2% Kharkiv Eastern 7
Donetsk 3 3 1783774 1506202 -8.9% -7.3% Donetsk Eastern 8
Dnipropetrovsk 4 4 1648499 1369202 -9.2% -8.5% Dnipropetrovsk Southern 4
Odessa 5 5 1170209 1074570 -7.4% -0.8% Odessa Southern 2
Lviv 6 6 821698 765901 -6.9% 0.2% Lviv Western 4
Alchevsk 7 8 479787 447975 -1.3% -5.4% Lugansk Eastern 3
Lugansk 8 7 504538 432483 -6.8% -8.0% Lugansk Eastern 2
Sevastopol 9 10 368565 354565 -4.2% 0.4% Sevastopol Southern 2
Gorlivka 10 9 479181 353497 -13.6% -14.6% Donetsk Eastern 3
Cherkasy 11 13 310702 303168 1.6% -3.9% Cherkasy Central 2
Kramatorsk 12 11 359593 297665 -8.4% -9.6% Donetsk Eastern 4
Sieverodonetsk 13 12 343124 281903 -9.8% -8.9% Lugansk Eastern 4
Rivne 14 14 255523 274902 7.0% 0.5% Rivne Western 2
Ivano-Frankivsk 15 15 223660 235515 2.0% 3.2% Ivano-Frankivsk Western 2
City
Population
2001
Population
2013
Change
2001-2013
Oblast Region
Belongs to an
agglomeration
Agglomeration
Dubliany 8469 10240 20.9 % Lviv Western YES Lviv
Vynnyky 13654 16278 19.2 % Lviv Western YES Lviv
Vyshhorod 22933 26536 15.7 % Kyiv Central YES Kyiv
Teplodar 8830 10204 15.6 % Odessa Southern NO
Novyi Kalyniv 3582 4105 14.6 % Lviv Western NO
Brovary 86839 98250 13.1 % Kyiv Central YES Kyiv
Inkerman 10628 11985 12.8 % Sevastopol Southern YES Sevastopol
Ukrainka 14163 15644 10.5 % Kyiv Central YES Kyiv
Boryspil 53975 59545 10.3 % Kyiv Central YES Kyiv
Illichivsk 54151 59718 10.3 % Odessa Southern YES Odessa
Rudky 4942 5434 10.0 % Lviv Western NO
Pidhorodne 17763 19498 9.8 % Dnipropetrovsk Southern YES Dnipropetrovsk
Vyshneve 34465 37457 8.7 % Kyiv Central YES Kyiv
Kyiv 2570000 2757900 7.3 % Kyiv Central YES Kyiv
CHAPTER 1 The urban system: Demographics and Economic Trends
Table 5 – Ranking of Ukraine’s largest urban agglomerations
Source: Ukraine Statistics Department
Table 6 – Ranking of the fastest growing cities in Ukraine
30
Ukraine_2015_nov26.indd 30 2015-11-26 5:14 PM
Percent Change in Population, 2001-2013
Percent Change
by city
Declining more than national
average (less than -6.3%)
Declining less than national
average (-6.3 to -5.7%)
Declining less than urban
average (-5.7 to 0%)
Growing Cities
CHAPTER 1 The urban system: Demographics and Economic Trends
The largest cities and agglomerations are distributed differently across the country. Only one city in the Western region is ranked
among the fifteen largest individual cities. However, five agglomerations among the fifteen largest are located in this
region, as well as four of the fastest growing cities. This suggests that, despite having the lowest urbanization levels,
the cities in this region are taking advantage of the economies generated by their agglomeration into large-scale urban
regions. By contrast, the Eastern region has five cities among the largest fifteen individual cities, but has none of the
fastest growing cities. Finally, the agglomeration patterns are much more concentrated in the Central region, led by Kyiv’s
agglomeration which gathers 11 individual cities. Figure 22 below plots the location of Ukraine’s cities and agglomerations
(agglomerations are labeled with the name of the main city in them) with colors assigned according to their population
growth rate. Again, this graph shows a strongly declining Eastern region, despite the fact it contains a large number
of agglomerations. The West, by contrast, shows a higher concentration of growing cities as well as cities that are at
least declining less than the averages for urban population and overall national population. The significance of Kyiv’s
agglomeration and its pattern of growth are also noticeable here.
Figure 22 – Ukrainian cities with growing or declining population 2001-2013
Source: Ukraine Statistics Department
31
Ukraine_2015_nov26.indd 31 2015-11-26 5:14 PM
Key messages and implications for further policy
and analytical work
The current dynamics in Ukraine’s urban system remain highly influenced by its origins in the Soviet system. At the
time, urban development was seen as a tool for the higher national objective of achieving socio-economic equality. This
approach, however, had other consequences too. A rigid, centrally defined decision-making process led to situations where
population was not always directed towards the most efficient cities. Many cities were developed based on industries
that survived on demand by and subsidies from the central government. This system left many cities unprepared for the
market economy system adopted following Ukraine’s independence. The consequences of Ukraine’s urban development
policies implemented during the Soviet and transition period continue to affect the country and prevent its urban
system from achieving its full potential. For example, extremely high home-ownership rates of the Soviet era limited the
development of a rental market and, thereby, increased the relative cost of mobility. In addition, continued obstacles
such as lack of access to finance and high transaction costs further threaten the benefits of potential efficiencies from
internal migration. As a result Ukraine’s people are not always moving to economic opportunities.
Urbanization in Ukraine continues to rise despite an overall decline in the urban population. This phenomenon is occurring
because the country’s rural population is decreasing at an even faster rate than its urban population. Yet urbanization
patterns are not homogeneous across the territory of Ukraine. The Eastern and Southern regions are highly urbanized,
but have shown slower urbanization rates in the last two decades, while the historically rural Western region currently
shows faster urbanization rates.
Most cities in Ukraine are shrinking while urban agglomerations are concentrating the little urban growth currently
witnessed in the country. Cities in all regions, especially smaller ones, have been losing population, mostly to the largest
cities, and usually to those that have formed large urban centers, or agglomerations. The growth of agglomerations is
indicative of a movement towards a more efficient urban system. Led by the Kyiv agglomeration, these city clusters hold
the large majority of the cities that are actually growing in population (i.e., eleven out of fifteen fastest growing cities in
the country belong to an agglomeration). This growth might be explained by the fact that these larger groups of cities
can through their agglomeration produce efficiencies by sharing costs, increasing access to and the size of their markets,
and strengthening productivity by enhancing interactions between citizens and firms.
Going forward, Ukraine should reduce barriers to move internally. Low mobility of Ukraine’s internal population is an
obstacle preventing the country from reaping the rewards of its urban potential. An improved mobility might further
spur the growth of certain urban centers with emerging employment opportunities. However, increased mobility most
likely will also deepen the decline of most Ukrainian cities, which would require policies to protect the less mobile and
more vulnerable population that is left behind. Increasing population mobility will require eliminating or smoothening
some of the obstacles to move including making the housing market more fluid and permeable (e.g. increase rental
options, improve access to housing finance) and lowering the transaction costs of moving. In addition, as outlined in the
World Development Report 200931
Governments should be neutral in regards to migration of unskilled labor, encouraging
migration for economic reasons and discouraging migration in search of public services; and strongly supportive of
internal migration of skilled labor. The later can be done through investment in services in peripheral areas to build
portable human capital and increasing the flow of labor market information, among others, so migrants arrive better
informed of employment opportunities.
31 World Bank (2009), Reshaping Economic Geography – World Development Report.
CHAPTER 1 The urban system: Demographics and Economic Trends
32
Ukraine_2015_nov26.indd 32 2015-11-26 5:14 PM
CHAPTER 1 The urban system: Demographics and Economic Trends
In addition, the country needs to put in place the right policies to better manage the population decline of most of its
cities while catering to manage growth in large agglomerations. On the one hand, shrinking cities will need to adapt
their infrastructure, the way their services are financed and delivered, and consolidate their footprint. The Central
Government should in turn create the right mechanisms and incentives (e.g. financial transfers) so that cities focus
on declining efficiently (e.g. agglomerating schools when needed). Given the extent of urban decline, the country should
explore the need of establishing national level programs, such as technical assistance and funds for downsizing, that
provide resources to better manage decline. There is also a need to increase awareness of the scale and type of urban
decline as many cities continue to follow unrealistic population growth projections. On the other hand, growing centers
need to focus on adapting infrastructure and services making sure that new-comers are well absorbed and integrated in
the city; manage peri-urban growth to avoid sprawl, etc. In addition, the realignment of city boundaries or introduction
of metropolitan governance mechanisms might be needed to achieve an effective coordination in agglomerations which
span across administrative units. This is particularly important in the case of public transport.
33
Ukraine_2015_nov26.indd 33 2015-11-26 5:14 PM
CHAPTER 1 The urban system: Demographics and Economic Trends
Trends in Ukraine’s economic performance
The economic conditions and institutions that Ukraine inherited from its time as a Soviet republic strongly influenced the
evolution of its economy in the decades following the Soviet Union’s collapse. As part of the Soviet Union, the country’s
economy was centered on the production of intermediate goods that used raw materials and energy from other republics.
The major sectors were steel production, oil processing, coal mining, and other chemical industries. Agricultural production
was also important, with wheat, corn, and sugar beets as the main crops. Almost all factories were state-owned and were
very large, leaving an industrial infrastructure that was not competitive and quite inflexible when the market system
was introduced in the 1990s. In the late 1980s, state enterprises accounted for almost 100 percent of all industrial
production in the regions of Soviet Ukraine33
.
With the domestic and international changes in the Soviet Union from 1989, Ukraine’s economy went into deep recession until 1998.
This was mainly driven by radical changes in political governance, a market that struggled to adapt to new competition,
sub-optimal macro-economic conditions, and an agricultural sector that declined despite the support of subsidies. Ukraine
had large manufacturing plants, but suddenly no sure source of raw materials and energy. In addition, the demand for
military goods decreased. Among the transformations faced by the country’s economic institutions were more open
borders and increased competition from international goods34
. However, liberalization was not uniform; Eastern Ukraine
kept a larger share of state-owned enterprises, while most private enterprises were located in the Western Ukraine35
.
At the same time, despite heavy government subsidies, agricultural output declined by 35 percent between 1990 and
1995. Collective cooperatives and state-owned farms, a legacy from the Soviet period, continued to dominate the sector;
private ownership was allowed, but lack of capital, social attitudes, and the high cost of fuel discouraged it. These
dynamics were exacerbated by a period of hyper-inflation during 1993-9436
.
Since 1998 and until the recent conflict, Ukraine has experienced a steady increase in its total GDP (See Figure 23). In 1998,
supported by the devaluation of the Hryvnya, Ukraine’s economy started to recover. This movement was led by growth
in import-substituting (textiles and food) and export-oriented industries (metallurgy and chemicals). The recovery was
interrupted in 2008, due to the effects of the Global Financial Crisis, but the halt lasted only one year37
, with GDP
returning to growth until it was halted again by the recent conflict.
III. Regional Economic Trends32
32 In providing a regional overview of the country, this document uses the description of four geographic regions developed by the Kiev
International Institute of Sociology: East, Center, South, and West.
33 Ivan Katchanovski, Social Capital and Privatization in Regions of Ukraine, Paper prepared for Presentation at the Annual World Convention
of the Association for the Study of the Nationalities, Columbia University, New York, April 5-7, 2001, available at http://individual.utoronto.ca/
ikatcha1/PrivatizationASN.pdf.
34 Vlad Mykhnenko, The Post-Communist State and Capitalism in Transition: Towards a Complementary Relationship, Paper for the Havighurst
Centre 4th Annual Young Researchers Conference, ‘The Problems of the Post-Communist State’, The Havighurst Centre for Russian and Post-
Soviet Studies, Miami University, Oxford, Ohio, USA, 5-6 November 2004, available at http://www.cas.miamioh.edu/havighurstcenter/papers/
Young%20Researchers%2004/Mykhenko.pdf
35 Social Capital and Privatization in Regions of Ukraine, 2001.
36 Andrey Androshchuk, “Transition Economies: A Look at Russia, Ukraine and Poland,” Honors College Theses, Paper 32, 2006, available at
http://digitalcommons.pace.edu/honorscollege_theses/32.
37 The recovery was quicker than most expected; the World Bank forecasted a decrease between 9 to 15 percent in 2009 for Ukraine. It is
important to note that most of the impact was in the area of foreign trade of goods and services, an area not reflected in the Gross Regional
Product. This indicator is used to compare production levels at the regional or oblast level.
34
Ukraine_2015_nov26.indd 34 2015-11-26 5:14 PM
CHAPTER 1 The urban system: Demographics and Economic Trends
Figure 23 – Real GDP decreased sharply after Ukraine’s departure from the Soviet Union
(1991-1998) and experienced a slow recovery lasting until the recent conflict (1999-2012)
Source: World Development Indicators, 2015. The World Bank
GDP
GDP per capita also increased steadily from 1998 until the Global Financial Crisis (See Figure 24) but this is partly due to the decline
in population over the analyzed period. In fact, after a short and sharp drop in response to the Global Financial Crisis of
2008, the growth in GDP per capita accelerated to return to pre-Crisis levels in 2012. This steep growth rate in GDP per
capita – steeper than the one observed in the overall growth in GDP - is partly due to the overall decline in the country’s
population. However, given the demographic transition the country is experiencing (discussed in Section 1), the positive
dynamics in GDP output per capita should be viewed with cautious optimism as the decline in population could reverse
the trend in the medium and long term. A review of trends in poverty can be observed in Box 4.
Figure 24 – GDP per capita grew steadily from 1998 until the global financial crisis
140 B
120 B
100 B
80 B
60 B
40 B
20 B
0
1988 1990 1992 1994 1996 1998 2000 2002 2004 2006 2008 2010 2012
Soviet
Union
Conflict
Global
Financial
Crisis
Recovery
4500
4000
3500
3000
2500
2000
1500
1000
500
0
160
140
120
100
80
60
40
20
0
1987 1989 1991 1993 1995 1997 1999 2001 2003 2005 2007 2009 2011 2013
GDP per capita (current US$) GDP (constant 2005 US$) billion
Source: Ukraine Statistics Department
35
Ukraine_2015_nov26.indd 35 2015-11-26 5:14 PM
Poverty rates in Ukraine have decreased over the last couple of decades. This has been the result of higher GDP
per capita growth, but also of policies to redistribute wealth among the population. In fact, between 2006 and
2011 around 75 percent of the poverty reduction was attributed to redistribution. However, inequality indices
(Gini; Theil) have decreased only marginally in the last 10 years.
Poverty headcount ratio: the proportion of a population that exists, or lives, below the ‘poverty line’.
(% of population below the poverty line, vertical axis in this graph).
In Ukraine, poverty is mainly a rural phenomenon (80 percent of the poor are in rural areas). The bottom 40
are more equally distributed between urban and rural areas.
The decline in poverty in Ukraine, however, may be threatened in the near future by the impact of the recent
conflict.
CHAPTER 1 The urban system: Demographics and Economic Trends
Note: Poor 2.5 urban/rural mean the percentage of people under 2.5 dollars/day poverty line.
2000 2001 2002 2003 2004 2005 2006 2007 2008 2009 2010 2011 2012
70
60
50
40
30
20
10
0
US$ 5.00
US$ 2.50
Projection
Survey data
Source: ECATSD using ECAPOV. Azevedo and Lomaia (2013)
Poverty Headcount Ratio (including projections), 2000-2012
poor 2.50 ruralpoor 2.50 urban percentage urban
Urbanizationrate
Distributionofpooramong
urbanandruralareas
Tajikistan
Kosovo
Bosnia
Lithuania
KyrgyzRep.
Moldova
Latvia
Estonia
Bulgaria
Georgia
Hungary
Albania
Kazakhstan
Romania
Serbia
SlovakRep.
CzechRep.
FYRMacedonia
Poland
Armenia
Montenegro
Turkey
Ukraine
Russia
100%
90%
80%
70%
60%
50%
40%
30%
20%
10%
0%
100%
90%
80%
70%
60%
50%
40%
30%
20%
10%
0%
BOX 4 – POVERTY IN UKRAINE
36
Ukraine_2015_nov26.indd 36 2015-11-26 5:14 PM
38 Information obtained from Arias, Omar S., Carolina Sánchez-Páramo, María E. Dávalos, Indhira Santos, Erwin R. Tiongson, Carola Grun,
Natasha de Andrade Falcão, Gady Saiovici, and Cesar A. Cancho, Back to Work: Growing with Jobs in Europe and Central Asia. Washington, DC:
World Bank, 2014.
Despite the steadily upward trend, Ukraine’s GDP remains significantly below pre-1989 levels. Ukraine’s GDP remains at 65
percent of its 1989 level, and its GDP per capita – standing at USD 6,596 (in 2005 PPP dollars) – is still about half of
the Europe and Central Asia (ECA) region average as well as the lowest in Europe with the exception of Moldova. Ukraine
has implemented policies and market-oriented reforms aimed at boosting investment, such as Special Economic Zones
(See ANNEX 1 for further information on Special Economic Zones), a flat rate personal income tax, and a simplified
taxation system for SMEs. However, the country still lags behind the scope and degree of reforms made in most other
ECA countries. In particular, Ukraine lags behind peer countries in its transition from a centrally-planned economy to a
market economy, as well as on its institutional and business environment reforms (See Figure 25 below).
Note: The measurement scale of the indicator ranges from 1 to 4+, where 1 represents little or no change from a rigid centrally-planned economy and
4+ represents the standards of an industrialized market economy. The index covers reform efforts in several areas, including small-scale privatization
efforts, enterprise restructuring, price liberalization, and trade and foreign exchange policy.
CHAPTER 1 The urban system: Demographics and Economic Trends
Figure 25 – EBRD Transition Index (2012)
Source: World Bank, PCN For P148768: Ukraine: Skills For Employment And Productivity
Estonia
Hungary
SlovakRep.
Poland
Latvia
Lithuania
Bulgaria
Croatia
Romania
FYRMacedonia
Slovenia
Turkey
Albania
Georgia
Armenia
Mongolia
KyrgyzRep.
Russia
Moldova
Montenegro
Ukraine
Serbia
Kazakhstan
BosniaandHerzegovina
Azerbaijan
Tajikistan
Uzbekistan
Belarus
Turkmenistan
4.5
4.0
3.5
3.0
2.5
2.0
1.5
1.0
0.5
0
37
Ukraine_2015_nov26.indd 37 2015-11-26 5:14 PM
Ukraine’s slow structural shift towards services
Duringthedecadeleadinguptotheconflict,thenation’smajorindustrieswereconsistentlymining-related39
, industrial40
, oragricultural.
Industrial production has maintained its importance in Ukraine, although its share of the economy has decreased since
2002, from 28 to 25 percent (see Figure 26). Mining, food processing, and machine-building are the dominant sub-sectors
of industrial production in Ukraine, which together accounted for almost 60 percent of the total industrial gross value
added (GVA) of the country.41
Among these, coal has played a crucial economic role, and as such has been at the center
of several important economic policies designed to stimulate the mining industry (See Box 5 below). The agricultural
sector also plays an important role in the country’s economic growth as well as its regional development as many small
settlements are dependent on agricultural production and/or processing. However, in the 2002-2010 period it has slightly
decreased from 14 to 12 percent of the total GVA of the country. In 2012, agriculture contributed nine percent of the
Ukraine’s gross GVA and was a significant share of the country’s exports.42
Overall, Ukraine has become one of the top
10 exporters globally for several agricultural commodities such as wheat, corn, sunflower oil, and honey.43
Recently, the services sector has come to lead the country’s economy. The services sector now ranks first among economic
sectors, having increased its share of the GVA from 42 to 45 percent from 2002 to 2010. If financial services were added,
the services sector would have counted 51 percent of GVA in 2010. The financial services sector itself has become a very
important player in the economy; its portion of GVA doubled over the 2002-2010 period from 3 to 6 percent (see Figure
26). Over the same period, the trade sector increased slightly from 12 to 13 percent of the total economy.
39 Coal and electric power, ferrous and nonferrous metals.
40 Machinery and transport equipment, chemicals, and food-processing,
41 Disaggregation into sub-sectors at the level of large-scale firms is possible using AMADEUS, a comprehensive, pan-European database
containing financial information on over 11 million public and private companies in 41 European countries. AMADEUS contains data for Ukraine
for the years 1997-2009,
42 State Statistics Service, Statistical Yearbook of Ukraine: 2012, 2013,
43 Food and Agriculture Organization of the United Nations (FAOSTAT), Website 2012 at http://faostat.fao.org/site/291/default.aspx,
CHAPTER 1 The urban system: Demographics and Economic Trends
Figure 26 – GVA shares: the service and finance sectors now lead Ukraine’s economy, but the
industrial sector still occupies a prominent place
Source: Ukraine Statistics Department
100%
90%
80%
70%
60%
50%
40%
30%
20%
10%
0%
Ukraine 2002 Ukraine 2010
Finance
Electricity, gas, water
Community services, entertainment
Health care
Education
Public administration
Real estate, engineering, business services
Transport and communications
Hotels and restaurants
Trade, repairs, personal items
Construction
Manufacturing
Extractive industries
Fishing
Agriculture, hunting and forestry
Finance
Services
Trade
Industry
Agriculture
38
Ukraine_2015_nov26.indd 38 2015-11-26 5:14 PM
In 2013, Ukraine produced 83.7 million tons of coal, ranking 11th
in the world. Coal is mainly mined in the Donetsk
and Lviv-Volyn basins. Donetsk Basin, located in Donetsk and Luhansk oblasts (in Eastern Ukraine), is the largest
in Ukraine with 92 percent of Ukraine’s coal reserves.
The coal industry was traditionally one of the main industries
of Ukraine; however, the fall of the Soviet Union, the collapse of
domestic demand, and the recession affecting heavy industry
caused the coal industry to crash in the first half of the 1990s.
Beyond the macro-economic factors, the industry suffered
from inefficiency, low productivity, huge debts, corruption,
and outmoded equipment that the country could not afford to
improve. In addition, the industry was beset by labor strikes due
to unpaid wages and hazardous working conditions. Between
1990 and 1995, coal output decreased by nearly 50 percent to
less than 70 million tons/year. The productivity of Ukrainian
coal miners – about 600 thousand workers were employed
directly in coal extraction in 1995 – was low. Coal exports
almost totally halted in 1995, while imported coal and other fuels captured a large share of the Ukrainian market
as a result of high domestic coal prices maintained by the government, inefficient and delayed delivery, and poor
coal quality. In addition, as mining companies – especially in mono-functional towns – continued to provide a wide
range of public services to local communities, including pre-school education, health care, housing, recreation,
these costs further reduced the competitiveness of Ukrainian coal mines.
A first wave of restructuring measures was carried out during 1996-2000 that focused on closing uneconomic
coal mines with the target of 20 mines per year; by 2001, 90 mines had been closed and privatizations of many
others had been undertaken. In 2001, a second wave of measures was adopted which reversed the previous policies
target, and focused rather on supporting the privatization of profitable mines and using subsidies to increase
productivity of others. Consequently, during this period 39 mines were modernized and the largest number of
mine privatizations took place. Under the current Ukrainian Energy Strategy, revised in 2012, coal remains one
of Ukraine’s pre-eminent sources of energy while also maintaining its strategic role as Ukraine’s main safeguard
against excessive reliance on energy imports. Currently the power generation sector consumes about 25 to
30 million tons of coal annually, almost half of all processed coal production. The Ukrainian Energy Strategy
anticipates a significant increase of coal-fired generation going forward, with power sector coal needs more than
doubling by 2030. As approved by the Cabinet of Ministers, the Energy Strategy of Ukraine proposes three stages
of reform and development through 2030: (i) Coal industry reform period with completion of the privatization of
state enterprises, introduction of public-private partnerships, and closing of the most unprofitable mines (2011-
2015); (ii) Modernization of mines by private investors (2015-2020); and (iii) Stable growth of the coal industry
(2020-2030).
In 2012, there were 143 mines in Ukraine. State subsidies for the coal sector in 2013 amounted to 13.3 billion
UAH (approx. 1.7 billion USD), which is comparable to the entire defense budget of the country. Coal industry
has been dramatically affected by the current conflict, since three-quarters of all coal mines are located on the
controlled territories of Donetsk and Luhansk oblasts. Coal production decreased by 20% in 2014 and by 60% in
February 2015 relative to February 2014. No coal subsidies are stipulated in 2015 budget.
Sources: Institute for Economic Research and Policy Consulting, “Ukraine’s Industrial Sector: Analysis and Latest Trends,”
February 2014. Viachaslau Herasimovich, “Ukrainian Coal Mining Sector Review,” CASE Ukraine, September 21, 2008. World
Bank, “Ukraine - Coal industry restructuring sector report,” 1996
CHAPTER 1 The urban system: Demographics and Economic Trends
BOX 5 – THE RISE AND FALL OF UKRAINE’S COAL INDUSTRY
FIGURE: COAL BASINS IN UKRAINE (2013)
Source: Eurocoal Website
39
Ukraine_2015_nov26.indd 39 2015-11-26 5:14 PM
The economy’s shift from heavy industry and mining to services has also been accompanied by a decrease in the role of agriculture.
From 2002-2010, the contribution of agricultural production to the economy decreased from 14 to 12 percent, with
declines in grains, sugar beets, sunflower seeds, vegetables, beef, and milk. This decline might reflect the impact of the
overall shift of the population and economic activities from rural to urban areas (as discussed in Section 2), and from
less to more productive sectors. However, with the recent decline of the ferrous and energy sectors, agribusiness’ share
in output as well as exports has increased again.
The structural transformation can also be observed in the shift in the employment distribution from industry and agriculture to
services. According to the Background Paper for the World Development Report 2013: Ukraine Case Study: Jobs and
Demographic Change, 2012. Compared to 2000s, for example, the share of total employment in agriculture fell from 21.6
percent to 15.3 percent in 2013, while the share employed in services (in the private sector) rose from 25.4 percent to
34.5 in 2010 (latest data available). Ahead of agriculture but a distant second place to the services sector, the industrial
sector currently provides 17 percent of employment. The public sector as a whole represents the remaining 20 percent of
employment44
, with public administration jobs making up six percent of the total.
However, employment has by and large not moved to the high-productivity sectors in Ukraine (Figure 27).While a significant number
of workers have left the agricultural sector since the early 2000s – a sector with below-average labor productivity –
they have not always moved to higher-productivity sectors. Instead, many workers have gone into construction (which
rose from 4.4 percent to 4.6 percent of total employment), transportation (from 6.7 to 6.8 percent) and retail – the
three sectors with the lowest overall labor productivity. Finance, a high-productivity sector, has strongly increased its
participation in the GVA as shown in Figure 26. However, despite the doubling of its share of employment (from 0.8
percent to 1.6 percent), the number of employees in finance remains low compared to traditional sectors. Although other
highly-productive sectors such as healthcare have expanded in recent years, they also remain a relatively small portion
of overall employment.
CHAPTER 1 The urban system: Demographics and Economic Trends
Figure 27 – The change in the share of employment by sector between 2001 and 2008 in
percentage points against sectoral productivity in 2001. The economy’s average productivity rate is
provided for comparison
Source: World Bank, PCN for P148768: Ukraine: skills for employment and productivity, based on ILO and UN data 45
.
Note: The trend line is depicted in green.
44 Kupets, Olga, et.al, Background Paper for the World Development Report 2013: Ukraine Case Study: Jobs and Demographic
Change, 2012, 2.2. Description of the labor market situation, available at http://siteresources.worldbank.org/EXTNWDR2013/
Resources/8258024-1320950747192/8260293-1320956712276/8261091-1348683883703/WDR2013_bp_Jobs_And_Demographic_Change.pdf.
45 See McMillan and Rodrik (2011) for a methodological discussion on measuring structural transformation
Agric.
Admin.
Hotels
Housing
Service
Retail
Constr.
Finance
Fishing
Manufact.
Electr. Educ.
Mining
Transp.
Health
1.0
0.5
0
-0.5
-1.0
-1.5
-0.1 -0.05 0.050
Laborproductivity,2001
Changing employment, 2001-2008Less workers More workers
HighLow
40
Ukraine_2015_nov26.indd 40 2015-11-26 5:14 PM
Among transition economies, Ukraine has the lowest level of labor productivity. In 2011, GDP per person employed was USD
10,098 in Ukraine (Figure 29)46
. This rate is lower than the rate in most countries of the former Soviet Union, including
Moldova, the Russian Federation, Armenia, and Belarus. In addition to this low baseline level, productivity growth has
been slow over the years, albeit accelerating in the years before the Global Financial Crisis in 2008 (see Figure 28). The
reasons for this slow growth in labor productivity are multiple, but a major impediment is the rigidity of the labor market.
Currently, there is limited mobility for labor migration within the country as well as significant disparity between the
growing demand for high-skilled service workers in the service sector and the limited number of high-skilled workers.47
46 Measured in constant 1990 purchasing power parity (PPP) prices.
47 Arias, O.S., C. Sanchez-Paramo, M.E. Davalos, I. Santos, E.R. Tiongson, C. Gruen, N. de Andrade Falcao, G. Saiovici, and C.A. Cancho, Back to
Work: Growing with Jobs in Europe and Central Asia, Washington, DC: World Bank, 2014.
CHAPTER 1 The urban system: Demographics and Economic Trends
Figure 28 – GDP per person employed in countries of the former Soviet Union 2001 (1990 PPP)
Figure 29 – Trend of GDP per person employed in Ukraine (based on 1990 PPP)
Source: World Development Indicators
Source: World Development Indicators 2015, The World Bank
35000
30000
25000
20000
15000
10000
5000
0
Ukraine Moldova Uzbekistan Georgia Russian Fed. Armenia Belarus
GDPperpersonemployed(1990PPP)
14000
12000
10000
8000
6000
4000
2000
0
1989
1990
1991
1992
1993
1994
1995
1996
1997
1998
1999
2000
2001
2002
2003
2004
2005
2006
2007
2008
2009
2010
2011
2012
GDP per person employed (constant 1990 PPP $)
41
Ukraine_2015_nov26.indd 41 2015-11-26 5:14 PM
Remittances are increasingly important to the
Ukrainian economy
As a consequence of increased migration outflows (discussed in Section 1), remittances have become a growing element of the
economy. According to World Bank data, remittance inflows to Ukraine increased from USD 829 million to USD 5,607
million between 2006 and 2010 (Figure 30) – a factor of almost seven48
. In 2013, the National Bank of Ukraine reported
that the amount of remittances transferred to Ukraine was USD 8.5 billion, representing 4.7 percent of Ukraine’s GDP
for that year49
. However, the actual amount of remittances may be twice the size of the reported number50
, given that
many Ukrainians opt for unofficial means for transfers. It is estimated that nearly 60 percent of overall remittances are
not transferred through the banking system.
In fact, in 2010, official remittances were nearly equivalent to the amount of Foreign Direct Investment (FDI). In addition, they
represent an important source of foreign currency for Ukraine, with 4.67 and 4.43 billion received in 2007 and 2010 in
US Dollars, respectively. Consequently, personal remittances have become a large part of the balance of payments of the
country and helped ameliorate the trade deficit that widened considerably during 2005-2008. The growth of the deficit
was caused by higher prices in imported oil and gas, growth in domestic demand for goods exceeding growth of exports,
and the Global Financial Crisis.
In the short run, remittances are being used fundamentally for domestic consumption. Remittances are an increasingly important
source of extra income for migrants’ families51
. A recent study shows that almost all of remittances are used for living
expenses (73 percent) and consumer goods (26 percent), whilst only 3.3 percent is used for setting up a business.
Anecdotic evidence suggests that remittances are often being sunk into real estate investments. However, while in the
short term remittances can stimulate the local economy through consumption, over the longer term they are best used
by nations to enhance investments (i.e. human capital) and thus boost productivity, which is especially needed in Ukraine
given the current demographic trends of population decline and aging.
Over half of all remittance-receiving households in Ukraine are concentrated in the Western region. This region is followed by the
Eastern region, where 20 percent of households receive remittances. The Central and Southern regions have much lower
shares. 56 percent of remittances come from countries in the EU, with Poland and the Czech Republic as the largest
contributors; 40 percent from Russia; and the remaining four percent from a variety of countries. Most remittances flow
to middle class and lower middle class households52
and to urban areas53
.
48 O. Kupets, The Development and the Side Effects of Remittances in the CIS Countries: the Case of Ukraine, CARIM-East Research Report
2012/02, European University Institute Robert Schuman Center for Advanced Studies, 2012, available at http://www.carim-east.eu/media/
CARIM-East-2012-02.pdf.
49 National Bank of Ukraine; see http://www.bank.gov.ua/doccatalog/document?id=80651.
50 Fedorak, Z., “Nashi sered chuzyh (Ours Among the Aliens),” Economic News, 2007 (in Ukrainian).
51 International Organization for Migration, Migration in Ukraine: Facts  Figures, September 2011, available at https://www.iom.int/jahia/
webdav/shared/shared/mainsite/activities/countries/docs/Ukraine/Migration-in-Ukraine-Facts-and-Figures.pdf.
52 Modular Survey on Labor Migration in Ukraine, 2012, International Labour Organization
53 Kupets, O., The Development and the Side Effects of Remittances in the CIS Countries: The Case of Ukraine, 2012
CHAPTER 1 The urban system: Demographics and Economic Trends
42
Ukraine_2015_nov26.indd 42 2015-11-26 5:14 PM
CHAPTER 1 The urban system: Demographics and Economic Trends
Figure 30 – Remittances to Ukraine by expatriates, 2001-2013
Source: Authors’ analysis based on World Development Indicators Data, The World Bank
10000
8000
6000
4000
2000
0
6
5
4
3
2
1
0
2001 2002 2003 2004 2005 2006 2007 2008 2009 2010 2011 2012 2013
Remittances (Million US$) Remittances (% of GDP)
MillionUS$
%ofGDPA diverse set of economic regions
There are important differences in the economic structures of the regions of Ukraine. As previously mentioned, the Eastern region
is a traditionally industrial area, while the Central region is the country’s leader in the financial, trade, and services
sectors. The Southern region is also an important industrial center, while the Western region, as it is less urbanized, has
the greatest concentration of agricultural activities in the country (See Figure 31).
The evolution of the economic sectors has been different across regions, with the financial sector growing with particular strength
in the Central region. In the Central region, the financial sector’s share rose from 4 to 8 percent from 2002 to 2010,
surpassing the share of the industrial sector, which lost three percentage points. The services sector, which is heavily
concentrated in Kyiv, occupied approximately 50 percent of the central region’s economic activity. The Southern region
also registered a notable increase in financial services’ share of the economy, rising from 2 to 4 percent. If financial
services are included with other service industries shares, the service sector accounted for 48 percent of the Southern
region’s economy, followed by the industrial sector, which decreased from 33 to 31 percent from 2002 to 2010.
43
Ukraine_2015_nov26.indd 43 2015-11-26 5:14 PM
CHAPTER 1 The urban system: Demographics and Economic Trends
Source: Ukraine Statistics Department
Figure 31 – GVA shares: Eastern and Southern regions remain more industrial, the Central region is
predominent in trade, services and financial sector
100%
90%
80%
70%
60%
50%
40%
30%
20%
10%
0%
Western2002
Western2010
Eastern2002
Eastern2010
Central2002
Central2010
Southern2002
Southern2010
Finance
Electricity, gas, water
Community services, entertainment
Health care
Education
Public administration
Real estate, engineering, business services
Transport and communications
Hotels and restaurants
Trade, repairs, personal items
Construction
Manufacturing
Extractive industries
Fishing
Agriculture, hunting and forestry
The Eastern region also saw a significant shift towards the financial sector, although industrial activities remain secondary only to
services; meanwhile, the Western region also increased its share of production in the financial and service sectors. Industry’s share of
the Eastern region’s economy fell drastically from 38 to 20 percent over the 2002-2010 period. The decrease was mostly
due to displacement caused by the rise of the financial sector. In the Eastern region, the financial sector’s participation
more than tripled, from 2.5 to almost 6 percent. In the Western region, the agricultural sector decreased five percentage
points from 2002-2010; however, the trade sector grew nearly that amount (3 percentage points) over the period.
44
Ukraine_2015_nov26.indd 44 2015-11-26 5:14 PM
CHAPTER 1 The urban system: Demographics and Economic Trends
Overall,industrialactivitycontinuestobehighlyconcentratedinafewoblasts. The clear leader is Donetsk Oblast, which accounts
for 21 percent of Ukraine’s total industrial output, followed by Dnipropetrovsk with 16 percent. Thus, these two oblasts
account for some 36 percent of Ukraine’s industrial production. Adding Luhansk (8 percent), Zaporizhia (5 percent), and
Kharkiv (5 percent) oblasts, all of which are located in the Eastern region, increases the share to almost 55 percent.
Donetsk and Luhansk oblasts are home to major elements of the metallurgical, chemical, power, and heavy engineering
industries. These two oblasts are the industrial heartland of Ukraine, and were estimated to host about 900 large-scale
industrial plants before the conflict, including 140 collieries, 40 metallurgical plants, and seven thermal power stations,
as well as 177 operations involving hazardous chemicals, including 113 operations using radioactive materials.
A more disaggregated analysis of sectoral employment supports the conclusions previously discussed and sheds light on some
important trends. Box 6 presents the methodology used and Table 7 presents a summarized version of the results. The first
four columns (“Growth 2002-2010”) of the table present the results from a comparison of the regions’ location quotients
in 2000 and 2010 for each sector (see explanation of the term in Box 6. An upward-pointing arrow indicates that the
quotient has grown, i.e., the sector has increased in importance in that region. The following four columns (“Importance
2010”) show whether the quotient in 2010 was above or below 1. A plus mark (+) represents a value that is higher than 1,
while a minus mark (-) represents a value lower than 1. Quotients above 1 indicate that the sector’s share of employment
in the region is greater than the sector’s share of employment at the national level.
Location quotients are used to determine the relative importance of each sector in different regions. The location
quotient determines whether the fraction of people employed in a sector is larger or smaller relative to the
national average. If we define 𝜑s
rt to be the share of the total workers in region r at time t who work in sector s,
and define 𝜑s
t to be the share of the total national employment at time t that is due to employment in sector s,
we can write the location quotient for sector s , region r, and time t, LQs
rt as:
LQs
rt
=
This location quotient reveals the extent to which the share of an industry’s employment in a given location is
larger or smaller than that sector’s share of overall national employment. For example, if manufacturing employs
40 percent of the country’s workforce and a location quotient for manufacturing is 1.1, then manufacturing
employment in that location is 44 percent of that location’s workforce. In general, if LQs
rt  1, then the sector
s is over-represented in terms of employment relative to the country’s employment in that sector. The opposite
happens if LQs
rt  1.
𝜑s
rt
𝜑s
t
BOX 6 – LOCATION QUOTIENT ESTIMATES OF SECTOR EMPLOYMENT IN THE REGIONS
45
Ukraine_2015_nov26.indd 45 2015-11-26 5:14 PM
Figure 32 to Figure 35 below show the three dimensions highlighted by the location quotient derived for employment
activity in each region: change, importance in each region, and size of the market. The vertical axis shows the location
quotient in 2010, the horizontal axis shows the location quotient change in percentage between 2000 and 2010, and the
relative sizes of the bubbles in the plot represent the number of workers in that sector in the region.
Agriculture is still very important in the Western region, although services have been increasing. The sector still plays a leading role
in employment in the Western region, at nearly 25 percent, and a location quotient larger than 1 (1.33). Furthermore,
Figure 32 shows that services, such as public administration, health, and education, are increasingly important. Finance,
one of the leading sectors in other regions, remains lagging in terms of the employment it generates, despite the growth
in output by this sector (Figure 31).
Sector
Growth 2000-2010 Importance 2010
Western Eastern Central Southern Western Eastern Central Southern
Agriculture, hunting and fishing,
forestry
➪
➪
➪
➪
+ - - -
Industry
➪
➪
➪
➪
- + - +
Construction
➪
➪
➪
➪
+ + - -
Trades; repair of motor vehicles,
household goods and personal uses;
hotels and restaurants
➪
➪
➪
➪
-
+ - +
Transport, storage, and
communication
➪
➪
➪
➪
-
+ + +
Finance
➪
➪
➪
➪ - - + -
Real Estate
➪
➪
➪
➪
- - + -
Public Administration
➪
➪
➪
➪
- - + -
Education
➪
➪
➪
➪
+ - + -
Health care
➪
➪
➪
➪
+ - + -
Other community and personal
services; activities in the field of
culture and sports
➪
➪
➪
➪
+ - - +
CHAPTER 1 The urban system: Demographics and Economic Trends
Table 7 – Growth of sector employment in regions and relation of that sector employment against
the sector’s employment nationally using location quotients
Source: Ukraine Statistics Department
46
Ukraine_2015_nov26.indd 46 2015-11-26 5:14 PM
CHAPTER 1 The urban system: Demographics and Economic Trends
Figure 32 – Sectoral employment in the Western region by location quotient
Figure 33 – Sectoral employment in the Central region by location quotient
Source: Ukraine Statistics Department
Location Quotient percentage change 2010-2000
-0.16
-0.15 -0.10 -0.05 0 0.05 0.10 0.15 0.20 0.25
Finance
Finance
Industry
Industry
Construction
Agriculture
Agriculture
Transport
Transport
Trade and services
Trade and services
Education
Education
Health
Health
Other
Public admin
Public admin
Real Estate
Real Estate
-0.11 -0.06 -0.01 0.04 0.09 0.14
LocationQuotient2010LocationQuotient2010
1.40
1.30
1.20
1.10
1.00
0.90
0.80
0.70
0.60
0.50
1.55
1.45
1.35
1.25
1.15
1.05
0.95
0.85
0.75
Construction
Other
47
Ukraine_2015_nov26.indd 47 2015-11-26 5:14 PM
CHAPTER 1 The urban system: Demographics and Economic Trends
As shown in Figure 33 the Central region is strongly focused on high skill services, while employment in more traditional
sectors like industry and other services has stayed fairly stable and at levels similar to the country’s average. Finance
and public administration show a strong growth in their quotients, although, as in other regions, there are few people
employed in these sectors. The presence of a strong finance sector, as well as other high output sectors like health, is to
be expected as this region hosts Kiev, Ukraine’s capital and largest city, and one of the few cities growing in the country.
Possibly as a consequence of new migrants, employment in construction is more important here in relative terms than in
the rest of the country. However, it has been decreasing in the region over time. Finally, despite a large number of people
employed in agriculture, the relative importance of this sector is low, and it too has been decreasing over time.
The industrial sector remains predominant in the Eastern region (Figure 34); however, other high skill sectors, such
as trades and services, have not grown much in relative terms despite being the second largest sector in terms of
employment. This region has slowly evolved, but the industrial sector remains at the core of its economic activity. For
instance, the coal industry, despite having gone through severe crises, still makes up a large portion of the production
portfolio of the region (see Box 5 above). As the most urbanized region in the country (see Section 2: Urbanization and
the Urban System above), it is not surprising that trade and services, as well as construction, occupy an important
place in employment. Yet trades and services have not been growing, while construction and agriculture have seen
increases. Similarly, high skill sectors, like public administration and finance, have been decreasing and occupy low levels
of importance relative to the rest of the country.
The industrial sector also plays a key role in the Southern region (Figure 35), as does the trades and services. The
Trades and Services sector is gaining in importance, particularly in the area of tourism services. Manufacturing and
manufacturing-related activities like transportation and storage, water supply, and management are also playing an
increasing role. Growth in this region is the most concentrated of all the regions as only two main sectors are growing in
importance according to the location quotients. Other high skill sectors, like finance and public administration, remain
small and are decreasing. This may be an indication that the region’s economy has been having difficulties in its evolution
into a services-oriented economy.
Figure 34 – Sectoral employment in the Eastern region by location quotient
Source: Ukraine Statistics Department
Location Quotient percentage change 2010-2000
-0.15
Finance
Industry
Construction
Agriculture
Transport
Trade and services
Education
Health
Other
Public admin
Real Estate
-0.10 -0.05 0 0.05 0.10 0.15
LocationQuotient2010
1.50
1.40
1.30
1.20
1.10
1.00
0.90
0.80
0.70
0.60
0.50
48
Ukraine_2015_nov26.indd 48 2015-11-26 5:14 PM
CHAPTER 1 The urban system: Demographics and Economic Trends
Figure 35 – Sectoral employment in the Southern region by location quotient
Source: Ukraine Statistics Department
Location Quotient percentage change 2010-2000
-0.15
Finance
Industry
Construction
Agriculture
Transport
Trade and services
Education
Health Other
Public admin
Real Estate
-0.10 -0.05 0 0.05 0.10 0.15
LocationQuotient2010
1.15
1.10
1.05
1.00
0.95
0.90
0.85
Key messages and implications for further policy
and analytical work
Overall, Ukraine presents some indicators (GDP, GDP per capita, and poverty) that show steady progress over the last
decade. However, continued progress in these areas is highly uncertain due to (i) the observed, negative population trends;
(ii) the current conflict; and (iii) the slow progress that Ukraine has made, in terms of institutional adaptation and
reforms, in moving toward a market-oriented system.
It is not uncommon that a declining population initially has a positive impact on economic indicators, but its effect on
economic performance over the long run is uncertain. The higher GDP per capita that is observed following population
decline is generally linked to the fact that Capital is durable. Such economies may experience an increase in their capital
per worker ratio, which may render each inhabitant marginally more productive. Additionally, decreasing population
causes an initial shortage of labor, increasing relative demand for it, and potentially resulting in a reduced unemployment
rate as well as higher wages. These dynamics have been observed in countries that have experienced sharp population
decline such as Japan54
. The negative effects of population decline appear later, and are generally visible in the decline
of demand for consumption. The effects over time of diminished demand as well as expectations of further population
decline reduce incentives for investment and affect GDP growth negatively55
.
54 OECD, “Regional factors: Population and GDP per capita,” in OECD Regions at a Glance 2009, OECD Publishing, 2009, available at http://
dx.doi.org/10.1787/reg_glance-2009-26-en.
55 Markus Brückner and Hannes Schwandt, Income and Population Growth: Discussion Paper No. 7422, Bonn: Institute for the Study of Labor,
May 2013, available at http://ftp.iza.org/dp7422.pdf.
49
Ukraine_2015_nov26.indd 49 2015-11-26 5:14 PM
56 World Bank Group, Doing Business 2015: Going Beyond Efficiency, available at http://www.doingbusiness.org/data/exploreeconomies/
ukraine/. Only Kiev is considered.
57 Fajnzylber, P., and J. Humberto Lopez, eds., Remittances and Development: Lessons from Latin America, Washington, DC: The World Bank,
2008, available at http://siteresources.worldbank.org/INTLAC/Resources/Remittances_and_Development_Report.pdf
Additionally, fixed costs in the provision of services also become more burdensome as they are shared among fewer
people. Overall, given the demographic trends, the observed increase in GDP per capita in Ukraine should be viewed with
cautious optimism; if appropriate measures are not adopted, the increase might not continue over the mid-term or longer
term.
The current conflict can bring a halt in the steady progress achieved in economic and poverty indicators over the
last decade. From destruction of capital to institutional destabilization, the effects of the current conflict could cause
lasting damage to economic activity. Furthermore, the conflict pushes people from unsafe areas, causing large costs to
households and disrupting economic activity. Unless these movements somehow allocate households to more productive
areas that are also well-prepared to receive them, it is very likely that the costs for these displaced households will be
high and the adaptation process will be long.
Another red flag is the slow adaptation of Ukraine’s firms and institutions to a market economy system. Compared
to other countries in the region, Ukraine lags behind in its transition from a centrally-planned economy to a market
economy, as well as on its institutional and business environment reforms (for instance, in measures of the ease of doing
business, Ukraine ranks 96th worldwide and 22nd in the ECA region56
). The EBRD transition index finds Ukraine doing
poorly in several areas, including small-scale privatization efforts, enterprise restructuring, price liberalization, and trade
and foreign exchange policy. Unless changes are made in these spheres, continued progress will be threatened.
In terms of structural transformation of the economy, Ukraine has moved slowly from an industrial enterprise-centered
economy to a services-centered economy, with a finance sector at the forefront of this change. Services have grown
significantly in a number of areas, including retail, property, and information and communications technology (ICT).
However, progress has been slow and has not occurred uniformly across the regions. Industry remains very important in
the Southern and Eastern regions, while the Western region has seen a slow increase in the importance of services as the
agriculture sector’s dominance wanes. Finance’s share of national Gross Value Added (GVA) has nearly doubled, but its
share of the labor market is still minor and should not be expected to replace jobs in traditional sector. Overall services
grew 40 percent from 2002-2010. Ukraine will need to increase the skills of its labor force to take advantage of this
growing economic sector. Information-based sectors could have a wider employment potential in the country.
International migration has been an important phenomenon that has affected not only population but also economic
dynamics. Resources provided by remittances are large in magnitude, but their effects appear most likely beneficial
only in the short term. Remittances provide short-term benefit by alleviating income problems of local consumers.
However, data indicate that they are mainly used for consumption and not for long-term investments in human capital or
entrepreneurship activities. Additionally, they can have medium- and long-term negative consequences, such as exchange
rate appreciation and resultant negative effects on exports; linking the local economy to negative global shocks; and in
some cases, hysteresis57
, as some people may forego work in favor of relying on remittances and lose their labor skills
over time.
As discussed in the previous sections, going forward, the country should aim at increasing labor mobility and accelerate
institutional and business environment reforms. Facilitating increased labor mobility could further increase the gains
from rising productive sectors (finance, information and communication technologies, education, and medicine). This will
be especially beneficial if it is focused on facilitating population movements from low productivity rural sectors to high
productivity urban sectors, or from low productivity to high productivity urban areas.
CHAPTER 1 The urban system: Demographics and Economic TrendsCHAPTER 1 The urban system: Demographics and Economic Trends
50
Ukraine_2015_nov26.indd 50 2015-11-26 5:14 PM
The roles of cities in economic growth
Cities, under the right conditions, can be true engines of economic growth. Cities provide a common space for collaborations
and interaction for both firms and workers, providing an essential stage for agglomeration economies to occur through
better sharing, matching and learning mechanisms58
. Agglomeration economies refer to the benefits of locating close
together; this applies to both firms and workers. As firms cluster together, they broaden the market for their suppliers.
With more buyers, suppliers’ average cost of production goes down and this leads to a drop in prices as well. Sharing
increases profits through this lowering of costs as well as through allowing suppliers to provide highly-specialized goods59
.
Another dynamic of larger market scale brought by agglomeration is an increase of the matching probability between
demand and supply. For example, workers more easily find suitable jobs and firms more easily find the supplies they
need. Finally, as both firms and workers aggregate in cities, they learn from each other more efficiently simply by their
proximity and interactions. This learning channel yields increased productivity, especially in sectors like modern industry
and services, in which high skills and innovation are more important. The learning mechanism not only affects actors in
the same industry or sector (localization economies)60
, but also spurs innovation across sectors and between workers
with different skills (urbanization economies). Also, spatial concentration of activities is conductive to the spillover of
knowledge and innovations across industries and sectors of the economy.
These benefits can spread to the country as a whole if cities are positioned to take advantage of a regional network, or,
if they engage with global system of cities61
, and they can offer a gateway to the global economy for the entire national
economy. Concentrations of offices of global companies, financial market institutions, large-scale infrastructure, and
world-class education and cultural institutions enable cities to attract global partners and global markets and potentially
bring benefits to their metropolitan areas, broader region, and the entire country.
The positive impact of agglomeration economies on economic growth may be undercut by congestion costs such as
traffic congestion and air pollution, which, if growth is not properly managed, can increase as cities become larger and
denser. However, with sustainable management, agglomeration economies exceed congestion costs, and the overall net
effect is an increase in productivity. To achieve increased productivity, the right mix of good governance, a beneficial
business climate, and an efficient provision of public goods, usually in the form of public services and infrastructure62
, is
necessary.
Understanding the evolution of a country’s system of cities, as well as their role in economic growth, is fundamental for
sound policy formulation. This section will explore the role of cities in Ukraine through two dimensions: first, by looking
at the aggregate contribution of the urban sector to Ukraine’s economy, second, by making a city-level assessment of
the demographic, economic, and spatial evolution of Ukrainian cities over the past two decades. For the first assessment,
58 Duranton, et. al., provide a review of the formal treatment of these ideas in urban economics (Duranton, G., and D. Puga, “Micro-Foundations
of Urban Agglomeration Economies,” in Henderson, J. Vernon, and Jacque Thisse, eds., Handbook of Urban and Regional Economies, Vol. 4,
Amsterdam: North-Holland, 2004). These ideas have been widely studied since their initial articulation by Marshall (Marshall, A., Principles of
Economics, London: Mac-Millan, 1890).
59 World Development Report 2009: Reshaping Economic Geography. (2009).
60 Jacobs, J., The Economy of Cities, New York: Vintage, 1970, and McCann, P., Urban and Regional Economics, Oxford, U.K.: Oxford University
Press, 2001.
61 For example, per the Globalization and World Cities Research Network Kyiv is classified as a Beta world city..
62 This not only ensures taking full advantage of agglomeration, but also that benefits of rapid urbanization are more widely shared. Kuncoro,
Ari, “Spatial Agglomeration, Site Productivity and Local Governance: Indonesian Experience from 1980 to 2003,” In Yukon Huang and Alessandro
Magnoli Bocchi, eds., Reshaping Economic Geography in East Asia, Washington, DC: World Bank, (EAP Companion Volume to the WDR 2009),
forthcoming.
IV. Cities of Ukraine: Engines Of Economic Growth
CHAPTER 1 The urban system: Demographics and Economic Trends
51
Ukraine_2015_nov26.indd 51 2015-11-26 5:14 PM
Urban economic activity in Ukraine
In Ukraine, the predominant share of economic activity is concentrated in urban areas, significantly exceeding the share of
rural areas. Figure 36 shows how urban production in Ukraine is much higher than rural production measured by GVA
over the period 2002-2010. Regional differences can also be observed. The Central region has the highest production for
both rural and urban areas64
. This region, in which Kyiv plays a leading role, has the greatest urban GVA in the country65
,
followed by the Southern and Eastern regions, respectively. As expected, the Western region ranks last in terms of urban
production. The ranking is similar for rural GVA, except for the period 2002 to 2004, where the rural production in the
Eastern region was higher than in the Southern region.
Urban sectors are much more productive than rural sectors. As discussed in Section 1, Ukraine’s population has decreased
overall, but the decline has been sharper in rural areas than in urban areas. This pattern, together with internal migration
to large urban areas, has increased the share of the population that resides in cities. If agglomeration economies discussed
above were not present (or were offset by congestion costs), labor productivity measured in GVA ratios for urban and
rural sectors would closely follow urban-rural population ratios as shown in Figure 37. However, urban production grew,
relative to rural production, at a much faster rate than urbanization during the period 2002-2010.
different aspects of urban and rural economic activity will be contrasted using both aggregated regional data and firm-
level data. For the second, night light (NLs) data will be used to track trends in economic activity at the city level, both
spatially (i.e., the evolution of the night lights footprint and light intensity) and through time by drawing on demographic
data analyzed in Section 2. The use of NLs as a proxy for economic activity is based on empirical evidence that they are
correlated with economic activity (Henderson, et. al., 2009). On this basis, two city typologies are developed to assess
how cities evolved in economic, demographic, and spatial terms over the past two decades. The first city typology
compares Ukraine’s cities against a benchmark that defines urban as those cities emitting NLs of intensities higher than
urban threshold, which in the case of Ukraine is 19.563
. This analysis identifies settlements that grew enough in light
intensity over the period to be considered to have met the urban threshold. Others, by contrast, are shrinking to the point
that they are no longer considered urban by the standard of NLs. The second typology focuses on settlements that met
this urban threshold over two periods of time. This typology analyzes cities across two dimensions: changes in urban
footprint (defined by NLs), and changes in light intensity. Finally, these two typologies are triangulated with geographic
and demographic data to further illuminate the evolution of the urban system in Ukraine and its main challenges.
63 For Ukraine, this threshold was determined to be 20.94 DN. Intensity of night-time light here is measured on a “Digital Number” (or DN)
scale This threshold has been selected by calibrating the lights data against higher resolution land use cover maps for the region – in particular,
the European Space Agency’s GlobCover 2009 map and the MODIS Collection 5 Land Cover Type map. See the SAR Urbanization Flagship for
a discussion of the data. It is important to note that this differs from the product that forms the basis of Henderson et al.’s research (See
Measuring Economic Growth from Outer Space, American Economic Review ,102), as well as that used by most other researchers, in that it
does not suffer from the saturation problem.
64 For rural production, this is due mainly to climate conditions and a larger concentration of the most fertile black soils, especially compared
to the Eastern and Southern regions.
65 Gross Value Added (GVA) data by sector, as reported by the State Statistics Service of Ukraine, is used to measure urban production for the
years 2002-2010. The sectors can be divided into those that are typically urban and those that are typically rural according to the following
classifications: Agriculture, Hunting, and Forestry, and Fishing are elements of rural production, and Manufacturing, Construction, Trades,
Repairs, Personal Products, Hotels and Restaurants, Mining, Transport and Communications, Real Estate, Engineering, Business Services,
Public Administration, Education, Health Care, Community Services, Entertainment, Electricity, Gas, Water, and Finance are elements of urban
production. These groupings are a simplification of the urban and rural divide, which is more complex. For example, the legal residence of
businesses may be located in cities, where they report their employment and overall economic production, although their main economic activity
occurs in rural areas. The city of Kyiv is emblematic of this; as a region, it is one of the largest exporters of agrarian products in Ukraine and
hosts the headquarters of most of the large agro-holdings groups. See for example the case study for the grain sector in The EBRD’s Experience
with Policy Dialogue in Ukraine (2014).
CHAPTER 1 The urban system: Demographics and Economic Trends
52
Ukraine_2015_nov26.indd 52 2015-11-26 5:14 PM
In fact, urban production was between four and five times higher than rural production in Ukraine. This ratio has
increased steadily in the last decade, except for a mild decline between 2007 and 2009. By contrast, the dotted lines
below, representing the ratio between urban and rural population in each of the regions, shows that urban population is
about twice the size of the rural population and its increase has been much less steep.
CHAPTER 1 The urban system: Demographics and Economic Trends
Figure 36 – Ukraine’s urban GVA (upper graph) is much greater than its rural GVA (lower)*
*The scale of the y-axis differs between graphs for purposes of illustration
Source: Ukraine Statistics Department
Western Eastern
Central Southern
Ukraine
2002 2004 2006 2008 2010
Reallocalcurrency(000smillion)
250
200
150
100
50
0
Urban GVA
Rural GVA
2002 2004 2006 2008 2010
Reallocalcurrency(000smillion)
50
40
30
20
10
53
Ukraine_2015_nov26.indd 53 2015-11-26 5:14 PM
Figure 37 also shows that the impact of urban areas in production differed significantly between regions during 2002-
2010, with the Central region showing the highest ratio of urban to rural production and the Western showing the
lowest. Production in the Central region was predominantly urban relative to the other regions. In 2008, for instance, the
region’s urban production was almost eight times as great as its rural production. Urban population was nearly twice
that of rural population in this region, but was significantly lower than the ratio of production and much more stable
than other regions. By contrast, the Western region had the lowest urban production relative to its rural production in
the period. Still, even in this relatively more rural region, urban production was not only more important than rural (note
the line above is 1), but the ratio of urban to rural production was also higher than the urban to rural population ratio.
This dynamic was found in all regions, except for the Eastern region. The Eastern region had the highest urban to rural
population rates – higher even than the urban to rural GVA ratios – suggesting that urban productivity in this region was
lower than in the other regions.
Firm-level data66
shows how the largest cities in Ukraine acted as magnets for growth, continuing to attract workers and
firms. Table 8 shows the cities67
with the greatest concentration of firms. The first noticeable pattern is that the largest
cities held the largest number of firms. This happened not only because they offered the largest markets, but also
because of the location and urbanization economies mentioned earlier. The table also shows that the ranking of cities
in terms of the number of firms they host is quite stable; among the largest 15 cities in 2000, all but one ranked in the
top 15 locations in 2008. This is consistent with the idea of agglomeration economies, as the largest cities provided
a better economic environment for firms. There are several Western cities, such as Ivano-Frankivsk, that ranked much
higher in the number of firms than their population ranking would suggest. This would suggest that these cities might
have possessed characteristics that made them attractive for firms to locate there68
. This trend could be due to the
convenient location for new firms of the Western region in terms of its proximity to the large market of Western Europe.
By contrast, the opposite reasoning could be applied to those cities whose rank in number of firms was lower than their
population ranking; in relative terms, they may have been less attractive for firms than their population would suggest.
66 Firm-level data was obtained from AMADEUS, a large-scale, firm-level survey. AMADEUS is a comprehensive, pan-European database
containing financial information on over 11 million public and private companies in 41 European countries. There is data for a representative
sample of firms in Ukraine for the years 1997-2009 in an unbalanced panel.
67 These correspond to individual cities and not to agglomerations.
68 In particular, Ivano-Frankisk presented one of the most intense growth rates, 122 percent over the period, which suggests that economic
activity was very robust and that firms located there were of significant size. Similarly, Lviv presented exceptional growth of nearly 90 percent.
Figure 37 – Urban-rural GVA ratios are much greater than urban-rural population ratios, indicating
much higher productivity in the urban sector
Source: Ukraine Statistics Department
Urban and Rural Production vs Urban and Rural Population
2010 Ukraine 2002 Southern 2010 Southern 2002 Central 2010 Central 2002 Eastern 2010 Eastern 2002 Western 2010 Western2002 Ukraine
7
6
5
4
3
2
1
0
Urban GVA/Rural GVA Urban Population/Rural Population
CHAPTER 1 The urban system: Demographics and Economic Trends
54
Ukraine_2015_nov26.indd 54 2015-11-26 5:14 PM
Region CITY
Population
(2013
estimated)
Population
Ranking (2013)
Firm Ranking
in 2000
Firm Ranking
in 2008
Central Kyiv 2,757,900 1 1 1
Eastern Kharkiv 1,451,028 2 2 2
Western Lviv 730,272 7 3 6
Eastern Donetsk 953,217 5 4 5
Southern Odesa 1,014,852 3 5 4
Southern Dnipropetrovsk 997,754 4 6 3
Southern Zaporizhzhya 770,672 6 7 7
Southern Mikolaiv 496,188 9 8 9
Southern Simferopol 337,285 15 9 8
Eastern Lugansk 425,848 11 10 10
Central Vinnitsya 371,698 12 11 13
Southern Kriviy Rig 656,478 8 12 12
Western Ivano-Frankivsk 226,018 28 13 17
Southern Kherson 299,052 16 14 14
Central Poltava 296,852 17 15 11
Western Rivne 250,333 25 16 23
Central Sumi 269,177 21 17 15
Western Chernivtsi 258,842 23 18 26
Western Chmelnitskiy 264,988 22 19 22
Eastern Mariupol 461,810 10 20 21
CHAPTER 1 The urban system: Demographics and Economic Trends
Table 8 – 20 cities with the highest number of firms in 2000 and 2008
Source: AMADEUS data
This firm-level survey also suggests that economies of scale, urbanization economies, and agglomeration economies play
important roles in the economic performance of firms in cities in Ukraine. Location economies, although weaker, are also
supported by the data. The upper left panel of Figure 38 shows a positive relationship between the productivity of firms
and the number of employees in the firm. This is a sign of (internal) economies of scale, which arise from the ability of
larger firms and plants to better exploit fixed costs69
. Urbanization economies arise from the dynamics of a large number
of different industries and firms located in the same place. The upper right panel of Figure 38 suggests that there is
69 According to the World Development Report 2009, internal economies of scale come mainly from technological factors as well as pecuniary
(being able to purchase inputs at discount values for example).
55
Ukraine_2015_nov26.indd 55 2015-11-26 5:14 PM
indeed a positive relationship between the number of firms in a city and a firm’s profits per employee70
. Urbanization
economies highlight the importance of the sharing mechanism and how knowledge generated in one industry goes beyond
it to improve the performance of firms in other industries as well. The lower right panel shows the relationship between
the average profit per employee of firms and their average industry size71
. The relationship is weaker than the previous
ones, but still positive, suggesting the presence of localization economies, which arise from a high number of firms in
the same industry. Finally, the lower left panel shows a positive relationship between the population density of the city
and firms’ average profit per employee. This is a sign of overall agglomeration economies mentioned previously. These
agglomeration economies most likely come from a combination of the analyzed localization economies, urbanization
economies, and internal economies of scale. These effects have been assessed in the economics literature as potentially
important determinants of development72
.
70 Profits per employee reported throughout Figure 39 are city-wide averages at the firm level.
71 AMADEUS calculates industry size using both the total number of employees and the size of firms assets in the same industry at the
national level. This is an approximation to a measurement of localization economies, which would optimally show the size of the industry in a
single location. Due to data limitations, we have only industry size at the national level.
72 Bazoglu, Nefise. 2008. Cities in Transition: Demographics and the Development of Cities. Philadelphia: Pennsylvania State University, and
Ciccone, Antonio, and Robert E. Hall. 1996. “Productivity and the Density of Economic Activity.” American Economic Review 86 (1): 54–70.
73 The figures used are derived from averages at the city level using the 50 cities with the largest number of observations, as these provide the
least statistical ‘noise’ and greatest reliability
Figure 38 – The performance of firms based on firm, city, and industry characteristics73
Source: Data from AMADEUS on Ukraine firms from 2000-2008
Economies of Scale (2000-2008) Urbanization Economies (2000-2008)
Agglomeration Economies Location Economies
50
40
30
20
10
0
-10
-20
0 0
0
10 1000
1000
30000 40000 50000 60000
20 2000
2000
30 3000
3000
40 4000
4000
50 5000
5000
60 6000
6000
70 7000
7000 8000
80
50
40
30
20
10
0
-10
-20
50
40
30
20
10
0
-10
-20
55
45
35
25
15
5
-5
Averageprofitperemployee(000s)
Profitperemployee(000s)
Industry size
Number of firms in city
Population density
Firm number of employees
Profitperemployee(000s)
CHAPTER 1 The urban system: Demographics and Economic Trends
56
Ukraine_2015_nov26.indd 56 2015-11-26 5:14 PM
CHAPTER 1 The urban system: Demographics and Economic Trends
Analysis of dynamics of economic growth using
night lights data
Urban production has played a fundamental role in the recent economic growth of Ukraine, but from aggregate data
it is difficult to assess how particular cities have performed. No country has been able to achieve prosperity without
both strong urbanization and strong urban economic growth. In Ukraine, this process has not been uniform, and much
economic activity has usually been concentrated in a small number of cities. However, measuring economic activities at
the city level in Ukraine has been challenging, as city level economic activity data has rarely been available. Along with
demographic indicators, this section will use the empirical regularity that there is a strong correlation between emitted
night lights and the economic activity of an urban location in order to illustrate trends about economic production by
Ukrainian cities (and their night lights footprint)74
. This is especially useful since no official city-level GDP data is available
for all cities. Using a subset of 31 cities for which the McKinsey Global Institute reports estimated GDP, the positive
correlation between GDP and night lights for the city is evident (Figure 39). Annex III provides more details on the utility
of using this methodology in the Ukrainian context, while Annex IV presents an additional growth robustness analysis
with variations based on the urban threshold.
Night lights data possess useful analytical characteristics related to their availability, their granularity, and the fact that they
provide information on brightness and location dimensions. The night lights (NLs) data used covers the 1996-2010 period
and is based on spatial observations of Ukrainian cities and the lights they emitted at night. Light is determined to be
urban when it goes beyond a brightness threshold, and this is used to determine urban footprints.
74 Henderson, et al. (2012) (Measuring Economic Growth from Outer Space, American Economic Review, 102) develops a theoretical model that
suggests an optimal way to combine night lights data and available GDP data. It is based on the idea that both pieces of information can exhibit
measurement error, but that there is no reason to assume these errors will be correlated with each other. Henderson, et al. (2011) applies this
to a sample of 170 countries, while Henderson, et al., (2012) (A Bright Idea for Measuring Economic Growth, American Economic Review: Papers
 Proceedings, 101) further develops the approach by providing additional examples of how night lights readings react to documented economic
and social phenomena, and suggests a model that focuses on night lights density. Based on this, Henderson, et al. argues that the night lights
data can be used to proxy GDP growth in settings where GDP data is either of poor quality or entirely unavailable. This approach has been
recently expanded upon in several other papers that confirm the positive relationship between observed night lights and economic activity (See
Alder, 2013; Baum-Snow and Turner, 2012; Baum-Snow, Brandt, Henderson, Turner and Zhang, 2013; Pinkovskiy, 2013; and Storeygard, 2013).
Figure 39 – There is a strong positive correlation between urban GDP and night lights
Source: McKinsey Global Institute (city GDP data) and author’s calculations.
57
Ukraine_2015_nov26.indd 57 2015-11-26 5:14 PM
!
!
!
RivneKovel'
Poltava
Kherson
Cherkasy
Zhytomyra
Ternopil'
Chernihiv
Chernivtsi
Simferopol'
Khmel'nyts'kyz
Ivano-frankivs'k
0 125 250 375 500
Kilometers
Kharkiv
ROMANIA
RUSSIAN FEDERATION
BELARUS
POLAND
MOLDOVA
HUNGARY
Sumy
Kyiv
Odesa
L'viv
RivneKovel'
Poltava
Kherson
Donets'k
Luhans'k
Cherkasy
Uzhhorod
Vinnytsya
Zhytomyra
Ternopil'
Mykolayiv
Chernihiv
Kirovohrad
Chernivtsi
Simferopol'
Zaporiyhzhya
Khmel'nyts'kyz
Dnipropetrovs'k
Ivano-frankivs'k
Figure 40 – Night lights and urban footprints in Ukraine 1996 and 2010
Source: McKinsey Global Institute (city GDP data) and author’s calculations.
!
!
!
!
!
!
!
!
!
!
!
!
!
!
!
!
!
!
!
!
!
!
!
!
!
Kyiv
L'viv
RivneKovel'
Poltava
Kharkiv
Kherson
Donets'k
Cherkasy
Uzhhorod
Vinnytsya
Zhytomyra
Ternopil'
Mykolayiv
Chernihiv
Kirovohrad
Chernivtsi
Simferopol'
Zaporiyhzhya
Khmel'nyts'kyz
Dnipropetrovs'k
Ivano-frankivs'k
0 125 250 375 500
Kilometers
Kharkiv
ROMANIA
RUSSIAN FEDERATION
BELARUS
POLAND
MOLDOVA
HUNGARY
Sumy
Kyiv
Odesa
L'viv
RivneKovel'
Poltava
Kherson
Donets'k
Luhans'k
Cherkasy
Uzhhorod
Vinnytsya
Zhytomyra
Ternopil'
Mykolayiv
Chernihiv
Kirovohrad
Chernivtsi
Simferopol'
Zaporiyhzhya
Khmel'nyts'kyz
Dnipropetrovs'k
Ivano-frankivs'k
Urban Footprint 1996
CHAPTER 1 The urban system: Demographics and Economic Trends
58
Ukraine_2015_nov26.indd 58 2015-11-26 5:14 PM
CHAPTER 1 The urban system: Demographics and Economic Trends
NLs measurements are available at a very fine scale in two dimensions: light intensity and location of that intensity. As
a consequence, they are very useful in analyzing the evolution of economic activity over time and space. Additionally, as
indicated in Section 2, as individual cities in close proximity grow towards each other to constitute an agglomeration,
their NLs footprints can likewise merge and reflect that agglomeration. NLs analysis treats agglomerations as a single
city or urban entity. In 2010 Ukraine had 23 agglomerations based on the NLs definition.
Visual analysis of NLs urban footprints at the national level provides insights about the location of major urban centers
and their dynamics over time. Figure 40 shows the urban footprints detected by NLs in 1996 and 2000 in Ukraine. Three
patterns can be observed: (i) a strong concentration of the urban centers in the East of the country; (ii) the growing and
expanding footprint of the Kyiv agglomeration; and (iii) a growth in the number of urban areas – measured by NLs – in
the West and a decline in the East. This tracks with the demographic analysis presented in Section 2 showing a sharp
population decline of cities located in the Eastern region and a population increase in the concentration of cities around
Kyiv and in the Western Region.
A visual representation of compound growth of NLs suggests an important shift from the Eastern and Southern Regions
towards the Western and Central Regions.75
Figure 41 shows the percentage growth of night lights in the Ukrainian
territory between 1996 and 2010. This shift of lights from East to West might have multiple causes. First, as discussed
in Sections 1 and 2, two decades ago, the East of the country presented high urbanization levels (more than 70 percent),
as well as a concentration of most of the country’s industry. By contrast, the West presented lower urbanization levels
(around 50 percent) and remained a predominantly rural region. These characteristics, especially in the West, have been
changing. Both the Western and the Central region have had Ukraine’s greatest urbanization rates. This does not mean
that they are currently more urbanized than the Eastern and Southern regions in absolute terms; rather, while starting
at lower urbanization levels, their rates of urbanization have been greater. Second, the rural population has migrated
its economic activity from rural to urban at greater rates in the Western and Central regions too (see Section 3). As a
result, the relative growth in urban production has been much greater, which could explain, at least partially, the striking
change observed in Figure 41.
Another important aspect of this observed shift is the heterogeneous relationship found between night lights levels and
economic activity across regions. The second column of Table 4 of Annex III shows that, when elasticity is allowed to
vary across regions76
, it is significantly different between them. This shows that, all else being equal, the region where a
city is located affects the relationship of NLs to economic activity (i.e., how much light a city emits per unit of economic
activity). For example, a city in a region with a higher NLs GVA elasticity will exhibit higher growth in GVA for a given
growth in NLs compared to a city in a region with lower NLs GVA elasticity. The regional differences in NLs and GVA
elasticity can be explained by differences in sector composition, population and production density, and policies related
to energy. Regional differences also show up when considering only urban economic activity and lights.
The elasticity between NLs and economic activity was largest for the Eastern and Southern regions77
, i.e., for similar growth
in NLs levels, economic activity was higher in the East and South. The opposite was the case for the West and Central
regions; for these regions, an additional unit of light yielded fewer units of economic activity. This explains statistically
why the higher compound growth in lights in these two regions (see Figure 41) was not necessarily accompanied by
higher growth in economic activity. As discussed previously, one economic reason for this heterogeneity is likely due to
the differences in the initial distribution of sectors (the East being initially much more urban and industrial while Central
region being more service-oriented).
Observing the evolution of economic activity at the oblast level also sheds some light on how the sector and urban
population distribution shifts might have affected the NLs trend from East to West observed in Figure 42 (left panel).
This figure shows that the urban production, as measured in GVA, is still concentrated largely in the oblasts of the
Eastern region. However, over the period 2002-2010, growth is clearly evident in the oblasts of the Western and Central
75 Notice that in Figure 42 each pixel shows compound percentage growth relative to an initial condition, rather than absolute growth or
absolute levels.
59
Ukraine_2015_nov26.indd 59 2015-11-26 5:14 PM
regions (Figure 42 right panel). At the same time, urbanization rates showed steady growth since 1989 in the Central
and Western regions (See Figure 43). Urban production as a measure of GVA is often higher than rural production. Thus,
urbanization may bring an increase in production. Again, despite the fact that oblasts showing higher labor productivity
are concentrated in the Eastern part of the country(Figure 42, left panel), as captured by real GVA per worker, Central
and Western regions have shown the greatest increases (Figure 44, right panel). Overall, these data suggest that the East
to West trend observed in Figure 44 is mainly dynamic (corresponds to changes over time), and that these dynamics
might be driven by an increasingly important urban sector in the West and Central regions. Still, the West has quite a
ways to go before it reaches the East’s levels of production and urbanization.
76 Bickenbach, et. al. (2013) (Night Lights and Regional GDP, Kiel Institute for the World Economy Working Papers) uses data on Brazil,
India, United States and some countries in Western Europe to show that the relationship between economic activity and night lights is not
unchanging when looking at sub-national or regional units.
77 Comparisons between regions are made with respect to an omitted category, in this case the Southern region.
Figure 41 – Compound growth/decline in NLs in Ukraine between 1996 and 2010
Compound Growth Rate, 1996-2010
CHAPTER 1 The urban system: Demographics and Economic Trends
60
Ukraine_2015_nov26.indd 60 2015-11-26 5:14 PM
CHAPTER 1 The urban system: Demographics and Economic Trends
Figure 42 – Urban GVA production at the oblast level
Figure 43 – Urbanization shows steady growth mainly in the Central and Western regions
Figure 44 – Real GVA growth per worker shows strongest increase in the Western and Central region
61
Luts’kLuts’k
Luts’kLuts’k
Luts’kLuts’k
 0.80
0.81 - 1.00
1.01 - 1.20
1.21 - 1.40
 1.41
Real GVA
weighted by mean
Real GVA perWorker, by Oblast, 2010
 30
31 - 40
41 - 50
51 - 60
 61
Percent change
GVA
Real GVA perWorker Growth, 2002-2010
 0.15
0.16 - 0.30
0.31 - 0.45
0.46 - 0.50
 0.50
Urbanization Rate
Urbanization Rates by Oblast, 2000-2011
 0.15
0.16 - 0.30
0.31 - 0.45
0.46 - 0.50
 0.50
Urbanization Rate
Urbanization Rates by Oblast, 1989-2000
 0.40
0.41 - 0.60
0.61 - 0.80
0.81 - 1.00
 1.00
Real GVA
weighted by mean
Real Urban GVA by Oblast, 2010
16-18
19-32
33-43
44-60
61-75
Percent Change GVA
Real Urban GVA Growth, 2002-2010
Ukraine_2015_nov26.indd 61 2015-11-26 5:14 PM
First typology of Ukrainian cities using NLs: found,
appear, disappear, and missed cities
A first typology of cities was created by matching urban footprints – based on NLs data – and the official location of
Ukraine’s 458 cities using data for 1996 and 2010. Of those settlements defined as cities by the Ukrainian government,
most produce enough light to go beyond the urban threshold (discussed in Footnote 17 above). Others, however, due to
their relative low scale of economic activity, did not pass this threshold in the two years analyzed. Based on this threshold,
a first typology of cities was created which classified all 458 cities into one of four categories: Found, Appear, Disappear,
or Missed (refer to BOX 7 below for detailed definitions). Two caveats are necessary concerning conclusions reached from
this typology classification. First, the analysis is made using night lights as a proxy for economic activity, although the
night lights data is not used to forecast individual, city-level GDP78
. Annex III shows that night lights data and economic
activity have a strong relationship, but the correlation is not exact. As such, additional demographic and economic city-
level indicators, such as firm-level data, are used to complement the analysis. Second, the elasticity between night lights
and economic activity is estimated to be different between the regions (also discussed in Annex III). As a consequence,
conclusions drawn from comparisons of cities in different regions based solely on night lights data are less reliable than
comparisons for a single city across time.
78 Forecasting GDP for specific cities can be problematic because the methods used to derive the urban boundaries for individual cities ignore
the problem of “overglow” (which causes light from a city to appear to bleed out beyond the boundary itself). This problem is a potential source
of measurement error, which can become exacerbated the more fine the spatial resolution employed to obtain night lights data to derive GDP
growth estimates.
Found cities are settlements that produced NLs in both 1996 and 2010 that go beyond the urban threshold; as a
consequence, they are considered cities in both periods. We can calculate a series of indicators for these Found
cities that allow us to get a better sense of the spatial and total evolution of their economic activity over time.
254 (55%) of Ukraine’s 458 cities were classified in this category; their average population was 93,445 in 2013.
Appear cities are settlements, which at the first date (1996) did not meet the “city” threshold by NLs standards,
but had done so when measured in 2010. They were 50 such cities in 2013. Conversely, Disappear cities are
settlements, which in 1996 were classified as cities by NLs standards, but by 2010, no longer fit the standard.
37 (8%) of the cities were classified in this category.
Missed cities are settlements which did not meet the threshold for classification as cities by NLs standards
in 1996 or 2010. 116 (25%) cities were in this category. These cities may be growing or declining in terms of
economic activity, but do not produce enough light to be considered an urban area. The average population of
these Missed cities was 18,000 in 2013, which indicates that this category comprises many small towns (small
towns refers to settlements with less than 10,000 inhabitants. See Section 2 for these definitions).
According to these criteria, 55 percent of Ukrainian cities were classified as Found, 11 percent were Appear, 8 percent
were Disappear, and 25 percent were Missed. Missed cities are small – with populations ranging from 1,000 to 31,196 –
which suggests that the NLs basis for the typology’s “city” standards is valid and that these are not important economic
centers (See Figure 45 and Figure 46). By comparison, Found cities have an average population of 97,663, which suggests
that NLs data indeed represents the urban settlements in the country.
BOX 7 – A FIRST TYPOLOGY OF UKRAINE’S CITIES
CHAPTER 1 The urban system: Demographics and Economic Trends
62
Ukraine_2015_nov26.indd 62 2015-11-26 5:14 PM
Missed cities are spread across all regions, but the Eastern region held the lowest number. Most of the Missed cities are
located in Lviv and Odessa. Some examples of Missed cities are: Bilozerske (Donetsk) in the Eastern region, Nosivka
(Cernihiv) in the Central region, Rozhyshche (Volyn) in the Western region, and Nova Odesa (Mykolaiv) in the Southern
region.
The Eastern region has the highest number of Disappear cities (45 percent of all Disappear cities), followed by the Central
and Southern regions with 27 and 24 percent, respectively (See Figure 47 and Figure 48). Some oblasts have been hit
harder by the decline of cities than others. Luhansk Oblast alone has 24 percent of all Disappear cities, Donetsk has 19
percent, and Zaporizhia 11 percent. Some examples of Disappear cities are: Zymohiria (Luhansk) in the Eastern region,
Ochakiv (Mykolaiv) in the Southern region, Khyriv (Lviv) in the Western region, and Dovbysh in the Central region.
The Western region dominates in terms of Appear cities, having 31 of Ukraine’s 50 such cities (60 percent) based on
NLs standards in 2010. The Central region has the next highest amount, with 17 Appear cities. In the Western region,
the cities are concentrated in a few oblasts—10 cities in Lviv oblast alone, six in Ivano-Frankivsk, and five in Chernivtsy.
Some examples of Appear cities are: Gorokhiv (Volyn) and Novoselytsia (Chernivtsy) in the Western region, and Biliaivka
(Odessa) in the Southern region.
CHAPTER 1 The urban system: Demographics and Economic Trends
Figure 45 – Distribution of found, appear, disappear, and missed cities by population in 2013
Figure 46 – Distribution of missed cities by population in 2013
Source: Ukraine Statistics Department Data
Source: Ukraine Statistics Department
Distribution of missed cities across city sizes
100%
90%
80%
70%
60%
50%
40%
30%
20%
10%
0%
Small Towns
(10k)
Mid-size Towns
(10k-20k)
Large Towns
(20k-50k)
Small Cities
(50k-100k)
Mid-size Cities
(100k-500k)
Major Cities
(500k)
Found Appear Disappear Missed
Small Towns
(10k)
40%
Mid-size Towns
(10k-20k)
52%
Others
(20k)
8%
63
Ukraine_2015_nov26.indd 63 2015-11-26 5:14 PM
Figure 47 – Distribution of found, appear, disappear, and missed cities by geographic location (2013)
Figure 48 – Distribution of found, appear, disappear, and missed cities (2013)
Source: Ukraine Statistics Department
Found Appear Disappear Missed
Eastern Southern Central Western Total
100%
90%
80%
70%
60%
50%
40%
30%
20%
10%
0%
Cernihiv
Cernivcy
Charkiv
Cherkasy
Crimea
Dnipropetrovsk
Donetsk
Ivano-Frankivsk
Kherson
Khmelnytskyi
Kiev
Kirovohrad
Luhansk
Lviv
Mykolaiv
Odessa
Poltava
Rivne
Sevastopol
Sumy
Ternopil
Vinnytsia
Volhynia
Zakarpattia
Zaporizhia
Zhytomyr
KievCity
100%
90%
80%
70%
60%
50%
40%
30%
20%
10%
0%
CHAPTER 1 The urban system: Demographics and Economic Trends
64
Ukraine_2015_nov26.indd 64 2015-11-26 5:14 PM
CHAPTER 1 The urban system: Demographics and Economic Trends
79 A third dimension is determined by “extensive growth,” which measures the growth of lights in the periphery. It is calculated by establishing
the periphery as the portion of the urban footprint that exists in the second period but did not exist in the first, and then comparing the
amount of light emitted by this periphery in both periods. This interpretation, however, is a little less intuitive for the case of shrinking cities, in
which the periphery is disappearing as the city shrinks. An analysis employing this fourth dimension can be found in Annex VI.
80 Two years of NLs are required to do this analysis, so cities classified as Disappear, Missed, and Appear are excluded from it.
81 This type only includes two cities: Donetsk and Zaporizhia. Thus, the section abstains from drawing strong conclusions about this type since
they would only be based upon two observations.
Second typology of Ukrainian cities using NLs:
identifying growing and declining cities
A second city typology classified cities across two dimensions – change in their NLs urban footprint and change in their
NLs intensity – as a proxy of economic activity.79
NLs data was used to assess whether economic activity was increasing
or decreasing, as well as to determine whether a city’s footprint was growing or shrinking in area. These two dimensions
make the analysis using NLs unique and were the basis for a second typology of cities. For this typology, a city’s “baseline”
footprint and light intensity was compared to that of a following analyzed year. In this case the comparison was made
between 1996 (T0) to 2010 (T1)80
. The typologies were built as described in BOX 8, and cities were classified according
to the following types:
Type 1 cities (in BLUE) are cities presenting a thriving urban core (growing light intensity) and growing urban footprint.
Type 2 cities (in GREEN) are cities presenting a dimming urban core (declining light intensity) and shrinking urban
footprint.
Type 3 cities (in BLACK) are cities presenting a dimming urban core and expanding urban footprint.
Type 4 cities (in RED) are cities presenting a thriving urban core and shrinking urban footprint81
.
The second typology was calculated by looking at the combination of light intensity change and urban footprint
area change for each city, as explained below, between 1996 and 2010:
	 - Urban footprint area change corresponds to the change in area of what is considered the urban
footprint by NLs standards in T0 against what is considered the area of urban footprint in T1. Area Change is
estimated as (B – A) / A.
	 - Intensity change refers to the change in brightness in the urban core (footprint in T0) between these
two years. Intensive change is estimated as Y – A.
BOX 8 – A SECOND TYPOLOGY OF UKRAINE’S CITIES
65
CITY FOOTPRINT (1996 - 2010)
T0NTL
A
Z
T0footprint
T1footprint
The columns represent the summed
nighttime lights values for the
identified footprint
T1NTL
Y
B
Ukraine_2015_nov26.indd 65 2015-11-26 5:14 PM
There is a strong positive correlation between area growth and intensive growth, which is exactly what the second
typology intends to capture (See Figure 49). A strong correlation means that in most cases when economic activity
increased in the city’s core, cities also tended to grow in area or that when economic activity decreased in the city’s
core, cities also tended to shrink in area. The first case, corresponding to Type 1 cities, are cities that are both growing
in area and in the amount of lights emitted by their cores. Again, this implies a thriving core and a spillover effect that
leads to a growing periphery. The second case, corresponding to Type 2 cities, are those which have a core with dimming
NLs intensity and a shrinking urban NLs footprint. For Type 2 cities, not only are NLs values in the city’s core declining,
but their area is also shrinking; i.e., in 2010 some of the urban footprint no longer has NLs above the urban threshold. The
positive correlation is not observed in Type 3 cities, which present a decrease in NLs activity in the core of the city, but
an expansion of this activity in the new surrounding areas. This is a sign of sprawl, but also of a growing importance of
areas that previously were considered urban by NLs standards. Finally, Type 4 cities show a densification of its economic
activity, represented by a thriving core, in terms of night lights, but a shrinking NLs footprint. Table 9 presents summary
statistics for each city type. Annex V presents the full list of Ukrainian cities classified according to this typology.
Type 1 cities – with a thriving core and expanding urban footprint – are on average larger, declining less in population
terms, and more productive than other types. They have on average 176,300 inhabitants and although – on average –
they are still experiencing demographic decline, their decline is the lowest compared to the other types. They present also
the highest levels of economic activity per capita, as measured by night lights divided by the city population, suggesting
that these cities are most productive. Once more, recall that night lights are used to determine typologies, but that they
also portray economic activity to some extent. In addition, these cities have a higher average total economic growth
(585 percent), captured by night lights data than the rest suggesting that these cities are the true growth engines in the
country. However, the simultaneous growth of the urban footprint with the observed demographic decline suggests that
these cities are sprawling82
. Examples of Type 1 cities are: Odessa, Lutsk, Kyiv, Kharkiv, and Lviv. Around 22 percent of
cities in Ukraine fall under this type.
82 Sprawling is a hypothesis based on the growth of the urban footprint despite population decline. However, the NLs footprints do not
correspond to the city’s boundaries and therefore population data might not correspond to the population living inside the urban footprint
defined through NLs.
Figure 49 – Changes in NLs urban footprint vs. changes in NLs intensity in the urban core
CHAPTER 1 The urban system: Demographics and Economic Trends
66
Periphery expansion and intensive growth. Ukraine 1996-2010
percentage intensive growth
percentageareagrowth
Type 1Type 3
Type 2 Type 4
Ukraine_2015_nov26.indd 66 2015-11-26 5:14 PM
CHAPTER 1 The urban system: Demographics and Economic Trends
83 Only one city, Donetsk, located in the oblast of the same name, is not in this typology as it presents a negative area change and a positive
intensity growth.
84 This type only includes two cities: Donetsk and Zaporizhia. Thus, the section abstains from drawing strong conclusions about this type since
they would only be based upon two observations.
Type 2 cities are, on the contrary, declining in all aspects – with decreasing economic activity - as captured by night lights
in both the core and the periphery – a shrinking urban footprint, and declining population. These cities are smaller than
thriving Type 1 cities; their average population is 54,000 inhabitants. In addition to experiencing a decline in economic
activity, these cities present a sharp decline in population – with 0.54 percent annual decline on average – and have
lowers levels of productivity than thriving Type 1 cities measured by NLs per capita. Examples of a Type 2 city are:
Dnipropetrovsk, Hirnyk, and Kramatorsk. The majority of cities in Ukraine (53 percent) fall under this type.
Growing area Shrinking area
+ Intensity growth
Type 1: Thriving core, expanding area Type 4: Thriving core, shrinking area44
Mean (Std dev) Mean (Std dev)
Population 2013 (000s) 176.3 (411.1) 861 (129)
Average annual population growth
(1989-2013)
-0.20 % (.477) -0.59% (0.041)
Total NLs value
(000s of NLs units) in 2010.
13.49 (37.01) 69.11 (44.80)
NLs per capita
(000s of NLs units) (2010)
0.065 (.062) 0.077 (0.048)
NLs growth
(% Growth of NLs units) (1996-2010)
321% (4.36)
Examples: Odessa, Lutsk, Kyiv, Kharkiv,
Lviv
142.6% (1.23)
Examples: Donetsk, Zaporizhia
- Intensity growth
Type 3: Dimming core, expanding area Type 2: Dimming core, shrinking area
Mean (Std dev) Mean (Std dev)
Population 2013 (000s) 49.1 (80.4) 54.0 (115.3)
Average annual population growth
(1989-2013)
-0.56% (.584) -0.57% (.541)
Total NLs value
(000s of NLs units) in 2010.
2.62 (5.89) 2.72 (8.68)
NLs per capita
(000s of NLs units) (2010)
0.032 (.069) 0.043 (.102)
NLs growth
(% Growth of NLs units) (1996-2010)
142% (.056)
Examples: Mykolaiv, Sumy, Kirovohrad
-15400% (314)
Examples: Dnipropetrovsk, Hirnyk,
Kramatorsk.
Table 9 – Typology of cities based on NLs observations between 1996 and 2010: selected statistics
67
Ukraine_2015_nov26.indd 67 2015-11-26 5:14 PM
Type 3 cities, which represent a dimming core and an expanding NLs footprint, have experienced the fastest population
decline and present the lowest levels of productivity. These cities show a 0.63 percent annual population decline on
average (while numerically close, the statistical impact of this rate is significantly lower than that observed in cities of
Type 2). The growth of the urban footprint accompanied by the observed demographic decline suggests that these cities
are sprawling. Examples are Mykolaiv, Sumy, and Kirovohrad. Approximately 24 percent of cities in Ukraine fall under
this type.
There are only two cities in the final category of Type 4 cities: Donetsk and Zaporizhia. These cities are historically large
cities that have recently seen their footprint shrink. At the same time, economic activity, as captured by night lights
data, has increased in the core. This suggests a densification of economic activity. Despite showing declining population,
this densification could induce agglomeration economies that further improve their economic performance.
There are important demographic and economic differences captured by this second typology. Table 9 shows the averages
of indicators for each city type. The differences suggest that the combination of night light intensity and growth that
determine this second typology may also correspond to its population and economic dynamics. Figure 50 shows that the
distribution of city sizes is different between types. Type 1 cities are overall larger, while Type 2 has the largest share of
small towns. The dynamics among the types also vary. Figure 51 shows that Type 1 cities have more cities with positive
growth, while many Type 2 and Type 3 cities are declining in population more than even the national average.
85 Type 4 is excluded as it has only two cities, Donetsk and Zaporizhia. However, both are major cities.
Figure 50 – The distribution of city sizes varies across types in the second typology; type 1 cities
are overall larger85
Type of city according to size
1. Thriving core, expanding area 3. Dimming core, expanding area2. Dimming core, shrinking area
Small Towns (10k) Mid-size Towns (10k-20k) Large Towns (20k-50k)
Small Cities (50k-100k) Mid-size Cities (100k-500k) Major Cities (500k)
100%
90%
80%
70%
60%
50%
40%
30%
20%
10%
0%
CHAPTER 1 The urban system: Demographics and Economic Trends
68
Ukraine_2015_nov26.indd 68 2015-11-26 5:14 PM
CHAPTER 1 The urban system: Demographics and Economic Trends
86 Type 4 is excluded as it has only two cities, Donetsk and Zaporizhia. Both are in the growth category of declining but less than national
average.
87 Recall that growth in night lights intensity tends to also reflect growth in intensity of economic activity in the city.
The characteristics used to identify this second typology also have a strong relationship to population dynamics. Figure
52 shows that almost all Type 2 cities are experiencing negative population growth as well as negative area growth. The
other two types are split between negative and positive population growth, meaning that some cities continue to expand
in area despite their population decline. Similarly, Figure 52 shows that cities of Type 2 show overall negative growth in
intensity87
and negative growth in population.
The other two types are split between positive and negative population growths. Figure 52 and Figure 53 show that a
classification based on NLs groups cities into meaningful clusters in the sense that they also share some demographic
characteristics. Overall, the shrinking footprints imply a loss of population. However, in some cases there could be
population loss despite increases in area (in Types 1 and 2), which suggests a sort of sprawling; this dynamic affects a
fairly large number of cities. Similarly, although a minority, some cities show population growth accompanied by a decline
in economic activity in the core as measured by reduced intensity growth, as well as some cities that present population
decline with a significant increase in the light emitted at the core (mainly cities of Type 1). In the later, shrinking does
not seem to come at the expense of economic growth. One possible explanation for this is that the city was oversized
and is moving towards a new population equilibrium (lower population) that is linked to lower congestion costs which in
turn lead to an increased productivity.
Figure 51 – The distribution of cities by economic growth varies across types in the second
typology; type 1 cities have more cities with positive growth86
1. Thriving core, expanding area 3. Dimming core, expanding area2. Dimming core, shrinking area
100%
90%
80%
70%
60%
50%
40%
30%
20%
10%
0%
Declining more than national average Declining but less than urban average
Declining but less than national average Positive growth
Type of city according to growth category
69
Ukraine_2015_nov26.indd 69 2015-11-26 5:14 PM
Figure 52 – The distribution of cities by economic growth varies across types in the second
typology; type 1 cities have more cities with positive growth
Periphery expansion and population growth 1996-2010
CHAPTER 1 The urban system: Demographics and Economic Trends
70
Annual percentage population growth
Annualpercentageareagrowth
Figure 53 – Intensity of night lights has a strong relationship to population dynamics
Intensive growth and population growth
Annual percentage intensive growth 1996-2010
Annualpercentagepopulationgrowth
Ukraine_2015_nov26.indd 70 2015-11-26 5:14 PM
Agglomerations: important engines of growth
Agglomerations – groupings of individual cities that function as a single city due to the proximity of and interaction
between their housing, labor, and commercial markets and whose NLs footprints merge – are considered as one urban
entity under the NLs analysis. In total, Ukraine has 23 agglomerations that are composed of 79 cities, an average of
four cities per agglomeration. The figure below presents Kyiv’s agglomeration and the growth of its NL urban footprint
from 1996 until 2010. As can be seen, some cities that were separate cities surrounding Kyiv in 1996 merged to produce
a single urban footprint by 2010. Table 10 below presents the full list of Ukraine’s agglomerations and their respective
population totals.
CHAPTER 1 The urban system: Demographics and Economic Trends
Figure 54 – The distribution of types of cities varies by region;the western region has the majority
of thriving (type 1) cities88
As expected, the second city typology also reveals differences in the distribution of city types across regions (Figure
54). While 76 percent of the Western region’s cities are thriving (Type 1), only 7 percent of Eastern region cities can be
classified as such. In contrast, 81 percent of the Eastern region’s cities are in the Type 2 category. The southern region
also has many cities in that category, and has the least Type 3 cities. The Central region has the largest share of Type 3
cities, where economic activity is declining in the core but growth is occurring in the urban footprint.
88 Type 4 has only two cities, Donetsk and Zaporizhia. Donetsk is in the Eastern region, while Zaporizhia is in the Southern region.
Figure 55 – Kyiv’s agglomeration 1996-2010
Type by region
1. Thriving core, expanding area
3. Dimming core, expanding area
4. Thriving core, shrinking area
2. Dimming core, shrinking area
Western Eastern Central Southern
100%
90%
80%
70%
60%
50%
40%
30%
20%
10%
0%
01 2.5 25 75 100
Kilometers
1996
2010
Chernihiv
71
Ukraine_2015_nov26.indd 71 2015-11-26 5:14 PM
Main City Oblast Cities in Agglomeration
Population of
agglomeration 2013e
Kyiv Kyiv 9 3171830
Kharkiv Charkiv 6 1620930
Donetsk Donetsk 8 1506200
Odessa Odessa 2 1074570
Dnipropetrovsk Dnipropetrovsk 2 1017250
Lviv Lviv 4 765901
Luhansk Luhansk 2 432483
Sevastopol Sevastopol 2 354565
Horlivka Donetsk 1 353497
Dniprodzerzhynsk Dnipropetrovsk 2 351950
Cherkasy Cherkasy 2 303168
Kramatorsk Donetsk 4 297665
Sieverodonetsk Luhansk 4 281903
Rivne Rivne 2 274902
Ivano-Frankivsk Ivano-Frankivsk 1 235515
Lutsk Volhynia 2 234147
Drohobych Lviv 4 162527
Alchevsk Luhansk 3 144807
Stakhanov Luhansk 3 139474
Krasnoarmiysk Donetsk 3 125239
Krasnodon Luhansk 2 65344
Nova Kakhovka Kherson 2 58853
Debaltseve Donetsk 2 38126
CHAPTER 1 The urban system: Demographics and Economic Trends
Table 10 – Ukraine’s agglomerations: merged NL urban footprints (2013)
72
Ukraine_2015_nov26.indd 72 2015-11-26 5:14 PM
89 Type 4 has only two cities, Donetsk and Zaporizhia. Donetsk is part of an agglomeration (it is also its main city); Zaporizhia is an individual
city.
CHAPTER 1 The urban system: Demographics and Economic Trends
Agglomerations are particularly important engines of growth. 43 percent of Ukraine’s agglomerations experienced
positive economic growth according to NLs data compared to only 22 percent of individual cities. Total production
(as measured by total NLs in the urban footprint) of agglomerations was 14 times higher - on average – than that of
individual cities. Part of this is of course due to their relative greater scale. However, labor productivity (measured by NLs
per capita) is also much higher on average (17 percent higher in agglomerations than in individual cities) with a significant
difference between the means; and spatial productivity (measured by NLS by km2) is also higher (100 percent higher in
agglomerations relative to individual cities). All of these differences are statistically significant. Additionally, almost all
urban economic growth – as measured by total NLs – is concentrated in the growing agglomerations, suggesting they
are the true engines of growth in the country. Kyiv, Kharkiv, Donetsk, and Lviv are the fastest growing agglomerations
of NLs; Dniprodzerzhynsk, Dnipropetrovsk, and Kramatorsk are the fastest declining.
There is also a close correlation between agglomerations and types of cities (See Figure 56). 40 percent of agglomerations
are Type 1, as opposed to 22 percent of individual cities. By contrast, cities are more likely to be classified as Type 3,
i.e., dimming and expanding, if they are individual cities: nine percent of agglomerations are Type 3, while 24 percent
of individual cities are. Type 2 cities are a little more evenly distributed (50 percent of agglomerations and 53 percent
of individual cities). Of the two cities categorized as Type 4, Donetsk is an agglomeration. Consequently, in this case,
the analysis utilizing night lights data strongly supports the conclusions made in Section 2 that agglomerations are the
country’s centers of growth.
Figure 56 – Distribution of agglomerations and individual cities by city type; agglomerations are
disproportionately thriving (type 1)89
Type of city for individual cities and cities that belong to an agglomeration
Agglomeration Single city
1. Thriving core, expanding area
3. Dimming core, expanding area
4. Thriving core, shrinking area
2. Dimming core, shrinking area
100%
90%
80%
70%
60%
50%
40%
30%
20%
10%
0%
73
Ukraine_2015_nov26.indd 73 2015-11-26 5:14 PM
CHAPTER 1 The urban system: Demographics and Economic Trends
Built-up areas
Built-up areas are another spatial measure of economic growth of great importance. These areas indicate the presence
of population and corresponding economic activity, although the dynamics of built-up areas may not follow these others.
For example, since built residences and infrastructure is durable, it can remain even after population has declined.
Similarly, policies that support building could increase the observed built-up area, while the same area sees its economic
activity move away.
Ukraine has shown a large increase in built-up areas despite its population decline. The Global Human Settlement Layer,
developed by the GLOB-HS and E-URBAN teams, provides accurate measurements of built-up areas. Based on this data,
Table 11 shows information on built-up areas for the 40 countries with the highest increases over the last 40 years.
Ukraine ranks 5th
, with 76,202 square kilometers added to the built-up area foundation. This is striking, given that during
the same period the country experienced negative population growth; in fact, Ukraine and Romania are the only two
countries in this ranking that registered negative population growth. As a consequence, Ukraine presents the highest
rate of built-up area per person. Some of the policies that motivated the building of homes during the Soviet era have
been previously discussed in Section 2, but the growth of these built-up areas in Ukraine continued after independence.
This is demonstrated by the fact that Ukraine occupies 4th
in the world in producing new built-up areas over the last 15
years (See Figure 57)
Figure 57 – Ukraine is 4th
in absolute number of new built-up areas over the last 15 years
50,100,000,000
45.100.000.000
40.100.000.000
35.100.000.000
30.100.000.000
25.100.000.000
20.100.000.000
15.100.000.000
10.100.000.000
5.100.000.000
100.000.000
China
UnitedStates
India
Russia
Ukraine
Indonesia
Germany
Japan
Brasil
France
Turkey
Mexico
Italy
Poland
Nigeria
Vietnam
SouthAfrica
Spain
UnitedKingdom
Thailand
Pakistan
Iran
Canada
Burma
Uzbekistan
Philippines
Algeria
Argentina
Iraq
Egypt
Ethiopia
Bangladesh
DRCongo
Morocco
Columbia
Korea,South
Sudan
Uganda
Tanzania
Kenya
Afghanistan
Peru
built-up 2000-2014
New built-up areas 2000-2014
Source: Global Human Settlements Layer – European Commission
74
Ukraine_2015_nov26.indd 74 2015-11-26 5:14 PM
CHAPTER 1 The urban system: Demographics and Economic Trends
Table 11 – Top global increment of built-up last 40 years
90 Monitoring of Execution of the Master Scheme of Territorial Development of Ukraine (Law).
This striking growth in construction could represent a response to the lifting of long-standing limitations on construction
as well as a strong focus of household investments in the real estate sector. Current economic trends (Figure 58) do
not seem to justify the strong growth in built-up areas, suggesting that this growth is happening as a consequence of
institutional changes and current policies. Several characteristics of the Ukrainian housing market are relevant here. First,
the many restrictions on construction that existed during the Soviet era prevented Ukrainians from having access to a
wider array of housing choices. Despite high urbanization levels, many families still shared residences at the beginning of
the 1990s. Construction followed the elimination of many of these restrictions, which included limitations on the size of
structures built in rural areas, on construction of new urban residential units outside of the cooperative system, and on
construction of commercial buildings. Second, the influx of remittances provided a new source of capital to finance new
housing projects to meet public demand. Finally, with a local financial sector that does not provide abundant investment
opportunities, real estate has been the main sector of investment or households in Ukraine. This reality further motivated
residential and commercial construction.90
Country GHSL built-up areas (sq km) WB population (millions of persons)
BU surface per capita
(m2
/person)
1975 1990 2000 2014 2014-1975 1975 1990 2000 2013
2013-
1975
1975 1990 2000 2004
United States 66,522 93,653 128,794 171,857 105,335 215.97 249.62 282.16 316.13 100.16 308.0 375.2 456.5 543.6
China 33,580 47,251 66,370 109,782 76,202 916.40 1135.19 1262.65 1357.38 440.99 36.6 41.6 52.6 80.9
India 10,176 14,051 19,285 39,898 29,722 622.23 868.89 1042.26 1252.14 629.91 16.4 16.2 18.5 31.9
Russian
Federation
21,139 29,997 40,147 50,479 29,340 134.20 148.29 146.60 143.50 9.30 157.5 202.3 273.9 351.8
Ukraine 12,018 16,367 22,937 33,239 21,222 48.76 51.89 49.18 45.49 -3.27 246.5 315.4 466.4 730.7
Germany 11,875 16,423 21,983 28,633 16,758 78.67 79.43 82.21 80.62 1.95 150.9 206.8 267.4 355.2
Brazil 16,797 19,950 27,572 33,159 16,362 108.22 149.65 174.50 200.36 92.14 155.2 133.3 158.0 165.5
Indonesia 11,532 14,078 18,789 27,218 15,686 129.21 178.63 208.94 249.87 120.66 89.3 78.8 89.9 108.9
France 8,245 11,714 15,894 21,256 13,020 54.03 58.41 60.91 66.03 12.00 152.6 200.5 260.9 322.1
Japan 9,335 12,483 16,294 22,106 12,771 111.94 123.54 126.87 127.34 15.40 83.4 101.0 128.4 173.6
Mexico 6,343 9,350 13,295 18,047 11,704 61.71 86.08 103.87 122.33 60.62 102.8 108.6 128.0 147.5
Italy 5,826 8,333 11,568 15,533 9,707 55.44 56.72 56.94 59.83 4.39 105.1 146.9 203.2 259.6
Turkey 4,250 6,155 8,831 13,540 9,290 39.19 53.99 63.17 74.93 35.75 108.5 114.0 139.8 180.7
Canada 6,756 9,522 13,146 15,317 8,560 23.21 27.79 30.77 35.16 11.95 291.1 342.6 427.2 435.6
Australia 6,306 8,882 12,257 14,605 8,299 13.89 17.07 19.15 23.13 9.24 453.9 520.5 639.9 631.4
Romania 4,265 5,762 8,093 12,559 8,293 21.29 23.20 22.44 19.96 -1.33 200.3 248.3 360.6 629.1
United
Kingdom
6,648 8,864 11,436 13,813 7,165 56.23 57.25 58.89 64.10 7.87 118.2 154.8 194.2 215.5
Poland 3,740 5,516 7,740 10,743 7,004 34.02 38.11 38.26 38.53 4.52 109.9 144.7 202.3 278.8
South Africa 3,321 4,819 6,457 8,969 5,648 24.73 35.20 44.00 52.98 28.25 134.3 136.9 146.8 169.3
Spain 2,902 4,059 5,661 7,972 5,071 35.53 38.85 40.26 46.65 11.12 81.7 104.5 140.6 170.9
Nigeria 1,893 2,769 3,830 6,615 4,723 63.57 95.62 122.88 173.62 110.05 29.8 29.0 31.2 38.1
Argentina 3,471 4,849 6,532 7,885 4,414 26.07 32.62 36.90 41.45 15.38 133.1 148.6 177.0 190.2
Source: Global Human Settlements Layer – European Commission
75
Ukraine_2015_nov26.indd 75 2015-11-26 5:14 PM
CHAPTER 1 The urban system: Demographics and Economic Trends
Figure 58 – Prosperity is not pushing the massive addition of built-up areas in Ukraine
Key messages and implications for further policy
and analytical work
Ukrainian cities are important engines of economic growth. Not only is urban sector production much greater than
rural production in absolute terms, it is also much more productive per capita. Agglomeration economies have yielded
higher productivity as cities offer settings for firms and workers to take advantage of sharing, matching, and learning
mechanisms. Firm-level data showed that larger cities attracted more firms and cities with higher population density
hosted more productive firms.
Nightlights (NLs) patterns exhibited by cities are also quite different across Ukraine’s regions, with a noticeable shift of
NLs growth from East to West. Urban footprints captured by NLs are growing rapidly in the West while they are either
declining or growing significantly slower in the East. One possible explanation is the stronger growth of the urban sector
in the West (Western and Central regions) relative to 1996 levels. The East (Eastern and Southern regions), while starting
at a higher level of urbanization, has further urbanized more slowly, resulting in a slower growth of NLs. Similar dynamics
show up in the first city typology91
of NLs urban footprints and city location dynamics.
Built-up vs. GDP pro capita
60,000
50.000
40.000
30.000
20.000
10.000
0
0 100 200 300 400 500 600 700 800
Built-up surface pro capita (GHSL 2014)
GDPprocapita(WB2013)
Source: Global Human Settlements Layer – European Commission
76
Ukraine_2015_nov26.indd 76 2015-11-26 5:14 PM
CHAPTER 1 The urban system: Demographics and Economic Trends
The Eastern region has the highest number of Disappearing cities, followed by the Central and Southern regions. By
contrast, the Western region had the most Appearing cities, followed by the Central region.
Cities that increase in brightness and expand in footprint are on average performing better in other indicators (i.e.,
population decline, total economic activity and productivity). These cities (Type 1) have significantly lower declines in
population and higher concentrations of economic activity as measured by light emissions per capita as well as rate of
growth. The majority of the largest cities of the country are Type 1. Among the cities whose core is declining in night
lights, results are mixed. Those with expanding footprints (Type 3) seem to be growing more rapidly in economic terms.
However, they are also losing population more rapidly than those cities that have a dimming core and whose footprint is
shrinking (Type 2). Only two cities comprise Type 4. These are large cities that, despite losing population, present growing
economic activity.
Built-up areas in Ukraine have grown significantly, at a pace that does not seem to correspond to economic or demographic
indicators. Despite its decline in population, Ukraine ranked 4th
globally - in terms of growth of built-up area - over the
past 15 years. Consequently, it presents the highest rate of new built-area per person. These trends are most likely
a result of long-suppressed housing demand that motivated construction upon the lifting of Soviet-era construction
limitations, as well as a result of a strong focus of household investments in the real estate sector.
Finally, agglomerations are particularly important engines of economic growth in the country. Agglomerations constitute
a majority of the few urban centers that are actually growing in population in Ukraine. In addition, according to NLs
measurements, agglomerations are more productive in both per capita and per km2
terms. There are also close correlations
between agglomerations types of cities (for example, all major cities are in the Found category), and more agglomerations
are thriving and growing (Type 1 in the second city typology).
Going forward Ukraine should recognize the role of urban areas in economic growth and make sure that they count with
the right tools to reach their full potential. To achieve increased productivity in urban centers, the right mix of good
governance, a beneficial business climate, and an efficient provision of public goods, usually in the form of public services
and infrastructure is necessary so that agglomeration economies are fostered and congestion costs reduced. In urban
areas experiencing population growth, cities will to focus on adapting infrastructure and services making sure that new-
comers are well absorbed and integrated in the city; manage peri-urban growth to avoid sprawl, etc. In addition, the
realignment of city boundaries or introduction of metropolitan governance mechanisms might be needed to achieve an
effective coordination of agglomerations which span across administrative units. This is particularly important in the
case of public transport. The country also needs to put in place the right policies to better manage urban population
decline. As observed in this section an important number of cities – despite declining in population – continue to grow
economically. This means that in these areas, shrinking is not necessarily coming at the expense of economic growth.
While this might be a reflection of a temporal increase in productivity due to an increase in the capital per worker ratio -
as observed at the national level – it might also be linked to a decline of congestion costs associated with the city moving
towards a new population equilibrium. In these cases, city administrators should aim at managing population decline in
an efficient and harmonious way making the best out of it (e.g. turning brownfields into public space, optimizing public
transportation).
91 The first typology of cities is defined based on whether cities emit enough light to be considered urban areas in the initial and subsequent
years analyzed. The second typology based on the growth of the light emitted in the core of the city and whether the city’s NLs footprint grew
or shrank.
77
Ukraine_2015_nov26.indd 77 2015-11-26 5:14 PM
78
Ukraine_2015_nov26.indd 78 2015-11-26 5:14 PM
79
CHAPTER 2
Cities and the
Inter-Governmental
Fiscal System
Ukraine_2015_nov26.indd 79 2015-11-26 5:14 PM
Key Highlights and Implications for Further Policy
and Analytical Work
Ukraine is undergoing a major reform of its inter-governmental fiscal system. Until 2014, the majority of fiscal revenues
were not raised by city governments but came from retained shares of national taxes and transfers. The allocation of
these transfers was largely based on the existing network of service facilities and staffing as opposed to the demand for
services. The system of intergovernmental transfers has led to wide disparities across city types in per capita levels of
expenditures per function. The highest per capita expenditures were observed in cities with declining core and periphery,
and the lowest – in growing cities with expanding footprint. Such financial disincentives, combined with legal constraints
on local government’s discretion in downsizing the network of facilities and their staff, impeded fiscal adjustments
necessitated by Ukraine’s demographic and economic changes.
In December 2014, the Budget Code was significantly changed. As a result, the new equalization system will factor in per
capita revenue levels and thus significantly decrease the disincentive that focuses on infrastructure need. Such re-design
of the transfer mechanism would likely realign resources among local governments, channeling more resources to large
and growing cities. Derivation-based sharing of revenues although partially mitigated with a new basic grant, will likely
exacerbate the impact on shrinking cities. It will, however, improve the efficiency of spending. These changes are expected
to improve fiscal autonomy and to better align public services with the need of local communities.
Going forward, in addition to operationalizing the new Budget Code, Ukraine’s policy makers may rethink the structure
of functional sub-national expenditure in view of changing demographics. So far, expenditures for education have been
steadily increasing despite the rapidly aging population placing increasing demands on the health system. By earmarking
new subventions separately for education and health, the new system can further entrench under-utilized social
infrastructure. More generally, the focus of reforms in the short-term could be on increasing the yield of user fees and
property taxes as a way to make cities assume their responsibility to collect own revenue. In the medium term, some of
these taxes could be reassigned from national to the subnational level as a way to increase horizontal accountability of local
officials to their residents as well as fiscal responsibility. Finally, addressing the fiscal fragmentation and amalgamating
the bottom tier should remain a priority for the government as a way to improve fiscal efficiency in service provision.
CHAPTER 2 Cities and the Inter-Governmental Fiscal System
80
Ukraine_2015_nov26.indd 80 2015-11-26 5:14 PM
17
I. The Inter-Governmental System
Ukraine is a unitary state with three tiers of sub-national government as presented in the introduction section of this
study. Its current territorial division suffers from excessive fragmentation at the bottom tier. This is common in other
post-Soviet countries, where local self-government was established in pursuit of greater democracy and local control
rather than efficiency of public services. Given that local authorities bear responsibility for major social services, such as
education and health care, the average locality’s size of 1,400 residents at the lowest administrative level of government
is too small to achieve the minimum efficient scale of provision93
. Addressing the fiscal fragmentation issue has been
attempted in several administrative-territorial reform proposals aimed at amalgamating the bottom-tier municipalities
in order to increase their average size and reduce disparities in population size. However, none of those reforms has been
fully implemented. The recently-adopted Law on Voluntary Amalgamation of Territorial Units, which is accompanied by
new Budget Code provisions, is the first sound step towards re-starting such reforms, but it still has to be implemented.
About 70 percent of the national population resides in urban areas. This share is higher than the 50 percent average of
the world’s middle-income countries, but on par with the 70-percent average in Europe and Central Asia94
. Of the total
urban population, 27.5 million reside in cities while the remaining 3.8 million reside in town-lets. (The distinction between
a city and a town-let designation is not entirely determined by population size as there are five town-lets with population
over 15,000 people while at the same time almost a quarter of cities have populations under 10,000).
92 Figures that do not include a source in this Chapter were developed by World Bank staff working on the report.
93 World Bank. 2008. Ukraine - Improving Intergovernmental Fiscal Relations and Public Health and Education Expenditure Policy: Selected
Issues. Washington, DC: World Bank.
94 World Bank. 2014. World Development Indicators. Washington, DC: World Bank.
CHAPTER 2 Cities and the Inter-Governmental Fiscal System
Figure 59 – Sub-national governments account for almost half of public expenditures92
46%
45%
44%
43%
42%
41%
40%
240
230
220
210
200
190
180
2009 2010 2011 2012 2013
Subnational public
expenditures in constant
2013 prices, bln. UAH(rs)
SNG share in GG expenditures
81
Ukraine_2015_nov26.indd 81 2015-11-26 5:14 PM
All local governments combined (at all three tiers covering both rural and urban settlements) account for almost half of
total national public expenditures and are responsible for the majority of public expenditures on essential social services
(see Figure 59 above). In particular, in 2013 sub-national governments accounted for 80 percent of public expenditures
in health and 70 percent of public expenditures in education in 2013. In fact, the three social sectors (education, health
care, and social welfare) accounted for over 80 percent of sub-national expenditures (See Figure 60 below). While
showing some fluctuation from year to year, on average total sub-national expenditures have increased in real terms by
12 percent over 2009-2012. This is roughly proportional to Ukraine’s GDP growth.
95 Id. World Bank. 2008.
96 Ibid.
Given the sub-optimal size of local governments, it is not surprising that other studies have found under-utilized social
infrastructure in Ukraine. Ukraine has one of the lowest student/teacher ratios in the world, combined with a low teaching
load per teacher95
. Similarly, more health care inputs (hospitals, beds, doctors, nurses, and non-medical staff) per 10,000
residents are used in Ukraine than in in the new EU member states and the EU countries in general; this dynamic is
further aggravated by an inflated average length of stay in public health care facilities96
. In addition to the fragmented
territorial structure, the efficiency of service delivery is further undermined by demographic changes combined with legal
constraints on local governments’ discretion in closing health facilities and schools or firing personnel. Despite Ukraine’s
aging population, the structure of sub-national expenditure has not shifted from education to health care. In fact, sub-
national expenditures on education have been steadily increasing from 4.5 percent of GDP in 2009 to 5 percent of GDP
in 2013 (see Figure 61 above).
Sub-national governments have little authority to increase their revenues. The limited revenue rate- setting discretion
that they have only applies to the short list of their own sources of local revenues, which accounts for only 10 percent of
sub-national budgets. Over 80 percent of sub-national revenues come from retained shares of national taxes and other
transfers (see Figure 62 below). While the sub-national revenues from all property taxes combined are on par with other
countries in the region (0.78% of GDP in 2012), most funds for sub-national expenditure come from the national taxes
on land and vehicles over which local governments have no rate-setting or collection authority. By contrast, taxation of
structures (the only local property tax) generated less than 0.01% of GDP in both 2012 and 2013.
The low level of revenue autonomy at the sub-national level allows sub-national governments to avoid deprives the system
of an appropriate level of accountability and fiscal responsibility for subnational governments. The heavy dependence
on shared tax revenues and all other transfers from the national budget (see Figure 61) has stood at above 80 percent
CHAPTER 2 Cities and the Inter-Governmental Fiscal System
Figure 60 – Sub-national expenditures are dominated by the three social sectors
82
100%
80%
60%
40%
20%
0%
18%
16%
14%
12%
10%
8%
6%
4%
2%
0%
Other Health CareSocial Welfare EducationHousing and Utilities
%ofGDP
%oftotalexpenditures
2009
2009
2010
2010
2011
2011
2012
2012
2013
2013
Ukraine_2015_nov26.indd 82 2015-11-26 5:14 PM
of total local revenues over the last five years. Even the City of Kyiv, the wealthiest local government, receives almost
a quarter of its revenues in the form of grants from the national budget and another 40 percent from national taxes
collected in its territory. It is not surprising to see that the steady increase in the total volume of grants over the years
coincided with increasing expenditures on education despite a decline in school-age population. For other countries, Figure
63 below reveals high transfer dependence in countries where sub-national governments play a larger role in the provision
of health care and education. Given that Ukraine’s local governments play a larger share in the provision of social services,
such as general education and health care, than most other countries in the region, such high transfer dependence is
unavoidable.
CHAPTER 2 Cities and the Inter-Governmental Fiscal System
Figure 61 – Composition of sub-national revenues, 2005-2012
Figure 62 – Decentralization of social services is associated with transfer dependence
Note: Transfer dependence is measured by the share of total sub-national revenues accounted for by all kinds of
transfers, including sharing of revenues from national taxes obtained at the source. In the case of Ukraine, transfers
include all sub-national revenues except those from local taxes and non-tax sources.
83
Grants
OtherTaxes
PIT
Taxes on goods and services
Property Taxes
Non-Tax
20%
15%
10%
5%
0%
2005
2006
2007
2008
2009
2010
2011
2012
%ofGDP
0.50
0.75
0.55
0.80
0.60
0.85
0.65
0.90
0.70
0.95
0.1
0.50
0.75
0.55
0.80
0.60
0.85
0.65
0.90
0.70
0.95
0.1
0.00 0.000.20 0.200.40 0.400.60 0.600.80 0.801.00 1.00
Grantdependence
Education Decentralization Healthcare Decentralization
Ukraine_2015_nov26.indd 83 2015-11-26 5:14 PM
To reinforce incentives for fiscally responsible behavior under such high transfer dependence, local government financing
of its spending decisions—at least at the margin—becomes critical.97
Additional spending should require raising additional
tax revenue (rather than seeking higher transfers from the central government). A key problem with transfers is that
the local governments receiving them are likely to perceive the additional funds as having a zero marginal cost to them
in political and economic terms. In contrast, the use of local revenues is likely to make local governments face the real
economic as well as political costs of obtaining and expending additional public funds, thus increasing fiscal responsibility
and political accountability of local officials. In addition, financing local government expenditures via transfers can reduce
the predictability of funds and therefore the ability of local governments to plan and budget; this is especially the case
when the transfers are determined on an ad hoc basis, as in the case of additional grants described later in this chapter.
The Budget Code of Ukraine was significantly changed in December 2014. According to the explanatory notes accompanying
the legislative amendments, one of the main objectives was to implement a new model of inter-governmental relations and
strengthen the financial basis of local government. Thus, the amendments include a number of provisions to bring public
services closer to their users, improve fiscal autonomy of local governments, and strengthen their local governments’
financial independence.
Recent amendments to the Budget Code call for earmarked subventions to fund education and health care while revising
the formula for equalization grants covering the remaining functions of sub-national governments.98
Among other
provisions, the amendments established a legal framework for financing amalgamated sub-national units. However,
most of the amendments concerned the revenue side, reducing the share of revenues from the Personal Income Tax, and
natural resource royalties previously decreed for sub-national budgets.
Inter-Governmental Structure
In Ukraine, the right to self-government is articulated in terms of “territorial communities,” which do not have to coincide
with the statistical definition of a settlement or administrative division. Local self-governance has been guaranteed
beginning with the 1996 Constitution (Article 140) and the subsequent Law on Local Self-Governance in Ukraine adopted
in 1997. Even in the case of cities, a unit of local self-government can include a bigger city and several other adjacent
settlements.
In terms of fiscal analysis, however, Ukraine’s governance features cities from all three tiers of sub-national government
with different assignments of revenue sources and expenditure responsibilities. Thus, many subventions from the
national budget are allocated only to the sub-oblast cities, which are mandated to fulfill the social entitlements for which
these monies are earmarked. Equalization grants from the national budget only extend to the sub-oblast level, while for
sub-district cities the equalization grants are allocated by their respective districts. As inter-governmental revenues –
constituting the bulk of city revenues – are passed on to the 275 sub-district cities (out of a total of 458 cities reviewed
in this study) by their respective districts, the analysis of patterns in city finances has to be placed within the context
of Ukraine’s overall system of inter-governmental relations.
In addition to the flow of inter-governmental revenues, the administrative status of a city also appears to be related
to its demographic characteristics. There appears to be a close relationship between the 2001-13 annual percentage
population decline and the administrative type of cities: the highest annual percentage population decline of 1.27% is
observed in the bottom-tier cities and a lower rate of 0.47% is observed at the intermediate tier, while top-tier cities
97 Thus revenue autonomy does not require that local governments control (i.e., determine bases and rates for) all their revenue sources. It would
be sufficient if they could substantially increase or decrease rates for a few taxes accounting for a meaningful share of their revenues, while
the rest continued to come from a predictable and stable sharing of national tax revenues. However, there would be little revenue autonomy
achieved if any additional revenue from higher local taxes was almost entirely offset with reduction in grants from the central government.
98 Adopted by the Parliament on December 28, 2014 and January 15, 2015.
CHAPTER 2 Cities and the Inter-Governmental Fiscal System
84
Ukraine_2015_nov26.indd 84 2015-11-26 5:14 PM
experienced a positive growth of population over the same time period. In addition to higher rates of population decline,
bottom-tier cities are characterized by having the smallest populations among the tiers as of 1989: more than half fell
into the category of mid-size towns (10-20,000 residents), with the rest of bottom-tier cities equally split between the
small town category (under 10,000 residents) and the large town category (between 20-50,000 residents). Therefore,
the excessive territorial fragmentation of sub-national government is not entirely a rural problem, but might also lead to
sub-optimal efficiencies in service provision in the bottom-tier cities.
Ukraine’s previous system of inter-governmental fiscal relations was shaped by the adoption of the Budget Code in
2001. At that time, the main political impetus for change was the discontent and political pressure exercised by local
governments in response to the poor management and alleged abuses by regional governments during the years of
transition prior to the reform. Among other provisions, the 2001 Budget Code made distinctions between delegated and
own responsibilities and provided different “revenue baskets” from revenue-sharing to ensure that enough funding was
present to finance the delegated responsibilities. Nevertheless, the Budget Code allowed sub-national governments to
spend any revenues from the delegated basket in any sector they wished as long as higher priority was given to the core
(“protected”) economic items.
As part of the reforms initiated with the adoption of the 2001 Budget Code, the non-transparent discretionary system
of inter-governmental revenues was supposed to be replaced with a formula-driven equalization system. The major
changes brought by the Budget Code included re-assignment of expenditure responsibilities among different levels
of government; long-term assignment of revenues from national taxes to local budgets; formula-based calculation of
equalization transfers; clear and transparent structure for the earmarked transfers; and delineation of conditions and
limits on local borrowing. The equalization grant determination was expected to be based on objective, neutral criteria
applying a uniform formula across the country to assess the revenue capacity and expenditure needs of sub-national
units. That system still employed negative transfers for rich jurisdictions while increasing objectivity in the sub-national
budget process and increasing budget predictability for local governments.
However, the predictability of the formula-driven system was compromised by a dozen new allocation factors that had
been added to the formula over the years. Furthermore, the ad hoc nature of these changes entrenched inefficiencies by
basing financing on characteristics of networks of local facilities and their staffing levels, thus implicitly financing the
existing network of service facilities and staffing as opposed to funding an objectively-determined demand for services.
The recent amendments to the Budget Code attempt to move away from financing existing infrastructure. The new
system of grants entirely disregards expenditure needs in the allocation of general-purpose grants, which are now
called “basic grants” instead of “equalization grants” in the past. The new general-purpose grants only aim to equalize
disparities in the revenues from the national PIT and CIT taxes that are decreed for local budgets on a derivation basis.
The recent amendments also encourage voluntary amalgamation of bottom-tier jurisdictions. A mechanism has been
developed in the Budget Code amendments for moving amalgamated communities into direct inter-governmental fiscal
relations with the national government, and granting them powers equivalent to those of sub-oblast-significant cities.
Similar to previous arrangements with national government provided for oblasts, sub-oblast cities and raions, it will
establish such direct inter-governmental fiscal relations also for amalgamated communities. The Government of Ukraine
declared that such changes represent a starting point for a transition from a three-tier to a two-tier system of local
self-government.
CHAPTER 2 Cities and the Inter-Governmental Fiscal System
85
Ukraine_2015_nov26.indd 85 2015-11-26 5:14 PM
Functional Responsibilities
In the assignment of functional responsibilities to local governments, a distinction is made between so-called “own
functions” versus “delegated or obligatory functions.” Obligatory functions are mandatory for all local government units
at the given level (see Table 12 below). “Own functions” include “hard” municipal services, such as local roads and
transport infrastructure, municipal transit, solid waste management, housing, and utilities. While the Law on Local
Self-Government does not differentiate functional responsibilities among types of cities, the Budget Code delegates
responsibilities in an asymmetric way with a larger portion being delegated to the higher-tier cities (see Annex VII).
While the average city size of 60,000 residents makes it viable for an average city to provide major social services,
including education and health care, almost a quarter of cities have fewer than 10,000 residents, which may be too small
to achieve the minimum efficient scale of provision.99
This is somewhat mitigated with the asymmetric delegation of
expenditure responsibilities in the Budget Code (see Annex VII). Thus major social services – including education, health
care, and social welfare – are mostly delegated to the top- and intermediate-tier cities, while bottom-tier cities are only
responsible for pre-school education and cultural/recreational centers. However, even among the intermediate-tier cities
there are four that have fewer than 10,000 inhabitants, indicating size alone isn’t determinative of responsibilities.
There are legal constraints on local government discretion in closing or rationalization of social infrastructure. Thus,
Article 26 of the Local Self-Government Law requires a local referendum to close a pre-school institution. Reportedly,
local governments are also bound by physical norms, such as staffing levels and other inputs mandated on the basis of
facility characteristics100
. For example, the number of doctors is mandated based on the existing number of beds in health
facilities, or non-teaching staff based on the number of square meters of a school. Under current law, these physical
norms for decision-making have to be applied to the existing oversized and underutilized network of service facilities,
rather than have such decisions based on the actual demand for services.
Recent amendments to the Budget Code assigned some additional expenditure responsibilities to sub-national
governments. Expenditures for certain activities in social and cultural sectors were shifted to the oblast and local levels.
Previously such responsibilities (and related facilities) were all funded from the State budget. Furthermore, now sub-
national governments have to finance construction and maintenance of roads from the local budget; prior to 2015, they
drew from the national Road Fund.
99 A large number of empirical studies that have sought findings regarding economies of scale for local government services show that most
economies of scale are exhausted for local governments with populations over 10,000 residents. Economies of scale means the average cost
decreases as the volume of service provision increases; for example, per-student costs of education are lower in municipalities with more
students.
100 Id. World Bank. 2008.
CHAPTER 2 Cities and the Inter-Governmental Fiscal System
86
Ukraine_2015_nov26.indd 86 2015-11-26 5:14 PM
Function Own Responsibilities Delegated Responsibilities
General public
services
Self-administration powers; municipal archives None
Defense, public order
and safety
Civic defense; municipal police
Residence registration; emergency response;
permits for demonstrations and recreational
events; administrative courts; civil registration
Economic affairs
Land use management; urban planning;
construction and maintenance of local public
roads; transit fares, routes and schedules; public
parking; markets and fairs; licensing of outdoor
advertising
Price control; consumer protection; investment
promotion; identification of non-residential
properties; enforcement of building and land
codes; land titles
Environmental
protection
Licensing the use of natural resources of
local significance; preservation; solid waste
management; local programs of environmental
protection
Re-forestation; enforcement of waste
management laws
Housing and
communal services
Utility rates; public housing; water supply and
sewage systems; residential fuel supply; upkeep
of public spaces and landscaping; upkeep of
cemeteries
Free housing for entitled individuals
Health Maintenance of municipal institutions Subsidized medicine and supplies
Recreation, culture,
and religion
Maintenance of municipal institutions Preservation of cultural and historical heritage
Education
Provision of general education; school transport;
maintenance of municipal institutions
Free textbooks
Social welfare
Targeted assistance for disabled; municipal
welfare programs; housing assistance for disabled,
veterans and other entitled individuals; burial of
indigent persons
Child protection; municipal and regional
programs of labor protection and employment;
long-term care
CHAPTER 2 Cities and the Inter-Governmental Fiscal System
Table 12 – Functional responsibilities
Source: Law of Ukraine on local self-government (no. 280/97-vr, articles 25-41)
87
Ukraine_2015_nov26.indd 87 2015-11-26 5:14 PM
II. Revenue Sources
Local government revenue sources fall into three main categories: (i) Own-source revenues (including property taxes
and other local taxes, charges and fees); (ii) Shared revenues (e.g., PIT, excises, environmental tax, land fees, license fees,
royalties for common natural resources)101
; and (iii) Vertical transfers from higher-level governments (from the central,
oblast and raion governments to cities). Similar to consolidated sub-national revenues, over 80 percent of city revenues
come from retained shares of national taxes and other transfers (Figure 63). On average, less than 10 percent of total
city revenues come from own sources, such as local taxes and non-tax charges.
As can be expected from the asymmetrical allocation of revenues sources, there are clear differences in the composition
of revenues among cities at different tiers of government (Figure 63). In 2013, cities at higher tiers of government were
less dependent on explicit grants while relying more on non-tax revenues and locally retained shares of national taxes.
This is likely to be a reflection of the arrangements for derivation-based sharing of revenues from national taxes, which
had a larger share of tax collections (e.g., PIT) allocated to the budgets of higher-tier governments. Since, until 2015,
equalization grants were filling the gap between projected revenues and expenditures of cities, higher revenues from
shared taxes in higher-tier cities were associated with smaller allocations of equalization grants. One has to note that in
per capita terms bottom-tier cities received almost four times more in explicit grants than the intermediate-tier cities
while having more than half of the amount of revenues from other sources. As will be later corroborated in the analyses
of expenditures, this is likely to be related to the sub-optimal scale of service provision at the bottom tier.
For the most part, there were no major differences in revenue composition observed among the night light categories of
cities102
(Figure 64). This not surprising as each night light category includes cities from both bottom and intermediate
tiers of government (the two top-tier cities belong to sub-type A: Growing light intensity in expanding periphery).
101 Under derivation-based sharing, national government taxes are collected by the national tax authorities and then partially (or in some cases,
fully) allocated to the budget of the local government in whose territory collection takes place. As it is a form of inter-governmental transfer,
derivation-based sharing of revenues from national taxes is discussed in the corresponding section below.
102 The night light categories used for this Chapter are the six categories presented in the Annex VI. Extensive growth.
CHAPTER 2 Cities and the Inter-Governmental Fiscal System
Figure 63 – Type of city revenues and % of total provided by different tiers of government, 2013
88
Special funds
100%
90%
80%
70%
60%
50%
40%
30%
20%
10%
0%
Top
Intermediate
Bottom
UAHpercapita
Non tax revenues
%oftotalrevenues
100%
90%
80%
70%
60%
50%
40%
30%
20%
10%
0%
Top
Intermediate
Bottom
Transfers Shared Taxes OtherTaxes
Taxes on
natural
resources
Local taxes
and duties
Taxes on
personal
property
573
2,334
8,100
Ukraine_2015_nov26.indd 88 2015-11-26 5:14 PM
17
However, bottom-tier cities are more likely to be among the Missed Disappear and Appear categories and thus have no
type assigned in the second night light typology. This explains a higher dependency on explicit grants for cities with no
type, given that such transfer dependency was common for bottom-tier cities. For the same reason, in the sub-type F
(thriving core, shrinking footprint), explicit grants accounted for a smaller share of revenues than shared tax revenues
as both cities comprising this sub-type belong to the intermediate tier, and were thus less dependent on transfers103
.
However, this pattern cannot explain the lower transfer dependence in sub-type D cities (growing light intensity in
shrinking footprint), even though it has the highest proportion of the bottom-tier cities (70 percent). The low amount of
transfer dependency in sub-type D is due to one of the lowest per capita allocations of explicit grants, rather than higher
revenues raised locally. Note that sub-types B (Declining in all aspects) and E (Growing light intensity in an expanding
periphery) received among the highest amounts of grants per capita despite also having average levels of locally-derived
revenues. As we will see later, this translated into the highest per capita expenditures on social services among categories
of cities.
103 As type 4, coinciding with sub-type F, is comprised of just two major cities (Donetsk and Zaporizhia), we do not attempt to find any
generalized patterns for this type/sub-type of cities.
As with the administrative tiers of cities, the patterns in revenue composition show a similar relationship to city population
size (Figure 65 below). Larger cities tend to depend less on explicit grants while relying more on non-tax revenues and
locally-retained shares of national taxes. Again this appears to be driven more by differences in per capita amounts of
explicit grants rather than per capita yield of locally-derived revenues (own-source and shared at source). In per capita
terms, small towns received over ten times more in explicit grants than major cities, while the difference in locally-derived
revenues was less than two-fold.
CHAPTER 2 Cities and the Inter-Governmental Fiscal System
Figure 64 – Composition of city revenues by night light type as % of total, 2013
Notes: : These figures only include transfers received by the city proper, but not its subdivisions.
A: Growing light intensity in expanding periphery;
B: Declining in all aspects;
C: Dimming periphery;
D: Growing light intensity in shrinking footprint;
E: Declining economic activities in the core, growing area with stronger peripheries;
F: Thriving core, shrinking footprint.
89
A
B
C
D
E
F
Notype
100%
90%
80%
70%
60%
50%
40%
30%
20%
10%
0%
Special funds
UAHpercapita
Non tax revenues
9,000
8,000
7,000
6,000
5,000
4,000
3,000
2,000
1,000
0
Transfers Shared Taxes OtherTaxes
Taxes on
natural
resources
Local taxes
and duties
Taxes on
personal
property
A
B
C
D
E
F
Notype
4,1361,176
5,4571,166
4,5041,092
2,7601,027
5,7531,249
8521,738
7,194978
Ukraine_2015_nov26.indd 89 2015-11-26 5:14 PM
Furthermore, the relationship between transfer dependence and population size does not seem to stem from population
decline (Figure 66 below). While the per capita yield of locally-derived revenues was inversely related to population decline,
this dynamic did not hold for the per capita amount of grants. The amount of grants decreased with population decline
up to the national average rate, possibly reflecting the use of a smaller client population size in the determination of
expenditure needs in the equalization grant formula. However, for cities with population declining at a rate above the
national average, more resources were allocated in grants per capita than for cities with population declining more than
the urban average but less than the national average. The greater allocation of grants per capita to cities with population
declining more than the national average might have been due to adjustments for under-utilized social infrastructure in
the calculation of expenditures needs.
CHAPTER 2 Cities and the Inter-Governmental Fiscal System
Figure 65 – Composition of city revenues by population size as % of total, 2013
Figure 66 – Composition of city revenues as % of total relative to population decline, 2013
90
Transfers
Shared Taxes
OtherTaxes
Taxes on natural
resources
Local taxes and
duties
Special funds
Taxes on personal
property
Non tax revenues
14,000
12,000
10,000
8,000
6,000
4,000
2,000
0
UAHpercapita
Special funds
Non-tax
revenues
Local taxes
and duties
Taxes on personal
property
Taxes on natural
resources
Othertaxes
Shared taxes
Transfers
Smalltowns
MidsizetownsLargetownsSmallcities
MidsizecitiesMajorcities
70%
60%
50%
40%
30%
20%
10%
0%
%oftotalrevenues
100%
90%
80%
70%
60%
50%
40%
30%
20%
10%
0%
9,000
8,000
7,000
6,000
5,000
4,000
3,000
2,000
1,000
0
PositivegrowthDecliningbutlessthan
urbanaverage
Decliningbutlessthan
nationalaverageDecliningm
orethan
nationalaverage
%oftotalrevenues
UHApercapita
Special funds Non tax revenuesTransfers Shared Taxes OtherTaxes
Taxes on
natural
resources
Local taxes
and duties
Taxes on
personal
property
Smalltowns
MidsizetownsLargetownsSmallcities
MidsizecitiesMajorcities
PositivegrowthDecliningbutlessthan
urbanaverage
Decliningbutlessthan
nationalaverage
Decliningm
orethan
nationalaverage
11,246
7,341
3,826
2,619
5,794
863
6,683
5,796
4,647
5,544
Ukraine_2015_nov26.indd 90 2015-11-26 5:14 PM
Own Sources of Revenues
Until 2015, the Tax Code authorized just five revenue instruments for own sources of local government revenues (Table 13).
Recent amendments abolished one of the five revenue instruments (the fee for the certain business activities), while
extending the coverage of the local property tax to include land and movable property. For the items on the list of
authorized local revenue instruments, local authorities have some discretion in setting the rates subject to nation-wide
ceilings or floors. However, the tax base is defined in national legislation and the actual administration of these revenue
instruments is carried out by the national revenue authority. Further, with respect to the portion of the revenues from the
national land tax that is shared with local budgets, sub-national governments can offer tax exemptions and other kinds
of preferential tax treatment and hardship relief. With respect to non-agricultural land plots with no appraised value,
local councils are to set land tax rates in UAH per square meter differentiated by location with a ceiling of three times
the base rate prescribed for the respective locality in the Tax Code.
Tax name
Who can
introduce
Who defines the base Who sets the rate
Tax on real
estate other
than land
Mandated by
national legislation
National legislation (total
area of a residential
property)
For each type of property and ownership, national legislation
sets the rate ceiling in % of the minimum wage per 1 sq. meter
of tax base while local councils can adopt a reduced rate for
apartments under 240 sq. m. and houses under 500 sq. m.
Single tax
Mandated by
national legislation
National legislation
(duration of business
activity in months or in
business income)
For businesses with fewer than 10 employees and less than 1mln
UAH in income, local councils set the rate within the range set
by national legislation (10-20% of minimum wage per month);
for larger businesses, rates are set by national legislation as % of
business income
Fee for certain
business
activities
Mandated by
national legislation
National legislation (days
of business activity)
Local councils within the range set by national legislation for
each type of activity (% of minimum wage per day)
Fee for parking
of vehicles
Local councils
National legislation (area
of public parking spots)
Local councils within the range set by national legislation
(0.03 to 0.15% of minimum wage per 1 sq. meter per day)
Tourist tax Local councils
National legislation
(value of accommodation
services rendered)
Local councils within the range set by national legislation
(0.5 to 1%)
CHAPTER 2 Cities and the Inter-Governmental Fiscal System
Table 13 – Own sources of local government revenues
Source: Tax Code
Note: To index for inflation, tax rates are set not in nominal amounts, but as a fraction of the minimum wage, which is
periodically adjusted by the national government.
91
Ukraine_2015_nov26.indd 91 2015-11-26 5:14 PM
104 These relative contributions of businesses vis-a-vis residents in the total revenues from local taxes might look different in 2015, after
property taxes on land and vehicles have been moved from the list of national taxes to the list of local taxes. When the vehicle tax was still a
national tax in 2013, ninety percent of its revenues came from individual car owners while the rest came from corporate entities. Similarly, two
thirds of the land tax revenues came from individual owners and only one third came from corporate entities.
105 The more nuanced approach to the typology reveals that high per capita amount of revenues from the Tourist Tax found for type 2 is
actually driven by sub-type B (declining in all aspects).
Until 2015, business taxes were the most utilized of all own revenue instruments available to local governments in Ukraine.104
By far the largest per capita yield was recorded for the Single Tax, which is paid by small business in lieu of the income
tax and other national taxes. The next most utilized own source of local revenues were fees for certain business activities
(essentially a business license with an element of imputed income taxation). The least utilized revenue instrument was
the property tax on structures, on average generating only 28 kopiyok (cents) per person. For any category of cities, the
Single Tax accounted for more than 80 percent of own tax revenues.
Revenue source % of own tax
revenues
Average Minimum Maximum Coef. of
variation
Tax on real estate, other than
land
0.3% 0.28 0.00 9.59 2.78
Single Tax 90.9% 97.57 0.00 420.52 1.04
Fee for certain business activities 7.2% 9.12 0.00 82.63 1.35
Fee for parking of vehicles 1.1% 0.78 0.00 11.96 2.89
Tourist Tax 0.6% 1.05 0.00 61.85 5.90
CHAPTER 2 Cities and the Inter-Governmental Fiscal System
Table 14 – Utilization of local revenue instruments by cities as % of UAH per capita, 2013
Figure 67 – Utilization of local revenue instruments by cities, UAH per capita, 2013
There is a strong relationship between the night light topology and the utilization of own sources of revenues. Cities that are
thriving in all respects (type 1 or sub-type A) generated at least 50 percent more revenue than the average per capita
revenue from each own revenue instrument except for the Tourist Tax105
(Figure 67). This is particularly true for parking
fees. Similarly, the Found and Appear night light typologies have higher per capita revenues from own taxes than Missed
and Disappear cities. A possible explanation might be the creation of small businesses – part of the positive relationship
between night lights and economic activity previously discussed in Section 4.
92
Type 1 Type 2 Type 3 Type 4 No type
150
100
50
0
Single tax Business patents
UAHpercapita
UAHpercapita
Real estate tax Parking fees Tourist tax
0
0.5
1
1.5
2
Ukraine_2015_nov26.indd 92 2015-11-26 5:14 PM
CHAPTER 2 Cities and the Inter-Governmental Fiscal System
There is also a noticeable association between population decline and the yield of local taxes (Figure 68). Cities with higher
population decline appear to raise less revenue per capita from own taxes relative to the yield of national taxes shared
with local governments.
Figure 68 – Utilization of local revenue instruments by city night light typology, UAH per capita, 2013
There is only a weak association between population size and per capita revenues from own taxes, but which does not hold
at all for the Tourist Tax (Figure 69). Major cities have particularly high per capita revenues from parking fees and the
Single Tax.
Figure 69 – Utilization of local revenue instruments by city population size, in UAH per capita, 2013
Before the revamping of the list of local tax handles with the introduction of the 2011 Tax Code, per capita revenue had been
steadily declining capita terms (Figure 70). This might be explained in part by the economic crisis. The decline in per capita
revenues had been larger in cities with declining population.
Abolishment of a plethora of unproductive local taxes with the 2011 Tax Code coincided with a dramatic increase in per capita
revenues. Cities that had experienced a larger revenue loss before 2011 also saw larger revenue increase in the years
after. Throughout this up-and-down cycle, there is a noticeable association between the rate of population decline and
the levels of local tax collection (Figure 71).
93
Single tax Business patents
200
100
0
UAHpercapita
Declining but less than urban averagePositive growth Declining but less than national average
4
2
0
UAHpercapita
Real estate tax Parking fees Tourist tax
UAHpercapita
250
200
100
50
0
150
Small towns Small cities Mid size cities Major citiesMid size towns Large towns
Single tax Business patents
UAHpercapita
Real estate tax Parking fees Tourist tax
0
1
2
3
4
Ukraine_2015_nov26.indd 93 2015-11-26 5:14 PM
CHAPTER 2 Cities and the Inter-Governmental Fiscal System
Figure 70 – Per capita revenue from own taxes and the night light typology of sub-oblast cities, in
UAH, 2013
Figure 71 – Per capita revenue from own taxes and population decline of sub-oblast cities, in UAH, 2013
Note: Due to lack of data, bottom tier cities are not included.
A: Growing light intensity in expanding periphery;
B: Declining in all aspects;
C: Dimming periphery;
D: Growing light intensity in shrinking footprint;
E: Declining economic activities in the core, growing area with stronger peripheries;
F: Thriving core, shrinking footprint.
Note: Due to lack of data, bottom tier cities are not included.
94
2006 2007 2008 2009 2010 2011 2012 2013
A
B
C
D
E
F
No type
250
100
150
200
50
0
UAHpercapita
Positive growth
Declining but less than
urban average
Declining but less than
national average
Declining more than
national average
UAHpercapita
250
100
150
200
50
0
2006 2007 2008 2009 2010 2011 2012 2013
Ukraine_2015_nov26.indd 94 2015-11-26 5:14 PM
CHAPTER 2 Cities and the Inter-Governmental Fiscal System
Shared Tax Revenue and Other Transfers
Local governments are assigned a share of revenues from national taxes (e.g., PIT) on a derivation basis. That is, these
revenues are (partially) shared with the locality where they are collected. In addition to the PIT revenues, until 2015
top-tier local governments also received 50% of the revenue from royalties on forests, water, and mineral resources of
national significance (except oil and gas), and 100% revenue from other common natural resources (including land) and
excise taxes. The 2015 amendments to the Budget Code changed sharing rates for many of these taxes. In addition, the
national property taxes on land and vehicles, the revenues from which had been previously allocated to local budgets, now
have become entirely local taxes.
Under this derivation-based sharing, national government taxes are collected by the national tax authorities. Then they are
partially (or fully in the case of the land tax) allocated to the budget of the local government in whose territory collection
takes place. This revenue-sharing occurs based on uniform sharing rates (so that all lower-level government jurisdictions
receive the same share of revenues collected within their jurisdiction as in the case of excise tax revenues) or based on a
differentiated sharing rate structure in which different jurisdictions receive a different percentage of the shared revenue
source, as in the case of PIT.
Until the recent amendments to the Budget Code, the rates of derivation-based sharing of revenue from the national
PIT were as following106
: Up to year 2014, the City of Kyiv received 50% of the PIT revenue collected in its territory (40%
stating in 2015), (i) Up to year 2014, The City of Sevastopol received 100% of the PIT revenue collected in its territory,
(ii) 75% of the PIT revenue was allocated to the budget of the districts and sub-oblast cities where collection takes place
(60% starting in 2015), (iii) 25% of the PIT revenue was allocated to the budget of the bottom-tier jurisdiction where
collection takes place (ending in 2015).
The derivation-based sharing of revenues from national taxes is complemented by explicit grants from the national government
to oblasts and districts and from there passed on to constituent cities and rural municipalities. As can be seen from Figure
61 above, grants from the central budget to sub-national levels have been steadily increasing from a 5.95 percent share
of GDP in 2007 to 8.53 percent in 2012 and then slightly reversing to 7.70 percent of GDP in 2013.
This non-transparent discretionary process was replaced with a formula-driven equalization system for local government
finances as part of substantial reforms initiated with the adoption of the Budget Code in 2001. The major changes brought
by the Budget Code included reassignment of expenditure responsibilities among different levels of government; long-
term assignment of shares from national tax revenues to local governments at the point of collection; formula-based
calculation of the equalization grants; clear and transparent structure of the earmarked transfers; and the articulation
of the conditions and limits on local borrowing. As a result, the formulation of local government budgets started being
based on more objective, neutral criteria using a uniform formula across the country to compute revenue capacity and
expenditure needs.
The legal basis for the present system of inter-governmental transfers is provided by the Budget Code (Article 96). Before
changes in 2015, the 2001 Budget Code envisioned four types of transfers: equalization grants, (i) subventions, (ii)
additional grants, (iii) other funds transferred to the state budget and local budgets from other local budgets (mutual
settlements).
106 The sharing rates are mostly an outcome of political bargaining. Thus, the recent reduction of Kyiv City’s share in the PIT revenues from 50
to 40 percent was initially proposed as 20 percent.
95
Ukraine_2015_nov26.indd 95 2015-11-26 5:14 PM
CHAPTER 2 Cities and the Inter-Governmental Fiscal System
Equalization grants aim to cover the gap between assessed expenditure needs and “potential” revenue from own and
shared taxes. Until the recent amendments to the 2001 Budget Code, the total pool of equalization transfer funds had
been comprised of negative transfers from rich jurisdictions and topped up with annual appropriations from the national
budget. Thus, the overall size of the available pool of funds had been arbitrary and non-fixed. Currently, some of these
central government grants are passed by districts to sub-district municipalities. The additional equalization transfers are
allocated among regions based on specific features of depressed and mountainous areas, and areas with low population
levels and the network of public institutions. Thus, no less than three-quarters of additional equalization grants has to
be passed on by oblasts to the sub-oblast units.
Subventions are used to transfer funds to be used by the recipient government for the purpose – and in the manner
– specified by the grantor. They are mostly used to fund social entitlements delegated to sub-national authorities for
fulfillment. Subventions can also be used to fund other earmarked uses such as public investment projects.
Additional grants are unplanned transfers allocated in the course of the fiscal year. They can be used to compensate local
governments for revenue losses resulting from changes to national government policies, such as tax preferences. They are
also used as a mechanism to share with local governments any over-collection of revenues from national taxes.
Other funds (mutual settlements) can be transferred between different governments in exchange for mutually-agreed
public services provided by the recipient of the transfer. For example, one local government can provide services to the
residents of other local governments.
In 2013, less than half of overall transfers came through equalization grants, which offered local governments both
predictability and discretion in allocating these resources according to local priorities (Figure 72). The rest came through
subventions, which were earmarked for specific uses, mostly to fulfill social entitlements.
Figure 72 – Composition of inter-governmental transfers to cities by type, 2013
Note:
A: Growing light intensity in expanding periphery;
B: Declining in all aspects;
C: Dimming periphery;
D: Growing light intensity in shrinking footprint;
E: Declining economic activities in the core, growing area with stronger peripheries;
F: Thriving core, shrinking footprint.
Additional grants
Mutual settlements
Subventions
Equalization grants
100%
90%
80%
70%
60%
50%
40%
30%
20%
10%
0%
No
type
A B C D E F
96
Ukraine_2015_nov26.indd 96 2015-11-26 5:14 PM
CHAPTER 2 Cities and the Inter-Governmental Fiscal System
In terms of the composition of inter-governmental revenues, there are no major differences observed among the night
light types of cities (other than a higher share of subventions in total transfers received by sub-types D and E). The high
transfer-dependency previously found for the no-type cities appears to be due to larger allocations of equalization grants.
Similarly, small allocations of equalization grants appear to be behind the lower transfer-dependency exhibited by sub-
types F and D.
Cities with larger population declines were associated with a smaller share of subventions, but a larger share of additional
equalization grants. This is not surprising given that the 2001 Budget Code required oblast governments to take into
account “specific features of depressed and mountainous areas, and areas with low population levels and a widespread
network of government-funded institutions” (Article 97). As the additional grants were more discretionary and ad hoc,
this suggests softer budget constraints for cities with larger population decline. Thus, larger allocations of grants per
capita to cities with population declining more than the national average were more likely to be related to under-utilized
social infrastructure than to a greater presence of a population entitled to social benefits – which would be funded with
subventions from the central government.
Figure 73 – Composition of inter-governmental transfers to cities by population trend, 2013
97
Additional grants
Mutual settlements
Subventions
Equalization grants
100%
90%
80%
70%
60%
50%
40%
30%
20%
10%
0%
Positivegrowth
Decliningbutless
thanurbanaverage
Decliningbutless
thannationalaverage
Decliningmorethan
nationalaverage
Ukraine_2015_nov26.indd 97 2015-11-26 5:14 PM
CHAPTER 2 Cities and the Inter-Governmental Fiscal System
Figure 74 – Composition of inter-governmental transfers to cities by population size, 2013
Conceptually, the amount of equalization grants from the national budget to local government budgets (which in reality were
originally derived from local government contributions to the equalization pool) was calculated as the difference between
estimated expenditure need of the given local government and the forecasted (by a uniform formula) amount of revenues to
be collected in the respective territory. The expenditure need for each local government was equal to the product of three
items: a) the basic expenditure norm (per capita, or per student, etc.); b) the population or the number of students, etc.
in the locality; and c) a set of coefficients that worked to adjust the expenditure need up or down for special needs and/
or differential costs of service provision. Among other things, the adjustment coefficients were based on the target ratio
of the number of employees of local self-government bodies in relation to the population level (Budget Code, Article 98).
The dozens of new adjustment factors that had been added to the formula over the years are believed to have undermined the
formula’s predictability while also entrenching inefficiencies. This is because the subsequent adjustments tie financing to
facility network characteristics and staffing levels; thus, they implicitly finance the existing network of service facilities
and staffing as opposed to funding an objective demand for services107
.
107 Id. World Bank. 2008
Larger cities received a larger share of inter-governmental grants in the form of subventions and additional grants while
their share of equalization grants was smaller (Figure 74). This reduced allocation of equalization grants to major cities
might reflect both higher yield of locally-derived revenues and smaller estimates of expenditure needs due to better
utilized infrastructure. At the same time, larger per capita allocations of additional grants to bigger cities might reflect
their better bargaining power before the central government.
98
Additional grants
Mutual settlements
Subventions
Equalization grants
100%
90%
80%
70%
60%
50%
40%
30%
20%
10%
0%
Small
towns
Mid size
towns
Large
towns
Small
cities
Mid size
cities
Major
cities
Ukraine_2015_nov26.indd 98 2015-11-26 5:14 PM
In addition to allocating equalization grants for oblast and sub-oblast units, the national government also set minimum per
capita (per client) norms to be used by district governments in allocating equalization grants among constituent units. The
allocation of intra-district equalization transfers had to be approved by the respective oblast government; if the district
budget was not adopted on time, the allocation of intra-district equalization grants was to be decided by the oblast
government.
In 2015, the system of equalization grants was substantially revamped. According to the explanatory note accompanying
amendments to the Budget Code, the new equalization grants (now called “basic grant”) will be of a compensatory
nature and aim at bridging disparities in revenue capacity of local governments related to derivation-based sharing of
the personal income tax and corporate income tax. A new equalization system will be based on the per capita level of
revenues. By contrast, the previous system was based on the gap between per capita expenditure needs and revenue
projections. Now, if the local yield of the shared tax exceeds the national average by 10 percent or more, half of this
surplus revenue is withdrawn into the State budget (a negative grant). In the opposite case of a below-average yield of
the shared tax, the State will only compensate 80% of the shortfall.
Local revenues from other sources are not subject to equalization and shall remain at the complete disposal of local
budgets.
Since education and healthcare expenditure needs are no longer covered by the equalization grants, a new system of earmarked
subventions will be implemented, also based on a formula approach (to be established by the Cabinet of Ministers of Ukraine)
At the same time, the amendments to the Budget Code mandate that the purpose of the funds from these new
subventions will be for long-term programs and projects. In addition, funds remaining at the end of the fiscal year will no
longer be withdrawn into the State budget, but can be used for renewal of the material and technological base of relevant
institutions. This dramatic departure from the previous system is expected by the Government, among other goals, to
help improve the efficiency of using budgeted funds since local governments will no longer try to expend subvention
resources “at any price” at the end of the year without regard for whether an expenditure is an efficient one.
CHAPTER 2 Cities and the Inter-Governmental Fiscal System
99
Ukraine_2015_nov26.indd 99 2015-11-26 5:14 PM
III. Analysis of Expenditures
While cities account for over 60 percent of total national population, in 2013 they accounted for 57 percent of sub-
national expenditures on education and 46 percent of sub-national expenditures on health care, but 77 percent of
sub-national expenditures on housing and utilities. This suggests that in per capita terms, cities spend on health care
less than two-thirds of the amount spent on these services provided to the population outside of cities. Similar to the
consolidated sub-national expenditures shown in Figure 61, in 2013 the three social sectors (education, health care, and
social welfare) accounted for over 80 percent of city expenditures (Figure 75 below).
In terms of functional composition of city expenditures, there are no major differences among night light types. The only
exception is sub-type F (thriving core, shrinking footprint), where a smaller share is allocated to the three social services
while a larger share is allocated to Housing and Utilities and other non-social services, in particular Economic Affairs.
However, there are wide disparities across city sub-types in per capita levels of expenditures on each function. The highest
per capita expenditures are observed in sub-types B (Declining in all aspects) and E (Growing light intensity in expanding
periphery). These high per capita expenditures in sub-types B and E are driven by the three social services, in particular
social protection. The lowest per capita expenditures are observed in sub-types D (growing light intensity in shrinking
footprint) and F (Thriving core, shrinking footprint). As indicated above, the greatest amount of inter-governmental grants
were allocated to sub-types B and E, while the least amount was allocated to sub-types D and F. Thus, the disparities
among city categories appear, if not directly caused, then accommodated with the allocation of inter-governmental
grants. One possible explanation is the use of the public sector as an employer of last resort in declining cities. At the
same time, it appears that a shrinking footprint in the presence of some economic growth is associated with smaller
amounts of per capita expenditures and grants.
CHAPTER 2 Cities and the Inter-Governmental Fiscal System
Figure 75 – Functional composition of city expenditures by sub-type, 2013
Note:
A: Growing light intensity in expanding periphery;
B: Declining in all aspects;
C: Dimming periphery;
D: Growing light intensity in shrinking footprint;
E: Declining economic activities in the core, growing area with stronger peripheries;
F: Thriving core, shrinking footprint.
100
Other Health CareSocial Welfare EducationHousing and Utilities
UAHpercapita
10,000
8,000
4,000
2,000
0
6,000
A
B
C
D
E
F
Notype
%oftotal
100%
80%
40%
20%
0%
60%
A
B
C
D
E
F
Notype
Ukraine_2015_nov26.indd 100 2015-11-26 5:14 PM
17
At least for the intermediate-tier cities, there is a divergence in per capita expenditures on social sectors among night light
categories of cities until 2012 (Figure 76). However, the overall reduction of sub-national expenditures in 2013 had a
greater impact on the expenditures of sub-type B cities and cities without any type. These are the cities showing highest
per capita expenditures in 2009-2012. At the same time sub-types D and F, having the lowest per capita expenditures,
actually saw an increase in expenditures on education and social welfare in 2013. Thus, 2013 might represent the first
year of rationalizing under-utilized social infrastructure in small cities.
108 Empirical studies from other countries suggest that economies of scale in the delivery of municipal services are mostly exhausted at an
average size of 10,000 inhabitants, even though there are some special services, such as urban transportation and solid waste utilization, where
economies of scale improve up to the size of 100,000 inhabitants (Lago-Peña and Martinez-Vazquez, 2013)
Furthermore, there are 47 outlier cities (or 10 percent of all cities) with levels of per capita current expenditures more than
four times the median level. These outliers represent 468,000 people (1.7%) out of the 27.5 million total city population of
the country, but account for 10% of the total expenditures of cities.
These extremely high levels of per capita expenditures in outlier cities appear to be primarily driven by the small scale of
service provision since their average population is six times smaller than the average city.108
All but three outliers fall into
the categories of small and mid-size towns. In fact, in all types of cities we observe an inverse relationship between
population size and per capita expenditure in all sectors except Housing and Utilities and other non-social sectors (Figure
77). In social sectors, larger cities can enjoy lower unit costs as their large population size allows them to take advantage
of economies of scale. These economies of scale are particularly visible in the Education and Social Welfare sectors.
But large cities also need to spend more on urban infrastructure to deal with urban congestion. For larger cities, higher
per capita expenditures on non-social sectors might reflect either higher costs for the same level of services or more
extensive and/or better quality of services. Indeed, larger municipalities are able to provide a larger scope of services (and
often better quality of services) than very small municipalities; thus, their per capita expenditures capture both lower
costs and better services.
CHAPTER 2 Cities and the Inter-Governmental Fiscal System
Figure 76: Per capita expenditures on social sectors by night light category in sub-oblast cities, in
UAH, 2013
101
1,700
1,500
1,300
1,100
900
700
2009 2010 2011 2012 2013
Education
2009 2010 2011 2012 2013
Social Welfare
1,500
1,300
1,100
900
700
500
A B C D E F No type
Ukraine_2015_nov26.indd 101 2015-11-26 5:14 PM
Possibly due to their small size, the outlier cities disproportionally fall into the Appear and Missed types. As a result, half
of the outliers are unclassified in the night light topology. Of those that are classified, over two-thirds are sub-type B
(Declining in all aspects), which is greater than the proportion for all cities. Earlier we saw that cities in sub-type B and
those without any type receive the highest per capita amount of inter-governmental grants.
Furthermore, the sub-optimal scale of service provision in the 47 outlier cities does not seem to have been caused by
population decline. In fact, only one-third of outliers have population declining more than the urban average and a quarter
of them actually experienced population growth. There appears to be a clear U-shape relationship between population
decline and per capita expenditures in all sectors except Housing and Utilities (Figure 78). Higher rates of population
decline are associated with lower per capita expenditures in those sectors – except for cities declining more than the
national average, where per capita expenditures are almost as high as in growing cities. This might be due to an interplay
between availability of resources and economies of scale. Cities with population decline less than the national average
might exhibit lower per capita expenditures dues to lower resource availability. However, with higher rates of population
decline, the lack of economies of scale outweighs low resource availability, which cities offset by obtaining larger inter-
governmental transfers. This U-shape relationship persisted throughout 2009-2013 (Figure 79).
CHAPTER 2 Cities and the Inter-Governmental Fiscal System
Figure 78 –Per capita expenditures by function and population trend, 2013
Figure 77 – Average per capita expenditures by function and city population size, 2013
102
Sm
alltowns
Largetowns
Sm
allcities
Midsizecities
Majorcities
Midsizetowns
Education
Healthcare
Social welfare
Housing and Utilities
Other
5,000
4,000
3,000
2,000
1,000
0
UAHpercapita
Education
Healthcare
Social welfare
Housing and Utilities
Other
3,500
UHApercapita
3,000
2,500
2,000
1,500
1,000
500
0
Positivegrowth
Decliningbutlessthan
urbanaverage
Decliningbutlessthan
nationalaverage
Decliningm
orethan
nationalaverage
Ukraine_2015_nov26.indd 102 2015-11-26 5:14 PM
In terms of the economic composition of city expenditures, again there are no major differences among nightlight types. The
exception is a higher share of expenditures on current transfers and capital expenditures in sub-type F (see Figure 80).
One has to note the small share of city budgets allocated to capital expenditures, ranging from just 2.6 percent of total
expenditures in sub-type C cities to 10.9 percent in sub-type F cities. At the same time, the combined share of payroll
and social security expenses exceeds three quarters in all city types except sub-type F.
CHAPTER 2 Cities and the Inter-Governmental Fiscal System
Figure 79 – Per capita expenditures on social sectors by population decline in sub-oblast cities, in UAH,
2013
Figure 80 – Economic composition of city expenditures by city typology, 2013
Note:
A: Growing light intensity in expanding periphery;
B: Declining in all aspects;
C: Dimming periphery;
D: Growing light intensity in shrinking footprint;
E: Declining economic activities in the core, growing area with stronger peripheries;
F: Thriving core, shrinking footprint.
103
Education
2,100
1,900
1,700
1,500
1,300
1,100
900
700
2009 2010 2011 2012 2013
Social Welfare
1700
1500
1300
1100
900
700
500
2009 2010 2011 2012 2013
100%
90%
80%
70%
60%
50%
40%
30%
20%
10%
0%
Capital transfers
Capital assets
Other current outlays
Social security
Current transfers
A B C D E F No
type
Positive growth Declining but less than
urban average
Declining but less than
national average
Declining more than
national average
Ukraine_2015_nov26.indd 103 2015-11-26 5:14 PM
CHAPTER 2 Cities and the Inter-Governmental Fiscal System
Figure 81 – Economic composition of city expenditures by city population size, 2013
There is a clear relationship between the economic composition of city expenditures and a city’s population size (Figure 81).
Larger cities allocated a smaller share of their expenditures to social security and labor, while allocating a larger share
to goods and services and capital investments (as well as larger current transfers, mostly likely related to municipal
enterprises). The higher payroll share in small towns might reflect fixed costs of labor-intensive social services like
education. However, lower expenditures on supplies and capital inputs are likely to lower productivity of these same staff.
Indeed, the economies of scale are primarily driven by outlays on payroll and social security (Figure 82). Not only that
these two economic categories represent the bulk of city expenditures, in per capita terms they are significantly higher
proportion of expenditures by smaller cities.
There appears to be a clear U-shape relationship between population decline and per capita expenditures on Labor and
Social security (Figure 83). Higher population decline is associated with lower per capita expenditures – except for cities
declining more than the national average, where per capita expenditures are almost as high as in growing cities. As
conjectured earlier, this might be due to an interplay between resource availability and economies of scale. While growing
cities might have resources for a larger and better-paid labor force, the fixed cost of staff might make per capita outlays
increase substantially when the denominator (population) drops significantly.
104
100%
90%
80%
70%
60%
50%
40%
30%
20%
10%
0%
Sm
alltowns
Largetowns
Sm
allcities
Midsizecities
Majorcities
Midsizetowns
Capital transfers
Capital assets
Other current outlays
Social security
Current transfers
Interests
Ukraine_2015_nov26.indd 104 2015-11-26 5:14 PM
CHAPTER 2 Cities and the Inter-Governmental Fiscal System
Figure 82 – Economies of scale by economic item, 2013
Figure 83 – Economic composition of city expenditures by population trend, 2013
105
Goods and services
Interest
Current transfers
Social security
Other current outlays
Capital assets
Capital transfers
Labor
UHApercapita
Smalltowns
Midsizetowns
Largetowns
Smallcities
Midsizecities
Majorcities
7,000
6,000
5,000
4,000
3,000
2,000
1,000
0
Goods and services
Interest
Current transfers
Social security
Other current outlays
Capital assets
Capital transfers
Labor
UHApercapita
Positive growth Declining but less
than urban average
Declining but less
than national
average
Declining more than
national average
4,000
3,500
3,000
2,500
2,000
1,500
1,000
500
0
Ukraine_2015_nov26.indd 105 2015-11-26 5:14 PM
In 2013, Ukraine’s sub-national capital investment was quite low at 0.95 percent of GDP. However, this reflected an overall
low level of public investments in the country; the sub-national share of total public sector investment (48%) is roughly
proportional to the sub-national share in the overall sub-national expenditures (44%). However, sub-national governments
typically have a larger share of capital expenditures than recurrent expenditures because municipal services tend to
be more capital-intensive than national functions, which are dominated by social services and income redistribution
programs109
. In Ukraine, on average, capital expenditures accounted for about three percent of total city expenditures in
2013. Cities comprised 63% of sub-national capital expenditures, a proportion only slightly higher than their share of the
total national population.
More than half of capital spending by cities is outside the three social sectors (Figure 84). In all types of cities except
sub-type D (Growing light intensity in shrinking footprint), the largest share of capital expenditures goes to Economic
Affairs. Capital expenditures account for less than 15 percent of city expenditures in all sectors except Economic Affairs,
Environmental Protection, and Housing and Utilities, where the share of capital expenditures is 76%, 68%, and 25% of
total city expenditures, respectively.
109 Martinez-Vazquez, Jorge, and Andrey Timofeev. 2012. “Propensity to Invest and the Additionality of Capital Transfers: A Country Panel
Perspective” International Studies Program Working Paper 12-16. International Studies Program, Andrew Young School of Policy Studies,
Georgia State University.
CHAPTER 2 Cities and the Inter-Governmental Fiscal System
Figure 84 – Composition of capital expenditures by function and city typology, 2013
Note:
A: Growing light intensity in expanding periphery;
B: Declining in all aspects;
C: Dimming periphery;
D: Growing light intensity in shrinking footprint;
E: Growing light intensity in expanding periphery;
F: Thriving core, shrinking footprint.
106
Physical and intellectual development
system
Social welfare
Education
Healthcare
Housing and municipal
economy
100%
80%
60%
40%
20%
0%
A B C D E F No
type
Ukraine_2015_nov26.indd 106 2015-11-26 5:14 PM
In the Education and Health care sectors, per capita capital expenditures decrease with the size of a city, while in Housing
and Utilities and other non-social sectors they increase (Figure 85). This is consistent with the patterns found for total per
capita expenditures in those sectors.
Per capita capital investments are lower in cities with population declining more than the national average (Figure 86). This
is mostly driven by city investments in non-social sectors other than Housing and Utilities, in particular Economic Affairs
and Public Administration.
CHAPTER 2 Cities and the Inter-Governmental Fiscal System
Figure 85 – Per capita capital expenditures by function and population size, 2013
Figure 86 – Per capita capital expenditures by function and population trend, 2013
107
Education
Healthcare
Social welfare
Housing and Utilities
Education
Healthcare
Social welfare
Housing and Utilities
Other sectors
Other sectors
UHApercapita
Smalltowns
Midsizetowns
Largetowns
Smallcities
Midsizecities
Majorcities
250
200
150
100
50
0
UHApercapita
Positive growth Declining but less
than urban average
Declining but less
than national
average
Declining more
than national
average
160
140
120
100
80
60
40
20
0
Ukraine_2015_nov26.indd 107 2015-11-26 5:14 PM
IV. Cities and the Fiscal System
This study examined public finances of all cities at all three tiers of sub-national government. Some of the patterns found
in this chapter reflect the fact that different tiers of sub-national government had – and in the case of Kyiv still have –
different assignments of revenue sources and functional responsibilities. Thus, larger cities tend to depend less on explicit
grants, while relying more on non-tax revenues and locally-retained shares of national taxes. However, this pattern is not
driven by demographic trends, but by the fact that larger cities tend to be at higher tiers in the administrative hierarchy
of sub-national government. Thus, until 2015, a larger share of national tax revenue (e.g., PIT) was allocated to the
budgets of higher-tier cities than to the budgets of bottom-tier cities.
While at 60,000 residents the average size of a Ukrainian city makes it possible for an average city to provide major social
services, including education and health care, almost a quarter of the country’s cities have fewer than 10,000 residents.
While this might be too small to achieve the minimum efficient scale of provision, this challenge is somewhat mitigated
by the fact that most major social services are delegated to the oblast and sub-oblast tiers, leaving sub-district cities
responsible only for pre-school education and cultural/recreational centers. Nevertheless, there is an inverse relationship
between population size and per capita expenditures, particularly concerning the Education and Social Welfare sectors.
In 10 percent of Ukraine’s cities, per capita expenditures are more than four times higher than the median level. Although
just 1.7% of the population of all cities, these outlier cities account for 10% of expenditures of all cities. The extremely high
levels of per capita expenditures appear to be primarily driven by the small scale of service provision since the population
of these cities is six times smaller than in an average city. Across all cities there are increasing economies of scale in all
social sectors except hard municipal services such as Economic Affairs and Housing and Utilities. These economies of
scale are particularly pronounced in the Education and Social Welfare sectors and primarily related to payroll costs and
welfare benefits. As a result, larger cities allocate a smaller share of their expenditures to Social Security while a greater
share is allocated to Goods and Services and Capital Investments. The share of city expenditures allocated to capital
investments ranges from 1.6% in small towns to 9.4% in major cities. Per capita investments are lower in cities where
population is declining more than the urban average.
While cities are housing the bulk of national population and driving the economic growth, until 2015 their fiscal fortunes
had been determined by the overall system of inter-governmental relations in the country. This was particular true for
sub-district cities – which relied on intermediation by district authorities in their financial affairs – as over 80 percent
of city revenues were not locally-derived but came from retained shares of national taxes and other transfers. Despite
attempts to introduce formal criteria for the allocation of inter-governmental financial resources, government transfers
were not based on an objective demand for services but largely financed the existing network of service facilities and
staffing. Such financial disincentives, combined with legal constraints on local government discretion in downsizing the
network of facilities and their staff, impeded fiscal adjustments necessitated by demographic and economic changes.
Not surprisingly, differences in expenditure patterns among different categories of cities had strong associations with
the incidence of grants but little relationship to the amount of locally-derived revenues. By disregarding expenditure
needs altogether, the new general-purpose grants can remove financial disincentives that optimize networks and staff
in hard municipal services. However, by earmarking new subventions separately for Education and Healthcare, the new
system can further entrench under-utilized social infrastructure unless the subvention formulas focus on service needs
as opposed to capacity of existing facilities.
The only area where there is a clear relationship between city finances and a city’s economic base is in the use of own
tax instruments, which produced more revenues in cities thriving in all respects (sub-type A). Similarly, cities with higher
population decline appear to raise less own-source revenues per capita. However, because these own sources of revenue
CHAPTER 2 Cities and the Inter-Governmental Fiscal System
108
Ukraine_2015_nov26.indd 108 2015-11-26 5:14 PM
account for a tiny fraction of city revenues, they make virtually no difference in their financial condition. However,
when the right incentives are embedded in the system of inter-governmental fiscal relations, even existing local tax
instruments can be utilized more fully by city governments to generate more significant revenue. While for reasons of
efficiency structures should be taxed less than land, the currently negligible levels of collection from this local property
tax (less than 0.01% of GDP) can be significantly increased.
Until 2015, business taxes had been the most utilized out of all tax handles available to city governments in Ukraine. By
far the largest per capita yield is observed for the Single Tax, which is paid by small businesses in lieu of the income tax
and other national taxes. While taxation of businesses might be more expedient from both political and administrative
perspectives, it is not as conducive to accountability and fiscal responsibility as taxing residents. Also, revenues from
taxation of business are likely to be more volatile and thus can exacerbate the impact of urban decline. Revenues from
property taxes, even when based on market values, are known to be less elastic.
As with the reliance on business taxes, derivation-based sharing of revenues from national taxes, such as PIT, can amplify
the revenue impact of urban decline. Derivation-based sharing makes local government revenues more volatile than
formula-based sharing of revenue from national taxes. Pooling the sub-national share of revenues from national taxes in a
redistribution fund and then allocating to each locality on a formula basis would reduce the volatility of revenue streams
for cities by offsetting cyclical fluctuations in tax payments from various businesses located in individual localities.
Furthermore, derivation-based revenue sharing makes it difficult to account for revenue capacity in the allocation of
equalization grants. This is because there are no statistical indicators available that objectively capture differences in
taxable bases at the bottom-tier level. By using lagged collections as a proxy for revenue capacity, equalization grants
discourage mobilization of own revenues. By contrast, revenue sharing entirely based on a per capita formula, combined
with adjustments for objective differences in expenditure needs, would provide each city with a predictable budget
envelope and allow them to keep any gains achieved by rationalizing their expenditures. Formula-based revenue sharing
combined with a hard-budget constraint can provide the right incentives for self-sufficiency.
While being more stable and predictable, formula-based sharing of PIT is not a substitute for a genuine source of own
revenues. While derivation-based sharing has some of the same features of local taxes, only the latter can provide
local revenue autonomy because – unlike revenue sharing – surtaxes allow local governments a certain measure of
discretion over the tax rate, and thus the ability to control their revenue on the margin. Thus, while sharing of PIT can
contribute to the financing of local governments, it does not contribute to achievement of a level of revenue autonomy by
local governments and to their subsequent increased accountability and fiscal responsibility. High dependence on inter-
governmental revenues raises the question of whether cities control their revenues or whether the revenues control the
cities’ policies.
Increased revenue autonomy can lead to greater accountability and creates the basis for local creditworthiness. First, endowing
local governments with a degree of revenue-raising authority allows them to increase or decrease those expenditures over
which they have responsibilities based on the needs of their constituency110
. Second, local taxpayers will have a strong
interest in ensuring that local officials use local budget resources wisely. Dependence of local governments on the revenue
decisions of the central government (including decisions concerning sharing revenue from national taxes and most other
forms of transfers) undermines the accountability of local officials to their constituency.
CHAPTER 2 Cities and the Inter-Governmental Fiscal System
110 Thus revenue autonomy does not require that local governments control (i.e., determine bases and rates) for all their revenue sources. It
would suffice if they could increase or decrease rates for a few taxes that comprise a meaningful share of their revenues with the rest coming
from the predictable and stable sharing of national tax revenues. However, there would be little revenue autonomy if any additional revenue
from higher local taxes were almost entirely offset with a reduction in grants.
109
Ukraine_2015_nov26.indd 109 2015-11-26 5:14 PM
Broadening revenue-raising powers of city governments can be achieved through a combination of reforms related to
tax administration and enforcement and tax assignment policy changes. Given that the most expensive local functions
(Education, Health care, and Social Protection) are to be financed with earmarked grants starting from 2015, the
remaining (own) local functions can to a large extent be covered by fully utilizing the ‘tax handles’ that have traditionally
been given to local authorities throughout the world (user fees, property taxes, and betterment levies) as well some
additional taxes, including vehicle and transportation taxes and a PIT surtax (or piggyback). While Ukraine’s cities have
always received a share of revenue from some of these taxes levied by the national government (land tax and vehicle tax),
until 2015 they were passive recipients of these monies and thus could not affect this revenue on the margin.
The recent introduction of earmarked financing of social services, including Education and Health, should allow cities to
focus on their core functions, such as urban infrastructure. However, local governments can also play an important role
in the process of rationalization of the school network. Besides realizing the economies of scale in managing the network
of schools – for example, by sharing specialized staff or custodial services among schools – local governments could also
realize economies of scope in using the same facility for several functions such as education and culture. In these matters
of coordination and rationalization, local governments have an information advantage over the central government. In
addition, local governments can be instrumental in securing community consent for network rationalization by facilitating
bargaining among affected parties (i.e., among winners and losers). For example, it is much harder to justify the closure
of a school to the local community when the savings cannot be shifted to other services, which may be more critical for
the community.
In the short term, the focus of reforms should be on increasing the yield of user fees and property taxes, and perhaps
introducing several new local taxes. Establishing minimum rates for these taxes (as exists for the Single Tax) could be an
effective way to make cities assume to a minimal extent their responsibility to collect own revenues. In the medium term,
the reassignment of those other taxes from national to sub-national levels will bring very desirable improvements to city
finances, including increased horizontal accountability of local officials to their residents and greater fiscal responsibility
in expenditure and debt management at the sub-national level.
CHAPTER 2 Cities and the Inter-Governmental Fiscal System
110
Ukraine_2015_nov26.indd 110 2015-11-26 5:14 PM
111
Ukraine_2015_nov26.indd 111 2015-11-26 5:14 PM
112
Ukraine_2015_nov26.indd 112 2015-11-26 5:14 PM
113
CHAPTER 3
Urban Planning
and the Spatial
Development
Ukraine_2015_nov26.indd 113 2015-11-26 5:14 PM
Key Highlights and Implications for Further Policy
and Analytical Work
Urban planning in Ukraine bears the legacy of a centralized planning system. It is not sufficiently flexible to respond to
market conditions and be an effective tool in developing the urban space. Centralized development of master and zoning
plans is inefficient, costly and distant from realities on the ground. It is also not sufficiently transparent or welcoming
to public input and debate. In addition, the planning framework is not equipped to adequately support strategies that
reflect the reality of population loss and economic decline. Existing urban plans are aligned with national growth policies,
and so propose expansions of housing and economic activity across all cities.
Recent steps orchestrated in the Government’s Action Plan on Decentralization towards a planning reform, if implemented
in full, have the potential to place planning at the local level, which will permit cities to determine their own priorities
along their economic and social needs. It will promote a more transparent system resulting in plans more closely attuned
to the actual conditions of growing and shrinking cities. Such changes will require increased funding and intense capacity
building at the local level.
Going forward, urban planning and spatial development should take note of the continuous demographic changes and
shifts in the country. Current mobility remains low and the high homeownership rate has prevented the widespread
housing abandonment that characterizes typical shrinking cities in Europe and United States. Once mobility increases
and people start migrating to opportunity, declining cities are likely to decline even faster, while the growing centers
and agglomerations may experience peri-urban growth and sprawled development. In both cases, authorities will need
to reassess how infrastructure is planned and maintained to ensure that shrinking cities continue to provide acceptable
levels of service to their population at a reasonable cost, while growing urban centers are supported to further foster
growth.
CHAPTER 3 Urban Planning and Spatial Development
114
Ukraine_2015_nov26.indd 114 2015-11-26 5:14 PM
17
National Laws and the Reform Process
Urban planning in Ukraine has evolved since independence, but still bears the legacy of a centralized planning system
inherited from the Soviet era, a time when urban development was under state control. The planning system has adopted
international standards such as streamlining building permit procedures; encouraging public participation; and increasing
access to planning information. However, the principal challenge remains: to bring legislation and practice in line with
contemporary standards that allow increased flexibility for local level planners to manage development. As a result,
local governments in Ukraine are yet to capitalize fully on typical urban planning strategies - attracting investment,
revitalizing the housing market, modifying infrastructure, revitalizing city centers aimed at stemming decline, and focusing
on reducing the urban footprint111
.
Over the past 20 years, urban planning reform in Ukraine shifted between centralized and decentralized planning models
- and back - which caused disruption in local government’s allocation of land and issuance of permits and stifled potential
market demand for urban land. Three national-level laws were passed in this period to govern urban legal, regulatory,
and institutional processes. Requirements for stakeholder participation and procedural transparency were modernized
through two key national-level urban planning laws. The Law of Urban Development (1992) was Ukraine’s first post-
independence law that maintained the centralized Soviet system and gave primary planning, monitoring and execution
powers to the State Architectural and Construction Inspection Agency (SACI). Under this law, regional and district
councils had secondary planning authority, while local government’s function was to simply monitor implementation of
government programs. The law did, however, give local governments the power to approve planning documentation on
territory located in their jurisdiction. The subsequent Reform Law of Urban Planning (2011) simplified planning procedures.
However, while local government obtained the power to plan and influence land use, spatial development, and zoning
ordinances, they did still not have the power to prepare Master Plans themselves. Instead, these continued to be prepared
by a central planning agency. Furthermore, although the 2011 law mandated cities to have master plans and new zoning
plans within months of the law’s approval, no funding was made available to cities to make these provisions a reality
(See Annex VIII for more detail). In the absence of a mandated plan, many local governments temporarily stopped re-
allocating land plots and issuing local permits in the absence of transitional arrangements; this stifled market-led spatial
and economic development. At the same time, another 2011 law – Law on Regulation of City Construction Activities
and State Construction and Architecture Control – streamlined the planning development process by reducing the time
allowed for government to process and approve permits and certificates from 415 days to 60 days.
A series of so called centralization laws112
approved between 2012 and 2014 further shifted urban planning powers
from regional and local governments back to the executive branch of the central government (See Annex VIII). The
overall effect of these laws with respect to urban planning was the re-centralization of previously local functions to
the national level, including zoning ordinances, building contracts, permits, and communal housing. In doing so, the 2012
laws placed tremendous administrative burden on the Ministry of Regional Development, Construction, Housing and
Communal Services (MinRegion) without providing commensurate increases in human or financial resources, thereby
limiting implementation of the law’s new provisions. The Law increased the authority of the central government in urban
planning, further diminishing the power of regional and local governments.
I. Regulatory and Institutional Framework
111 Empirical studies from other countries suggest that economies of scale in the delivery of municipal services are mostly exhausted at an
average size of 10,000 inhabitants, even though there are some special services, such as urban transportation and solid waste utilization, where
economies of scale improve up to the size of 100,000 inhabitants (Lago-Peña and Martinez-Vazquez, 2013).
112 In 2012, a series of so-called ‘centralization laws’ enacted by the national government mandated changes to a variety of laws including
those concerning urban planning.
CHAPTER 3 Urban Planning and Spatial Development
115
Ukraine_2015_nov26.indd 115 2015-11-26 5:14 PM
However, recent government initiatives, within the context of overall decentralization reforms in Ukraine, support the
delegation of urban planning functions to the local level. The Government’s Action Plan on Decentralization, published
in December 2014, and the 2015 amendments to the Law on Regulation of City Construction Activities and State
Construction and Architecture Control, if implemented in full, would permit cities to determine their own planning
priorities according to their economic and social needs. The reforms would also permit private development actors to
have full access to planning, zoning, and building information in order to facilitate a well-functioning land market. These
recent developments would bring current urban planning practices in line with contemporary international standards that
allow increased flexibility of local level planners in managing development.
Partly due to the fact that it is mostly centralized, Ukraine’s planning framework does not adequately support strategies
that address the reality of population loss and economic decline. The one exception is the Law on Master Scheme of
Territorial Planning of Ukraine (2002), which requires cities and other settlements to develop general city plans and
detailed territorial plans based on demographic forecasts. This should ideally capture cities that are potentially shrinking
or declining in population. However, there is little evidence that this law has been effective in guiding planning for such
declines. In general, existing urban plans are aligned with national growth policies that propose expansions of housing
and economic activity across all types of cities. While these policies are suited for cities that are growing, they do
not correspond with the realities of declining cities. These urban plans do not propose alternative uses for underused
industrial districts, brownfields, or abandoned buildings; such plans lock land from use and represent a lost economic
opportunity. Elsewhere, increased flexibility in urban planning has allowed declining cities such as Dresden in Germany to
undertake alternative development paths and adapt to demographic changes.113
Enforcing new regulations that have decentralized functions to the local level requires systemic changes including
increased funding and capacity building. Today, planning regulations required by law often remain unimplemented due
to insufficient funding or capacity. Many city-level General Plans114
(hereafter referred to as “Master Plans”), as well as
local zoning information, are outdated. Other planning elements, such as the requirement for citizen participation, are
ignored or subverted. Decentralizing urban planning places more responsibilities on local bodies; however, it can only be an
effective local development tool if local governments are enabled with the right set of capacities and financing.
Urban Planning Institutional Framework
The urban planning policy framework in Ukraine is fragmented between the nation’s legislative and executive bodies
and other public stakeholders. Various committees, ministries, agencies, and associations are responsible for elements
of urban planning policies that span physical, economic, and cultural development (See Table 15 and Annex VIII). On
the legislative end, two Verkhovna Rada (Parliament) Committees develop laws independent of other government
institutions. In addition, several central government ministries – the Ministry of Economic Development and Trade, the
Ministry of Culture, and MinRegion – make planning decisions within their respective areas of responsibility, i.e., economic
development, culture, and construction. Among them, MinRegion makes the majority of planning decisions. It is responsible
for the development and implementation of national policy on urban planning, architecture, housing construction, and
formulation of regional development policy. MinRegion also monitors the implementation of urban planning legislation
and initiatives. Other public players include the state scientific and research institutes, the most important among which
is the Ukrainian State Scientific Research Institute for Urban Planning (Dipromisto). Dipromisto develops the national
and regional General Plans and the city-level Master Plans as discussed in the next Section.
113 Dresden experienced a cycle of initial decline and regeneration between 1990 – 2002. In this period, the city went through three different
phases of planning policy – Phase I Ignoring Shrinkage/Going for Growth (1990-1995); Phase II Urban Restructuring (1996-2001); and Phase
III Re-urbanization (2002-onwards).
114 For ease of reference, this chapter will refer to the city level General Plans as Master Plans to avoid confusing them with the national and
regional level General Plans.
CHAPTER 3 Urban Planning and Spatial Development
116
Ukraine_2015_nov26.indd 116 2015-11-26 5:14 PM
Executive Legislative Brunch
Local legislative
Regional and Municipal
Authorities
Other Public Players
Ministry of Regional
Development, Housing
Construction, and Communal
Services. Agencies under its
authority:
1) State Architectural and
Construction Inspection (SACI)
2) State Service of Geodesy,
Cartography and Cadastre
(merged in 2015 with State
Agency of Land Resources and
Cartography Agency)
3) State Agency of
E-government
Ministry of Ecology and Natural
Resources of Ukraine
Ministry of Economic
Development and Trade
Ministry of Culture
Verkhovna Rada Committees:
1) Committee for Construction,
Urban Planning, and Communal
Housing
2) Committee for State
Construction, Regional Policy,
and Local Self-Government
Oblast and raion state
administrations, including
regional representative offices
of national agencies and
ministries
Oblast and raion councils
City councils and their
executive committees
Three state research and
scientific institutes:
1) Scientific Research Institute
Dipromisto
2) Scientific Research Institute
of City Construction
3) State Company “Ukrainian
State Scientific Research
and Planning Institute of Civil
Construction”
Communal enterprise “Institute
of Master Plan of Kyiv”
Association of Ukrainian Cities
Association of Small Cities of
Ukraine
Eastern Ukrainian Centre of
Community Initiatives
Another consequence of the current institutional set-up is that local governments are developing informal Strategic Plans,
which are not connected to the Master Plans, in an effort to wrest some control over their development. Strategic plans,
discussed in the next section, are developed by local government often with support from donor organizations, whereas
Master Plans are developed by Dipromisto and approved by the MinRegion. Ukraine’s centralized planning system requires
Master Plans for every settlement, but accords settlements little latitude in determining the content of those Plans.
Consequently, local governments have often chosen to generate strategic plans that take into account local views but
that have no formal relationship to the Master or General plans.
The overarching consequence of the current system is that it has rendered urban planning inflexible. Ukraine’s planning
system is centralized and often cannot take into account local conditions. The central government generally lacks the
flexibility or mechanisms to consider special conditions or local contexts, presenting particular challenges for smaller
cities that may need sensitive, small-scale planning policies to suit their particular conditions.
CHAPTER 3 Urban Planning and Spatial Development
The division of planning functions between government bodies creates structural challenges, ambiguity, and duplication
of efforts to formulating and implementing planning policy in Ukraine (Table 15). For instance, MinRegion authored
the Reform Urban Planning Law of 2011. Then in 2012, the Verkhovna Rada passed the centralization laws limiting
city governments’ planning powers and contradicting the Reform Urban Planning Law of 2011. Another consequence
of the current institutional set up is that it perpetuates potential conflicts of interest between agencies. For example,
Dipromisto defines the parameters of city-level Master Plans, but it is also the primary generator of such plans.
Table 15 - Urban planning and spatial development institutions
117
Ukraine_2015_nov26.indd 117 2015-11-26 5:14 PM
II. Spatial Planning
Ukraine sets a demanding standard by requiring spatial planning at all levels, from the scale of the entire nation to
the level of individual buildings, contrary to international best practice115
and with implications at the local level where
contexts and needs differ from city to city. There are three levels of spatial plans in the country, all of which are referred
to as “General Plans” and are further classified by the administrative territory they cover – national, regional, and local/
city-level. Under the current fiscally-strained condition of the country, planning standards are difficult for officials to
meet. Local General Plans (aka Master Plans) are time-consuming and expensive to produce and to update. National
planning institutes such as Dipromisto lack the staff to create and update local Master Plans, and cities do not have
enough resources to commission them. As a result, many Master Plans are old or outdated. In cases where sufficient
resources exist, as in Kiev, political disputes sometimes derail the effectiveness of the Master Plans and this in turn puts
lower-level planning decisions (e.g., zoning ordinances) on hold as they do not conform to the city’s Master Plan. Further,
zoning standards are predicated on city growth, but most Ukrainian cities are no longer growing. Even when Master
Plans are produced and updated, the task of creating and altering lower-level zoning and building codes is too costly
for fiscally-strained city-level planning departments to meet. A final challenge is that if zoning and building plans (i.e.,
architectural designs) exist, they are most often not made public, so it is impossible for interested private-sector actors
(e.g., developers) to access them.
General Plans
Ukraine has a national hierarchy of plans. At the national level, Dipromisto is responsible for developing the “General
Scheme for Planning of Territory,” or the General Plan of Ukraine, which essentially is a land-use planning and strategic
planning document for the nation (See Box 9). All subsequent spatial plans/general plans for regions, municipalities and
settlements are to conform to the General Plan for Ukraine, making the system inflexible and many times non-responsive
to local situations. Below the General Plan of Ukraine, Dipromisto116
also creates Regional General Plans for cross-
border zones, oblasts, and districts. As with cross-border zones themselves, the plans may spill over the administrative
boundaries of a specific district.
115 This national plan, or General Plan of Ukraine, is another legacy of Soviet-era planning where Territorial Spatial Plans were prepared for
the nation. Best practice suggests development of regional plans, city master plans, and local zoning plans and architectural plans /design of
buildings.
116 Dipromisto’s role in preparing General Schemes for 27 territories in Ukraine was adopted into law on February 7, 2002. Ordinance: No.
3059-III.
CHAPTER 3 Urban Planning and Spatial Development
118
Ukraine_2015_nov26.indd 118 2015-11-26 5:14 PM
17
Ukrainian planning legislation requires that all cities of over 50,000 inhabitants produce Local General Plans also known as
Master Plans.117
Master Plans are produced by government-run Planning Institutes, the principal one being ‘Dipromisto.’118
Dipromisto generates Master Plans for most oblast capitals, except for select cities, like Kyiv, that develop their own.
Kyiv has its own planning institute, the “Institute of General Plan of Kyiv.” Master Plans developed in Ukraine for cities,
towns, and villages require detailed zoning plans for housing, schools, green space, and other civic infrastructure. They
are produced on an ongoing basis at the request of cities and are theoretically formulated according to a city’s future
development trends.
117 Law on Regulation of City Construction Activity #3038-17, 17.02.2011
118 The other two planning institutes are the Scientific Research Institute of City Construction and the Ukrainian State Scientific Research
and Planning Institute of Civil Construction.
General Scheme of Territorial Development of Ukraine or General Plan of Ukraine: The purpose of the General Plan of
Ukraine is to establish a spatial land use plan for the territory of Ukraine; create and maintain elements of the
plan that ensure Ukrainian citizens have access to adequate housing, environmental protection, healthcare, and
protected historical and cultural monuments; and determine national priorities for housing, industry, engineering,
transportation, and social infrastructure. The General Plan includes data about the following national elements:
Geo-strategic and geo-economic data; land, water, forest, recreational, and medicinal natural resources; the
demographic, scientific, manufacturing, historical, cultural, and tourist potential of international and state
significance; networks of settlements; social, engineering, and transport infrastructure; investment policy; and
the environmental situation.
General Plans at the regional level (aka Regional Plans): General Plans are created at the regional level for cross-
border zones and oblasts. These regional plans guide land and industrial uses, conservation areas, and regional
infrastructure relative to the resources and needs of each district/oblast. Plans for oblasts focus on land-use
proposals, housing settlements, and evaluations of the area’s urban development potential.
Local General Plan (aka Master Plan): Local General Plans are city-level plans commonly known as Master Plans
in many countries. The Local General Plan represents the overall development vision and spatial growth of
a city, providing an essential legal basis for land-use regulation such as zoning and sub-division control, and
including plans for schools, housing, green spaces and other civic infrastructure based on population forecasts.
Per international norms, a modern master plan should present a unified and compelling vision for a community,
derived from the aspirations of its citizens, and establish the specific actions necessary to fulfill that vision.
Zoning Plans: Areas of land within a city or municipal limit are divided by appropriate authorities into zones within
which various uses are permitted. Thus, zoning is a technique of land-use planning used by local government urban
planners in most developed countries. Zoning ordinances define land uses in a community, whether commercial,
residential, industrial, or recreational, and they benefit the community by establishing design standards for that
land use.
Detailed Plan ofTerritory: According to Reform Law of Urban Planning (2011), there is a 5th
tier of spatial planning.
Cities with populations exceeding 50,000 should also develop a “Detailed Plan of Territory” for individual micro-
districts and estates of the city where new construction activities are planned. These plans should be discussed
with the local community, approved by the local council, and made accessible to the public.
CHAPTER 3 Urban Planning and Spatial Development
BOX 9: TYPES OF URBAN/SPATIAL PLANS IN UKRAINE
119
Ukraine_2015_nov26.indd 119 2015-11-26 5:14 PM
Resource constraints and the monopoly of Master Plan preparation at the central level has resulted in many cities not having
completed or updated their Master Plans, limiting local governments’ ability to manage their land and property resources
efficiently. A review by MinRegion in May 2013 showed that only 62% of all oblast capital cities, 42% of cities of raion
significance (or provincial centers), 21% of urban settlements, and 14% of villages had Master Plans119
. In addition, only
33 zoning plans were developed across all of Ukraine and 624 detailed plans of territories. Dipromisto and two other
planning institutes which are developing spatial plans for cities and territories are understaffed, overworked, and often
find difficulty keeping up with demand to complete local plans by the stated deadlines. Also, Dipromisto’s charges tend
to be cost-prohibitive for smaller cities with limited budgets. Further, since in practice, plans produced by Dipromisto
are typically the ones recognized as official, Dipromisto is the preferred agency for cities (See Figure 88); consequently,
it has a backlog of Master Plan development, leaving cities with outdated local plans. International practice holds that
while there may be one regulatory agency at the national, regional, or local level to approve urban plans, the production
of plans itself is open for outsourcing.
However, legislation that requires plan production through state planning institutes has been recently revised to permit
plan production by private enterprises licensed by the state; however, this legislation has yet to come into effect.120
These recent changes effectively eliminate the monopoly of state research institutes in architecture and planning control
and open the possibility for inclusion of the private sector. When implemented, these changes should bring much more
flexibility and local control to urban planning, which could then be used more effectively as a development tool by local
governments. Competition from the private sector should also ‘incentivize’ all plan makers, including planning institutes,
to update their planning procedures.
The great discrepancy between planning laws and actual planning practice in Ukraine reduces public trust in the
planning system. The planning laws in Ukraine dictate the development and publication of planning, zoning, and building
documents; require public participation in development procedures; and outline clearly understandable steps for obtaining
building permissions. In practice, these policies are not always followed. Master Plans are often non-public documents and
often not implemented. Zoning ordinances are irregular and do not conform to Master Plans. Procedures for obtaining
development and building permissions remain overly complicated; this allows for an increased role for intermediaries that
are hired by private developers to facilitate the process, increasing the probability of corruption.
Master Plans are made public only partially, encouraging land development speculation rather than guided private sector
investments, contrary to the objectives of the Master Plans themselves. While Ukrainian cities are required by law to have
Master Plans, and public input and hearings on planning decisions, including the production of drafts, is also required
in practice, the Master Plans themselves are not always public documents in practice. In Kyiv, for example, the official
Master Plan “GenPlan 2020,” is not fully available online. However, Kyiv’s Genplan 2025, which is still under preparation,
is available online in accordance with recent government efforts to increase public access to information. Although
explicitly required to be public by a 2011 law121
, Master Plans are yet to be fully public documents in some cities. This
partial secrecy at the local level stands in strict contrast to strategic plans, discussed later, which, by their very nature
are stakeholder-driven and fully public documents that are also generally available online. However, this local-level secrecy
may be changing; in response to laws passed in 2011 with regard to improving public information, MinRegion – as the
responsible agency for planning – is gradually introducing e-governance to improve transparency and public access to
information. A review carried out by MinRegion found that cities are slowly starting to publish their plans online; in
2013, 73 cities published their master plans online, while in 2014 this number grew to 169 (representing 40% of the total
number of Master Plans developed). MinRegion’s aim is to have all updated Master Plans for all types of settlements
online by the end of 2015.
119 http://www.minregion.gov.ua/attachments/content-attachments/1067/2330.05.13.pdf
120 Law No. 1546 was approved on 9 April 2015 and signed by the President in June 2015.
121 Article 14 of 2011 Law No. 3038-17
CHAPTER 3 Urban Planning and Spatial Development
120
Ukraine_2015_nov26.indd 120 2015-11-26 5:14 PM
State level
The General Scheme of planning for the territory of Ukraine
Schemes of planning of separate parts of the territory of Ukraine
Regional level
Schemes of planning of the territories of Autonomous Republic of Crimea
and oblasts
Schemes of planning of the territories of rayons
Local level
General plans of settlements
Territorial zoning plans
Detailed plans of the territory (site/building plans)
Further decentralization of the planning system would give planners additional powers to formulate Master Plans and
zoning plan recommendations responsive to city and stakeholder views at the local level. Decentralization of planning
powers that allowed city-level planners to amend local Master Plans would enable city planners to add zoning incentives
consistent with the public interest to make a property more attractive for a developer. This would promote a well-
functioning and transparent urban planning system as a strong tool used by local governments to take stock of a city’s
growth patterns and economic needs and plan towards a shared economic and spatial development vision. This could
result in plans more closely attuned to the actual conditions of shrinking cities and that more closely reflected the desires
of city-level stakeholders.
CHAPTER 3 Urban Planning and Spatial Development
Figure 87– Hierarchy of spatial plans produced by Dipromisto (2013)
121
Ukraine_2015_nov26.indd 121 2015-11-26 5:14 PM
Strategic Plans
Strategic Plans emerged in Ukraine as an independent process in line with international standards, and, although not replacing
Master Plans, they have filled a gap in cities lacking updated Master Plans. Strategic Plans focus mainly on socio-economic
development, seeking to enhance city competitiveness and seeking to improve access to and quality of local infrastructure
and services. These plans essentially help guide city leadership in implementing socio-economic policies. The Strategic
Plans are locally-produced documents, existing in parallel to Master Plans that focus on social and economic strategies to
connect physical and spatial planning. They are often funded by and produced with assistance of external donors. Many
cities in the world produce Strategic Plans in addition to Master Plans. Kyiv, for example, developed its City Development
Strategy (CDS) for 2025 with the support of Cities Alliance and other partners such as the Fund of Effective Governance
(see Box 10). The development of Strategic Plans such as CDSs permits municipalities to agree on a vision for future
development in a consultative manner with key stakeholders and the general population. The development vision is
derived by analyzing a city’s economic strengths, weaknesses, opportunities, and threats based on a detailed diagnostic
of its local economic potential, existing infrastructure, and other local and regional advantages compared to neighboring
cities and states. To achieve the development vision, cities agree on strategic action plans and investments that can
guide capital investment plans of the local government or attract donor and private investment in the future.
Strategic Plans are viewed as useful exercises for strategizing on socio-economic issues; however, they are not effective tools
to ensure implementation unless accompanied by funding. It should be noted that these plans should not be used as a
replacement for land use and zoning plans and cannot be used, for example, to determine changes in land use for individual
buildings or plots in ‘brownfield’ areas that may be suitable for redevelopment. Strategic Plans are often perceived by city
stakeholders as having more relevance for the city than formally produced and approved Master Plans simply by the fact
of the Strategic Plan being locally prepared by relevant stakeholders. The introduction of Strategic Plans into the urban
planning process of Ukrainian cities is a welcome development; the Strategic Plans could inform updates to Master Plans
by helping incorporate the latest economic and social projections for a particular city and ensuring that public interests
are at the forefront of the planning process. In contrast, Master Plans are periodically-produced documents with a long-
term horizon of 15-30 years. The shorter planning time horizon of 5-10 years in Strategic Plans make these plans easier
and possibly cheaper to produce. They can, among other benefits, inform regular updates and amendments to the Master
Plans and other spatial planning documents.
Zoning Plans
The 2012 centralization laws mandated centralized development of local zoning plans; this is likely to prove inefficient and
costly since it is distant from realities on the ground and it is also contrary to best practice. Local planners know their city’s
needs better and are in a better position to determine the spatial growth pattern and constraints. It is for this reason
that zoning plans globally are generally prepared by city-level planning organizations. Central government-generated
zoning plans encourage building developments that do not conform to existing and/or projected development scenarios.
Developers are technically required to consult with the city authorities, incorporate the Master Plan, and to hold a public
hearing before moving forward. In fact, approvals are provided based on by the zoning plans produced at the central
level, which may not reflect the views of city officials and residents. The issue is further complicated by weak oversight
and enforcement in investigating unauthorized building construction across the country. The planning laws should place
the development of zoning plans, zoning ordinances, and building permitting functions at the city level as per global
best practice. Such reforms should be accompanied by appropriate capacity-building and training at the city level; local
governments currently lack expertise in zoning issues and this perpetuates dependence on central agencies located in
Kyiv. In addition, zoning plans should be regularly updated, legally enforced, and publicly available online. The current
CHAPTER 3 Urban Planning and Spatial Development
122
Ukraine_2015_nov26.indd 122 2015-11-26 5:14 PM
122 Author’s observations based on a team field research visit to Kyiv in 2014.
There is a lack of agreement between actual spatial trends and spatial trends projected in planning documents. A closer
review of planned projects and actual land use changes for two cities made by the authors of this Chapter – Kyiv, a city
that is growing, and Kherson, a city in decline – found irregularities in zoning and building planning procedures resulting
in developments that contravene zoning laws. Development that was not projected in the planning documents was
built and development that had been projected was not. Despite a detailed legal framework for applying for building
permissions, violations of spatial guidelines were noted, particularly in Kyiv122
. Permissions that had been granted for
buildings surpassed zoning limitations sometimes to the detriment of adjacent historic buildings.
Zoning standards to accommodate shrinking cities have not been developed for Ukrainian cities although they are available
and in use internationally. In the United States, for example, declining cities such as Youngstown, Ohio have revised their
zoning ordinances in order to convert industrial and commercial districts to park land, recreational, and natural green
areas. The re-zoning was first proposed in the Youngstown 2010 Plan.
Development Vision:
By 2025, Kyiv will become an innovation center for the Eastern European region with a strong competitive
position and clear development priorities. This city has maintained and is developing its unique identity and
its historical legacy. It constantly improves the standards of living for its residents and its own attractiveness
for business. Its development will be implemented in close cooperation with businessmen and investors amid
constant improvement of the system of governance and preservation of the city’s greenery. On an international
scale, Kyiv will be described as (1) Europe’s greenest capital city; (2) the recognized meeting site of the West and
the East; and (3) an environmentally-friendly city about which its residents pride themselves.
Strategic Development Objectives:
• A two-fold increase in Kyiv’s economic welfare indicators (gross regional product per capita) by 2025
• A considerable improvement in the major comfort-of-living indicators (a 1.8 percent increase in the comfort-of-
living index).
What will the city of the future look like?
Dynamic. encouraging innovations
Unique, preserving and developing
its identity
Livable, improving its standards
of living
Open for business
Clear, having a transparent system
of governance
Green and well-balanced
Kyiv on an international scale
Europe’s greenest capital city
The recognized meeting site of the
West and the East
The city which its residents pride
themselves on
CHAPTER 3 Urban Planning and Spatial Development
status of zoning plans as de facto non-public documents is a holdover from the state-driven economy and hampers the
normal functioning of land development based on market demands.
BOX 10: KYIV 2025 CITY DEVELOPMENT STRATEGY (SUPPORTED BY A CITIES ALLIANCE
GRANT AND OTHER PARTNERS)
123
Ukraine_2015_nov26.indd 123 2015-11-26 5:14 PM
Engaging Citizen Participation
Although citizen participation is a required element in Ukraine’s development permitting, such participation is often
limited. In practice, however, the process of involving citizen participation and consultations in planning is often not
followed. Public hearings are required according to Article 13 of Ukraine’s Self-governance Law, but the procedure for
conducting public hearings123
has yet to be fully implemented and local government agencies need to amend their city
charters accordingly. As a result, the process is haphazard and subject to the will of political officials; consequently,
proper public outreach is not ensured, a consistent schedule of public hearings is often not met (they are held as seldom
as once a year), and citizens’ suggestions during public meetings are sometimes subject to approval by national or local
authorities.
An increasing number of cities have started to publicize their city plans, but the public availability of detailed zoning
and building plans remains limited. This makes irregularities in the planning process more likely, since there is no way
to confirm what officials have determined regarding land use or building status for a specific parcel of land. As the vast
majority of cities do not possess GIS-based electronic systems, the lack of digital land and building information also
inhibits an effective planning process.
Violations of planning regulations in Ukrainian cities reflect the lack of knowledge and enforcement of public participation
rights. The government established “State Councils for the Development of Civil Society,” but social accountability remains
weak. There is no formal channel of communication or consultation with national government agencies on urban planning.
Ukrainian residents are largely unaware of their public participation rights or are passive about attending public hearings.
This is slowly starting to change, especially in Kyiv, which has had nearly 20 “bottom up” initiatives related to urban
development policies. One of these initiatives includes opening the Kyiv General Plan, currently unavailable to the public,
to input by the public. Civil society organizations are critical participants in nurturing, advocating, and facilitating public
participation as provided for in the planning regulations. Further investment in information and advocacy campaigns is
required in order to enhance the “demand” side of public participation and to achieve transparency of the information
produced by government agencies. See Box 11 about the case of Detroit’s master plan.
123 Decree of the Cabinet of Ministers on Ensuring Public Participation in Formulation and Implementation of State Policy #996, 3 November
2010.
124 See Detroit Future City website at www.detroitfuturecity.com.
125 “Detroit Future City” 2012 Detroit City Strategic Framework Plan.
CHAPTER 3 Urban Planning and Spatial Development
Detroit was once the fourth-largest city in the United States, but by the 1990s, it had lost over 800,000 people
from its 1960 peak. The city had hollowed-out industries, diminishing population, significant poverty, and high
levels of abandoned housing. Detroit began only around 2008 to attempt to confront most of these challenges
on a city-wide scale.
Between 2010 and 2012, a new master plan, known as Detroit Future City, was prepared for Detroit. This was
the city’s first master plan since the 1960s and one of the first master plans in the United States that openly
acknowledged shrinkage as a central element of future city planning and policy. The plan’s development was
funded by the Kresge Foundation, a Michigan philanthropy, and it was authored by a variety of national planning,
engineering, and urban design consultants. The plan was issued in 2012 following a long public outreach and
consultation process involving more than 3000 public meetings to gather feedback and ideas for the future of
the city124
. Detroit Future City’s overall vision accepted Detroit’s loss of population, abandonment of housing and
departure of industry, and the city’s smaller and different future economic structure. Upon its launch, Detroit’s
plan was widely publicized and acclaimed throughout the United States125
.
BOX 11: DETROIT (USA) MASTER PLAN
124
Ukraine_2015_nov26.indd 124 2015-11-26 5:14 PM
17
126 House price to income ratio is the ratio of median house prices to median annual disposable salary (after tax), expressed as years of income.
Median house price and median salary are taken as average for the set of cities inside the country. For example, Ukraine is assessed on the
basis of 16 cities, including all major oblast centers. Observations for Russia include 24 cities across the country, Poland 22 cities, and the USA
around 240. In the case of Ukraine, a person with average income would have to save for 17 years in order to buy a house.
CHAPTER 3 Urban Planning and Spatial Development
III. Housing Market
Consequences of Demographic Changes On Housing
Ukraine’s housing market is characterized by very high homeownership rates, few rental options, and very minimal
mortgage holding. Privatization following independence from the Soviet Union in 1991 generated a homeownership rate
of over 94 percent by 2010 (See Figure 88 and Figure 89). At the same time, the supply of new rental properties – a valid
affordable housing option for the young and for urban migrants – has been very limited. In addition, very few households
are able to obtain mortgages, so must finance a housing acquisition through other means (i.e., savings, family loans –
see Figure 90). In fact, most households with average income in Ukraine cannot afford to buy a dwelling. The price to
income ratio126
stands at 16.8 in Ukraine, which is more than three times higher than Germany (See Figure 91). As a
consequence of these conditions there is a substantial ‘grey market’ of undocumented rental arrangements featuring
insecure landlord/tenancy rights as well as tax evasion.
Figure 88– Dwelling stock by tenure status 2000-2009
Source: State Statistics Service of Ukraine
100
95
90
85
80
75
2000 2001 2002 2003 2004 2005 2006 2007 2008 2009
Private property State housing Employee housing Market rent
125
Ukraine_2015_nov26.indd 125 2015-11-26 5:14 PM
CHAPTER 3 Urban Planning and Spatial Development
Figure 89 – Dwelling stock by country
Figure 90 – Level of mortgage penetration
Source: Estimates from Living in Transition survey, European Bank for Reconstruction and Development and World Bank, 2010
Source: Estimations From Living in Transition Survey, 2010
126
Rented Owned Other
Uzbekistan
MacedoniaTajikistanKosovoUkraineMoldovaLithuania
Azerbaijan
KyrgyzstanRom
aniaGeorgia
SerbiaBulgaria
KazakhstanCroatiaHungaryPolandSloveniaMongolia
Montenegro
LatviaFranceSweden
GreatBritainTurkeyTurkeyGerm
any
RussiaSlovakiaBelarusEstonia
Italy
CzechRepublic
Arm
enia
BosniaandHerzegovina
100%
90%
80%
70%
60%
50%
40%
30%
20%
10%
0%
Purchased built with mortgage
Privatized
Cooperative
Purchased built without mortgage
Inherited
Not stated
100%
90%
80%
70%
60%
50%
40%
30%
20%
10%
0%
Uzbekistan
Macedonia
Tajikistan
Kosovo
Ukraine
Moldova
Lithuania
Azerbaijan
Kyrgyzstan
Rom
ania
Georgia
Serbia
Bulgaria
Kazakhstan
Croatia
Hungary
Poland
Slovenia
Mongolia
Montenegro
Latvia
France
Sweden
GreatBritain
Turkey
Albania
Germ
any
Russia
Slovakia
Belarus
Estonia
Italy
CzechRepublic
Arm
enia
BosniaandHerzegovina
Ukraine_2015_nov26.indd 126 2015-11-26 5:14 PM
CHAPTER 3 Urban Planning and Spatial Development
Figure 91 – House price to income ratio
Source: Numbeo, 2011
Housing construction in Ukraine reflects the country’s demographic transition and regional urbanization trends –
discussed in Chapter 1 of this report. There are relatively high levels of new housing construction in Western Ukraine,
which had Ukraine’s lowest urbanization levels at independence in 1991. In 2010, the Western region’s leader by numbers
of commissioned apartments was Ivano-Frankivsk Oblast, with 5,540 apartments, which could be a reflection of the very
high Night Lights growth observed in this oblast. According to a recent housing market and mobility study carried out by
the World Bank, in the last five years this Oblast was one of the top-5 oblasts in terms of the number of apartments put
into operation per 1000 residents. Other oblasts of Western Ukraine also showed higher than average levels of housing
construction per 1000 residents127
. Growth in the tourism sector and investments in recent years by Ukrainians working
abroad spurred the housing construction activity. On the contrary, very low levels of housing construction were observed
in the oblasts of Eastern Ukraine. In 2010 the number of new apartments built and occupied per 1000 residents was
less than 0.63 (in Dnipropetrovsk Oblast. Although construction rates in bigger cities such as Donetsk, Kharkiv, and
Dnipropetrovsk exceeded this average in 2010, they were lower than average in the West and, with the recent conflict are
expected to drop drastically. Even during the construction boom of 2006-2008, the number of newly built apartments
in these oblasts rarely was higher than 1 apartment per 1000 residents128
. The region’s sharp population decline and its
existing high urbanization rates are likely the main causes of the low construction levels observed. As discussed in detail
in Section 2 of Chapter 1, most cities and towns in the Eastern Region have been declining in population over the past
two decades – a key factor for the substantial drop in housing demand.
127 Lviv – 1.77; Chernivtsi – 2.27; Ternopil – 2.23. The same goes for neighboring Khmelnitsky Oblast – 2.47. Bureau of Economic and Social
Technologies, Housing Market and Labor Mobility, September 2011 (Research Report Prepared Under Contract for the World Bank).
128 Bureau of Economic and Social Technologies, Housing Market and Labor Mobility, September 2011 (Research Report Prepared Under
Contract for the World Bank).
127
Housingpricetoincomeratio
25
20
15
10
5
0
UnitedStatesCanadaGerm
anyBelgium
UnitedKingdom
AustriaIreland
NetherlandsDenm
arkPortugalFinlandSweden
SpainSlovakia
CzechRepublicFranceBulgaria
Latvia
GreeceEstoniaHungary
ItalyPolandSloveniaArm
enia
RussiaMoldovaRom
ania
KazakhstanUkraineLithuaniaBelarus
Ukraine_2015_nov26.indd 127 2015-11-26 5:14 PM
CHAPTER 3 Urban Planning and Spatial Development
The very high homeownership rate in Ukraine, among other factors, has prevented the widespread housing abandonment
that characterizes typical shrinking cities in Europe and United States. As discussed in Chapter 1, people in Ukraine are
not migrating internally at expected rates; this is due to a combination of factors: very high ownership rates; limited
access to finance, which makes it difficult to finance moving costs; and an underdeveloped housing market. In addition,
in places where economic opportunities have declined, households find it difficult to find suitors to buy their dwellings and
are hesitant to leave; this is particularly true for older residents who are generally less eager to move and more dependent
on pensions. As a result, people in Ukraine have a high tendency to stay behind in shrinking cities, despite declining
economic opportunities. Under improved housing market conditions, households (labor) mobility would be expected to
increase, leading to higher housing abandonment in economically declining cities. This dynamic has been observed in
shrinking cities in other countries (e.g., Cleveland, Detroit, Leipzig).
The quality and quantity of the multi-family housing stock is declining due to deferred maintenance and the cost of
service provision.129
City housing agencies provide collective services (water, heat, and electricity) to the substantial stock
of existing housing constructed prior to 1991130
. This housing stock consists of 19.3 million apartments, equivalent to 422
apartments per 1,000 residents. Here Ukraine lags just behind the EU-27 average (446 apartments) and is ahead of such
countries as Poland (349), Slovakia (370), Romania (391), and Slovenia (410). As a result of de-population, the housing
stock per 1,000 residents is likely to rise above the EU average (as discussed in the ‘built-up area’ analysis presented in
Section 4 of Chapter 1). However, the quality of housing stock is much lower than the European norm. Three-quarters of
all homes were built between 1945 and 1990 (See Table 15), and many of these have been poorly maintained. Necessary
repairs on facilities such as roofs and elevators are often delayed or not undertaken; as a result most homeowners
possess low-value properties in poor condition. Upkeep that will improve housing values and quality is often difficult due
to the weak regulatory and enforcement environment relative to that ensured by the home-owners associations that are
typical for multi-family residential buildings in Europe or the US.
129 Ibid.
130 Ibid, p. 12
131 Ibid.
Table 15 – Age distribution of housing stock
Year 1919 1919-1945 1946-1970 1971-1980 1981-1990 1991-2000 2000
Ukraine 2010 4.7 11.8 49.2 16.2 10.7 4.4 3
Estonia 2009 9.4 14.2 30 21.5 19.6 2 3.3
Latvia 2008 13.8 13.1 22.1 19.4 20.2 7 4.4
Austria 2009 15.2 8.2 28 15.2 11.5 13.6 8.3
Netherlands 2009 6.9 13.9 27 17 15.4 12 7.9
Sweden 2008 12.1 14.7 37 16.8 9.4 5.5 4.6
Portugal 2008 7.4 10 21.9 16.1 18.8 17.7 8.1
Source: Housing statistics in the EU (2010); state statistics service of Ukraine; calculations131
128
Ukraine_2015_nov26.indd 128 2015-11-26 5:14 PM
CHAPTER 3 Urban Planning and Spatial Development
Inefficient or non-functioning land registration and title systems in Ukraine hamper development of affordable housing. Land
costs represent a substantial part of overall construction costs and thus affect the availability of affordable housing.
The transaction cost to acquire land through purchase or by having land allocated for housing by local government is
non-transparent and costly. According to the World Bank’s latest Doing Business report (2015), obtaining construction
permits requires eight separate procedures, takes 64 days, and costs 10.2 percent of the warehouse value (one of the
highest values in the region). Completing a property transfer requires seven separate procedures, takes 27 days, and
costs 2 percent of the property value (one of the highest values in the region). Globally, Ukraine ranks 70th
of the 189
economies assessed on the ease of dealing with construction permits and 59th
on the ease of registering property132
.
Out of all 25 million plots of land in the country, only about 12 million plots are in the cadaster. However, the cadaster
does not contain information about plots that were registered before the Land Code came into effect in January 2002.
Registration of titles for land parcels and buildings is done by two separate agencies. Registration of property rights for
apartments, houses and other buildings is done by offices of the Bureau of Technical Inventory that are attached to local
administrations. The register is kept by the Ministry of Justice. Registration of land parcel titles is done by local offices
of the State Service of Geodesy, Cartography, and Cadastre (in 2015, this was merged into the State Agency of Land
Resources and Cartography Agency). As a result, it may happen that a land plot is registered to more than one person,
increasing the risk of legal disputes. Access to municipal land for construction purposes is possible in two ways – land
auctions and non-competitively. Both come with their own specific challenges and costs, and an assessment of risks and
profitability of investment is complicated. Consequently, investors are left uncertain about various characteristics of a
land parcel such as transport access, engineering services and infrastructure, environmental conditions, and restrictions
on land use.
Incomplete urban planning documentation for most Ukrainian cities results in local government being unclear about the
direction of development and the activities allowed on each land parcel.133
The absence of Master Plans and detailed
zoning plans in some cities tends to make urban development more chaotic, increasing the risk of congestion in growing
cities and the risk of vacancy and unsold housing stock in shrinking cities. New construction often takes place at the
expense of preservation of open spaces and parks within cities since the extension of boundaries for growing cities
involves a complicated planning process leading to disputes with cities and the raions. Brownfields re-development
is also problematic as it involves a lengthy and costly process of change in the type of land-use as well as necessary
decontamination measures.
132 World Bank, Doing Business 2015: Going Beyond Efficiency; Economy Profile 2015: Ukraine (Washington, DC: World Bank, 2014), available at
http://www.doingbusiness.org/data/exploreeconomies/~/media/giawb/doing%20business/documents/profiles/country/UKR.pdf?ver=2
133 Housing Market and Labor Mobility
129
Ukraine_2015_nov26.indd 129 2015-11-26 5:14 PM
CHAPTER 3 Urban Planning and Spatial Development
IV. Planning as an Instrument for Managing City
Growth And City Decline
Planning for Dynamic Growth
Cities that are experiencing growth in Ukraine are in theory allowed to extend their boundaries according to the mandate of
a Master Plan rather than based on market demands; however, in practice the process is complicated and local authorities
avoid shifting city boundaries, which has the stimulates uncontrolled urban sprawl. In theory, expanding city boundaries
provides access to greenfield land that can be converted into high-density sub-markets under a state-driven planning
structure that guides the type, location, and size of development. In reality, city municipal boundaries are fixed, but urban
sprawl occurs nonetheless, extending development beyond the border of the city and making centralized planning efforts
difficult. For instance, Kyiv’s boundaries were expanded in 1961 and again in 2001, yet they do not reflect the full extent
of the city. City boundaries are a political designation, but growth is more efficiently accommodated when boundaries
are based on transportation, employment, and housing needs. These challenges are present in many countries, especially
former Soviet bloc countries. Some countries address the issue by creating functional or administrative agglomerations
comprised of a city and its surrounding areas where urban sprawl is the densest. This notion of city-regions is growing
in popularity among planners in Europe, but the approach has not reached Ukraine yet.
Zoning is also not flexible or transparent so it is difficult to plan for growth beyond the boundaries of the Master Plan area,
particularly in expanding sub-markets. Planning for growing sub-markets requires zoning that permits construction based
on both current and future projections of demand. In practice, this “upper limit” of construction is often left flexible in
zoning, so that cities can amend or permit variances to zoning that allow additional construction. In New York City, for
instance, a shortage of land for additional construction of office space in mid-town Manhattan led the city to propose
development and additional density there called the “Vanderbilt Corridor.” In the Ukrainian context, there are several
growth corridors, but zoning is inflexible without clear reference to demand.
Without strategic investment in infrastructure or services, growing cities accommodate new development in either existing
areas or expand to the urban fringe. High land values in desirable areas of the existing city footprint drive up costs and
often encourage over-development to recoup costs. On the other hand, lower land values on the periphery are driven up
by the cost of extending services and infrastructure, resulting in sprawl. Further complicating development in Ukraine,
many of the desirable sub-markets are historic areas with tight development controls including height restrictions.
Growing cities, particularly Kyiv, should establish Master Plans that project a growing future city, but that also protects
valued cultural and historic resources such as parkland, green-belts, and historic areas. The land-use pattern of these cities,
particularly in their 20th century housing and commercial districts, is characterized by low density and can easily
accommodate new development without the need to re-develop parkland or historic areas. The recent development
pattern of Kyiv, for example, to favor skyscrapers, ignores the central city’s historic importance. An expanding economy
also places pressure on existing housing by driving prices up, thus increasing the risk of displacement for low-income
homeowners or renters, particularly in high-value, center-city areas. Local governments need to ensure housing strategies
are in place at the local level to encourage private sector involvement in providing affordable housing. At the national level,
planning reforms need to be put in place to promote the supply of affordable rental housing in the market. An expanding
economy also places pressure on the transport system due to increases in jobs and in new commuters. The planning
system must accommodate this increased pressure by constructing new transit lines and roadways.
130
Ukraine_2015_nov26.indd 130 2015-11-26 5:14 PM
CHAPTER 3 Urban Planning and Spatial Development
Planning for Shrinking Cities
Many cities in Ukraine have demonstrated declines in many demographic areas yet are operating with Master Plans
based on growth trends (See Box 12 for an example). Declining local economies have led to reduced demand for space
and the abandonment of industrial, retail, and office parcels. Often, these abandoned parcels are extremely large, causing
a large decline in the intensity of economic activity in the city. Gradually, over time, the footprint of the city begins to
shrink or remains stable, creating a vicious cycle of population loss and declines in the quality of life. Unfortunately, a
declining economy does not reduce the amount of infrastructure required for servicing remaining housing, manufacturing,
office, and retail activities in the city.
Ukraine’s planning legislation and strategic framework are based on expectations of growth rather than shrinking and
redistribution. In a handful of growing cities, the processes of sub-division, zoning variances, and development permissions
will continue to be needed. However, in most Ukrainian cities there are very few new residential structures and there
is little demand for new industrial or commercial space. Indeed, in many cases, much of the existing commercial and
residential space in the city lies vacant134
. Ukraine’s planning laws mandate a system that is fundamentally miss-aligned
with the actual needs of the nation’s cities, which remain unable to shape their own planning priorities as well as those
of private development actors. Citizens are inhibited from accessing or understanding important planning, zoning, and
building information. Meanwhile, further reforms of the 2011 legislation have been slow to be implemented.
Given these challenges, General Plans and Master Plans could incorporate new tools for managing decline and redistribution
at both the national and city levels. These might include demolition of surplus industrial and dilapidated residential
buildings, brownfield redevelopment, allotment of unused or unneeded land to stakeholders, zoning changes to enhance
economic development of underused properties, and new spatial strategies that reflect the reduced need for housing and
commerce in shrinking cities. Planning legislation should allow for differentiations in planning methodology to account
for the mix of local growth and decline. For instance, in the United States, declining cities such as Youngstown, Ohio
have revised zoning ordinances in order to convert underused industrial and commercial districts to park land, recreation
areas, and natural spaces. This re-zoning was first proposed in the Youngstown 2010 Plan published in 2004135
. Such
zoning changes, if they were implemented, would most likely concern the reuse of abandoned industrial areas, rather than
housing due to the relative stability of Ukraine’s housing market.
134 Author’s interview of officials of the City Administration of Kherson, 17 December 2014.
135 See http://www.cityofyoungstownoh.com/about_youngstown/youngstown_2010/plan/plan.aspx
The Master Plan for Kherson projects recreational areas along the Dnipro waterfront. According to some Kherson
planners interviewed for this study, the plan is “not realistic; it does not depict the city’s actual condition.”
Overall, Kherson planners regarded both the city’s development condition, and the city’s planning condition,
as “frozen”. Development was very limited due to the city’s economic decline and Ukraine’s overall political
problems. At the same time, it was difficult to adjust planning norms such as the General Plan or zoning plans
to reflect these conditions because of the centralized nature of Ukraine planning.
BOX 12: DISCONNECT BETWEEN REALITY AND PLAN
131
Ukraine_2015_nov26.indd 131 2015-11-26 5:14 PM
CHAPTER 3 Urban Planning and Spatial Development
Shrinking cities in Ukraine face numerous spatial planning challenges, such as:
• Urban decline places pressure on the planning system to project new activities for abandoned or underused areas. This
requires entrepreneurial action on the part of planning departments to project and attract new economic activities.
• Abandonment requires the re-tooling of Master Plans to accommodate changed or declining activities.
• Urban decline may also require projecting a shrunken or changed urban footprint. This is an activity that is unfamiliar
to most urban planners and is not part of conventional urban planning practice.
• Maintenance of existing infrastructure is expensive and difficult. Projecting reductions of infrastructure proportionate
to the reduction of both residents and economic activities may be a necessity, placing additional demands on the urban
planning system.
Approaches to address shrinking cities differ internationally. While some cities plan to stem decline through incentives
and investments, others focus on reducing urban footprints and increasing existing efficiencies. Urban planning plays
an important and facilitative role for both approaches towards stabilization or growth. While the World Development
Report (WDR) of 2009 takes a particular development view towards cities that have no hope for resurrecting economic
activity, there is evidence that Local Economic Development efforts – where a city’s economic strengths, weaknesses,
opportunities, and threats are first evaluated and then used as a basis to re-invent a city’s economic potential and
development path – have led to the successful comeback of some cities (Dresden being a good example). New master
plans geared for shrinking cities can project alternative land uses for underused industrial or commercial areas, including
recreational or natural spaces. Community participation can help identify “bottom-up” opinions or interest in uses for
underutilized spaces, and these opinions can be incorporated into General Plans. Zoning can be revised to permit a wider
range of uses or to remove restrictions on properties that prevent their being re-purposed for alternative land uses.
Ukrainian policy makers may need to look internationally to find suitable planning models to develop policies for the
country’s shrinking cities. Germany provides an interesting model for future planning in Ukraine (See Box 13). Like Ukraine,
Germany has a tradition of state involvement in urban planning, but it has a much stronger economy and a tradition of
government transparency and citizen participation in planning decisions. Ukraine lacks these three latter factors. The
USA model of urban planning, however, is not necessarily appropriate either. The US has extremely decentralized planning
and a tradition of citizen participation in governance – both of which Ukraine lacks. Ukrainian cities also have large-scale
problems like deindustrialization that are better solved by state policies at the national and regional level than they are
by policies at the local level as in the United States. Ultimately, Ukraine will not be able to “copy” any country’s planning
system wholesale; reform of planning will have to accommodate those qualities of Ukrainian governance that stem from
the country’s history, while also accommodating concepts of governmental transparency and citizen participation that
are less familiar to public officials and citizens of Ukraine.
132
Ukraine_2015_nov26.indd 132 2015-11-26 5:14 PM
CHAPTER 3 Urban Planning and Spatial Development
German reunification in 1990 catalyzed a substantial series of capital projects to reunify and rebuild the country.
To date, the population of the area of the former East Germany has decreased by 12 percent, with nine percent
of that decrease occurring during or after reunification in the 1990s.136
A national policy strategy came in 2001 in the form of Stadtumbau Ost (Urban Renewal/Restructuring East),
a 2.5 billion euro initiative in six former East German states. In effect from 2002 to 2009 (and subsequently
extended by the Länder for a second period to 2016), the initiative had a two-fold mission: 1) stabilizing the housing
market by tearing down abandoned or underutilized buildings, and 2) upgrading inner-city districts, modernizing
living conditions, and improving social infrastructure137
. The overall goal of Stadtumbau Ost was to remove
350,000 unoccupied houses in order to stabilize the real estate market as well as attract private investment
through redevelopment based on new housing construction (220,000 homes were demolished by 2007)138
. The
global economic crisis of 2008 caused more shrinkage, so Stadtumbau Ost proposed the demolition of nearly
350,000 more homes by 2016, the majority of which (217,000) were demolished after the formal conclusion of
the program in 2009139
. The Bund and Länder also spent 320 million euros to upgrade districts in urban centers
through the adaptation of urban infrastructure, modernization or demolition of vacant commercial buildings,
maintenance of historic buildings, and overall efforts to modernize living conditions.
In 2004 the Bund launched Stadtumbau West in areas of the former West Germany as a companion to
Stadtumbau Ost. Between 2004 and 2008, the Bund, Länder, and city/local municipalities each invested one-
third of a total of 738 million euros140
spread across 300 cities141
. For both Stadtumbau Ost and West, cities and
regions were required to generate spatial plans in order to project visions for the future of the areas benefiting
from the program. Many of these urban plans were recognized as innovative and attained worldwide visibility as
a result of the involvement of leading architects and urban planners in their formulation142
.
136 Pallagst, Karina, Thorsten Wiechmann and Cristina Martinez-Fernandez, eds., Shrinking Cities: International Perspectives and Policy
Implications (New York, NY: Routledge, 2014); Werz 2001, Abwanderung.
137 Shrinking Cities (2014); Urban Regeneration.
138 Ibid; Glock, Birgit, and Hartmut Häussermann, “New trends in urban development and public policy in eastern Germany: dealing with the
vacant housing problem at the local level,” International Journal of Urban and Regional Research, Volume 28, Issue 4, pp. 919–929, December
2004.
139 Goethe Institut 2009, Making Shrinking Cities.
140 An additional 76 million euros was allocated to the initiative in 2009.
141 Ibid.
142 International Building Exhibition Urban Redevelopment Saxony-Anhalt 2010: Less Is Future (Jovis: 2010).
BOX 13: NATIONAL LEVEL SPATIAL POLICY: STADTUMBAU OST AND WEST (GERMANY)
133
Ukraine_2015_nov26.indd 133 2015-11-26 5:14 PM
134
Ukraine_2015_nov26.indd 134 2015-11-26 5:14 PM
135
CHAPTER 4
Impact of the Current
Conflict on the
Urban System
Ukraine_2015_nov26.indd 135 2015-11-26 5:14 PM
143 This section is based on and summarizes findings of the Eastern Ukraine Recovery and Peacebuilding Assessment (RPA). See World Bank,
RPA: Analysis of Crisis Impacts and Needs in Eastern Ukraine: Synthesis Report (World Bank Group), March 2015, available at http://www-wds.
worldbank.org/external/default/WDSContentServer/WDSP/IB/2015/05/14/090224b082e84fea/1_0/Rendered/PDF/Synthesis0report.pdf
144 In March 2014, the Autonomous Republic of Crimea and the city of Sevastopol held referenda to join the Russian Federation, which were
widely criticized and declared as having no validity in the UN General Assembly resolution 63/262
The UUR was initiated prior to the ongoing conflict in Ukraine. Even though events related to the conflict are not reflected
in the analysis undertaken for the UUR – due to the limitation of data sets from 1998 to 2013, the unavailability of
recent and reliable data from the conflict areas, and the continuously evolving and changing characteristics of the crisis
– the conflict is expected to impact the urban system in the country. To that end, the following discussion, drawing on
the recent Eastern Ukraine Recovery and Peacebuilding Assessment, concerns recent events in Ukraine.
The Current Conflict
Ukraine’s ongoing conflict has had a huge impact on human welfare and social and economic conditions in the East. The
current conflict commenced with a political crisis that started in late 2013, followed by the referenda in Crimea in March
2014144
, and an intensifying conflict in Eastern Ukraine focused on the areas of Donetsk and Luhansk. In late 2014, the
European Union, the United Nations, and the World Bank, under the leadership and participation of the Government of
Ukraine, commenced the Eastern Ukraine Recovery and Peacebuilding Assessment (RPA). It was finalized in March 2015
and informs this present section.
The conflict has resulted in a significant number of displaced people. The RPA found that, as of February 2015, there
have been 7,000 deaths, some 18,000 wounded, and over 1.6 million people displaced both internally and outside of
Ukraine. Around 1 million persons are registered as internally displaced and another 640,000 have taken refuge in other
countries, many in the Russian Federation. Out of the 5.2 million people that resided in conflict-affected regions prior to
the conflict, at least 3.9 million have been directly affected by the conflict. Initially, the majority of the displaced were
women and children. As the conflict deepened, the demographic profile of internally displaced people (IDPs) broadened to
also include older and disabled residents. Figure 93 shows displacement as of February 2015.
The displacement intensified as a result of a Government of Ukraine resolution to halt services in areas not controlled
by the government. Government decree 875/2014 issued in mid-November 2014 closed all Government offices in areas
outside the Government’s control, halting funding of pensions, social benefits, and other services while also withdrawing
support to schools and hospitals. Offices of Ukraine’s Central Bank also closed, limiting access to cash and banking
services. Pension and social payments are now only available to persons with registered residences in Government-
controlled territory. This withdrawal of financial services and resources to Government-supported institutions deepened
vulnerability and prompted outflows of some of the Donbas region’s most vulnerable residents. There are indications, for
example, of extraordinary numbers of pensioners leaving areas outside of Government control in December 2014-January
2015 and registering as IDPs in Government-controlled areas.
The majority of the displaced population seems to be concentrated in the areas close to the line of conflict. Over 96% of
IDPs originated from the oblasts of Luhansk and Donetsk. Of these, 75% sought refuge in host communities within the
five eastern oblasts. 49% of IDPs stayed within Luhansk and Donetsk, swelling the population of conflict-affected host
communities nearest to the fighting. This is reported to be a typical movement pattern for IDPs, reflecting a desire to
achieve greater physical safety, while remaining within a reasonable distance of home, relatives, property, and former
livelihoods. The result is a concentration of the displaced into host areas that are poorly prepared to receive them; some
cities host IDP populations that exceed by several times their original populations (See Figure 92).
CHAPTER 4 Impact of the Current Conflict on the Urban System143
136
Ukraine_2015_nov26.indd 136 2015-11-26 5:14 PM
Figure 92 – Conflict and displacement in Eastern Ukraine (as of February 2015)
Source: Eastern Ukraine Recovery and Peacebuilding Assessment (RPA) February 2015
The displaced bear the intense human and personal cost of the conflict; however, IDPs also create a significant strain
on local communities, services, and financing. Among other effects are a downward pressure on wages, and an upward
pressure on food prices. The RPA found that health facilities and classrooms are oversubscribed in many areas and
community services such as elderly care, child care, recreation services, and sanitation services have been affected as
resource-poor authorities redirect their budgets to the immediate needs of IDPs. This fuels social fragmentation in host
areas, further complicating the effects of the conflict.
The majority of the displaced in Ukraine have moved at least twice in the course of their displacement, while one-third
of IDPs have moved three or more times. While repeat movements are typically driven by a search for secure, adequate,
and reasonably priced accommodation, they should be understood as disruptive episodes in the lives of the displaced
as they search for improved circumstances. IDP movements are driven by a variety of factors, such as the depletion of
personal capital; limited access to services and assistance in new and unfamiliar areas; disinclination of landlords to
rent to IDPs; loss of the ability of host families and family members to provide support; and the search for employment
opportunities. However, many of the displaced have worked in the industrialized Eastern regions and have labor skills that
are in less demand in the Central and Eastern regions. Repeated dislocations due to renewed physical safety concerns
are also common as many of the displaced, seeking to remain near home areas, have had to flee repeatedly due to heavy
fighting nearby.
CHAPTER 4 Impact of the Current Conflict on the Urban System
137
Ukraine_2015_nov26.indd 137 2015-11-26 5:14 PM
145 World Bank estimations
146 Recovery and peace building assessment : analysis of crisis impacts and needs in Eastern Ukraine (Vol. 2): Full component reports (World
Bank Group), March 2015, available at http://documents.worldbank.org/curated/en/2015/05/24487461/recovery-peace-buiding-assessment-
analysis-crisis-impacts-needs-eastern-ukraine-vol-2-full-component-reports
The effect of the conflict on the local regional economy and the economy of Ukraine at large is significant. As the Donbas
region historically contributed approximately 16% to the GDP and 25% to Ukrainian exports, the conflict in the East
has had significant economic implications for the whole country. Trade disputes with Russia have further damaged the
Ukrainian economy. Ukraine’s real GDP is expected to decrease by 8% in 2014 and is forecast to contract by a further
7.5% in 2015,145
while the exchange rate has heavily depreciated since early 2014. Over the same period registered
unemployment has increased from 7.7% to 9.3% while employment opportunities are estimated to have decreased by 2
million. This is due to the fact that nearly 80% of the formal economy in Donetsk and Luhansk regions is not operational,
resulting in decline of industrial production in the regions of 60% and 85%, respectively. However, the economic spillover
of the conflict extends to the entire country.
The Urban System Following the Conflict
At the time of this report, the conflict continues to evolve; its long-term impact on both population movement and the
economy at large remains to be seen. The joint assessment sees the situation in the East as likely to remain volatile and
fluid for some time. To date, the RPA146
assesses total damages to infrastructure and social services estimated at around
USD 463 million. Damages to the transport and energy sectors constitute the bulk of the impact. Further, there are
losses that have been incurred in various sub-sectors, but not fully quantified yet relating to diminished output capacity,
increased production costs, the inability to efficiently transmit and deliver services as a result of infrastructure damage,
and reduced ability of consumers to pay for services already received. Total recovery needs for infrastructure and social
services are estimated by the RPA at around USD 1.3 billion. Needs are greatest in the transport, social welfare, and
health sectors at USD 558m, USD 329m, and USD 184m, respectively. Needs estimates are built upon the damages
reported to infrastructure and the reconstruction of impacted infrastructure to improved standards; the restoration of
service delivery to individuals residing in Donetsk and Luhansk and replacement of facilities; and the provision of social
services to individuals displaced as a result of the conflict (IDPs).
To contain the developmental impacts of displacement and leverage the skills and presence of the displaced for more positive
outcomes for all, the RPA recognizes four key challenges: (i) delivery of services such as security, education, health, and
social payments along with basic infrastructure in equal measure to the displaced and host populations, (ii) the displaced
(re)gaining control of land and property, (iii) reestablishing livelihoods and social bonds that are disrupted by forced
displacement and conflict and (iv) accountable and responsive governance and rule of law at the local level.
These are the barriers to durable solutions for Ukraine’s internally displaced – and they are, at the same time, critical
development challenges for the entire population of Ukraine. This approach is premised on the continuation of the IDP
crisis for the foreseeable future and the associated strains that such population movements place on state finances,
service delivery mechanisms, governance, and social cohesion.
Once conditions allow, the restoration of infrastructure and services in conflict-affected areas should reflect the new
realities of geographic distribution of people and production. Even prior to the conflict, the area had largely obsolete and
inefficient heavy industries, many of which were in decline. The area was a recipient of targeted central fiscal transfers
(subsidies) and there was accumulation of wage arrears. Post-conflict rebuilding of assets should be guided by the
expected numbers of returnees and should focus on restoring institutions, rule of law, and social cohesion as well as basic
services for the population. This will ensure that people who choose to return and remain will have their basic needs met,
and not be pushed out by the lack of schools, health services, and public security. Connectivity to the rest of the country
CHAPTER 4 Impact of the Current Conflict on the Urban System
138
Ukraine_2015_nov26.indd 138 2015-11-26 5:14 PM
will be especially important to ensure re-integration of the conflict-affected areas.
The UUR suggests that even in areas not affected by the conflict, push factors rather than pull factors seemed to underpin
internal migration. The conflict has further reinforced the push factors. The interplay of push and pull factors in Ukraine
needs to be further analyzed. A first step in this direction would be to carry out a new census since the last census was
taken in 2001. A set of public policies aimed to ease mobility (such as further developing the housing and rental markets)
would benefit economic integration. One consequence of improved mobility could be that shrinking cities will shrink even
faster, but the desired objective would be a set of conditions where people are pulled to cities with emerging economic
opportunities. This will then permit the urban system to achieve its full potential as Ukraine’s engine of growth.
While some of the UUR’s findings related to individual cities may change as a result of population movements wrought by
the ongoing conflict, its findings on trends, challenges, and opportunities for the urban system in Ukraine remain. Most
cities, in the short- and medium-term, will probably continue to loose population. However, several cities in Ukraine – in
particular those close to the largest urban centers – are growing, albeit slowly, and will continue to attract people in
search for opportunities. This presents a dual challenge: city administrators, including planners, need to manage for urban
expansion in the country’s population growth centers while local governments of urban centers affected by population
decline need to adapt their city strategies to reflect new demographic and economic realities associated with shrinking.
Reforms should underpin a realignment of fiscal resources across cities and other local governments, and provide better
incentives to local governments for efficient fiscal management and improved urban services.
In declining cities local authorities will need to re-assess how infrastructure is planned and maintained, and the way
services are financed and delivered. Neighborhoods may need to be consolidated as cities lose density. Public service
plans, designed for a larger population, may have to be re-considered to address lower demand. Many cities around
the globe have successfully transitioned through periods of demographic decline and the main lesson is that, while
challenging, opportunities exist for declining cities. If managed well, cities can “shrink better,” i.e., consolidate their
urban footprint, emerge greener through the conversion of brownfields to green public spaces, and so on. In addition, an
aging urban population has consequences for the demand for and the type of housing (e.g., long-term care facilities), the
demand for public transportation (as elderly tend to commute less), and other basic services. Further, the combination
of an overall aging urban population and declining fertility rates will also likely shift demand from education to health
services. Urban areas will therefore need to adapt their social and physical infrastructure to better serve the changing
needs and demands of their population.
Simultaneously, growing urban centers need to be supported by a set of public policies that further foster economic growth.
The majority of population growth observed in Ukraine is concentrated on the outskirts of main urban centers, such as
Kyiv and Lviv, which are core elements of larger urban agglomerations. As discussed in Chapter 1, one of the key findings
of the UUR is that agglomerations are particularly important engines of economic growth in the country. However, growth
centers, as observed in many countries, can experience setbacks associated with congestion costs; traffic congestion, a
shortage of infrastructure, and environmental pollution can increase as cities become larger and denser if growth is not
properly managed. Making agglomeration economies work in Ukrainian growth centers will require a set of instruments
that span institutional, administrative, and sometimes geographic boundaries. Infrastructure will need to be adapted to
ensure that newcomers are well-absorbed and integrated into the city. This is particularly challenging in the case of public
transport, particularly where the functional urban footprint expands beyond administrative boundaries – as is the case
in most major urban centers in Ukraine. The introduction of metropolitan governance mechanisms might be needed to
effect coordination in urban areas that have expanded into multiple administrative units. In addition, Ukraine’s growing
cities need to better manage their peri-urban growth to avoid sprawled development and facilitate in-fill development
options (e.g., brownfield re-development), while ensuring that sufficient green and public space is available. Finally, despite
growth in their populations, Ukrainian growth centers will also experience aging of their populations, which will require
local governments to reshape their services in order to meet the changing needs of their population.
CHAPTER 4 Impact of the Current Conflict on the Urban System
139
Ukraine_2015_nov26.indd 139 2015-11-26 5:14 PM
140
Ukraine_2015_nov26.indd 140 2015-11-26 5:14 PM
141
ANNEXES
Ukraine_2015_nov26.indd 141 2015-11-26 5:14 PM
Annex I
Special Economic Zones
Special Economic Zones (SEZ) were established in Ukraine in order to overcome the crisis that the country faced during
the post-soviet era in the 1990s. The deep crisis of the coal industry, the country’s hyperinflation in the 1994 and
complications faced during the privatization of public enterprises led to a situation in which a great level of investment
was needed to re-boost economic activity. Two types of SEZ were approved in 1998: (i) Free Economic Zones (FEZ),
defined as SEZ in which companies are taxed very lightly or not at all, and (ii) Territories of priority development (TPD)
which are SEZ designated in distressed regions.
The benefits of the SEZ included the exemption from VAT taxes, subsidies and financial grants for companies installed.
A total of 12 FEZ and 9 TPD were established between 1998 and 2005, when the government eliminated them. During
their existence, SEZ attracted numerous investments, mostly from Ukrainian residents and offshore jurisdictions. Tax
incentives created opportunities for corruption and rent seeking activities, opening the way for oligarchs to establish
and own much of the economic activity in these priority regions and cities. The revenue costs and budget were seldom
transparent, and they proved not to be a good system for promoting foreign investment in new local enterprises. Moreover,
these zones often distorted local and regional competition and led to mechanical relocation of production facilities to
designated areas rather than creation of new companies. Additionally, Ukraine was in the process of entering the WTO,
and it failed at being compelling in this process in at least three aspects: first, import duties were not collected when goods
manufactured in free economic zones were sold outside of them, but inside the Ukrainian territory; second, preference to
investment projects that promised to procure Ukrainian-made goods contradicted the WTO Agreement on Trade Related
Investment Measures (TRIMS); third, direct tax incentives could be interpreted as discriminatory protection against
imports, and deterrence for foreign investment. This led to the cancellation of the SEZ in 2005. Ukraine joined the WTO
shortly after. The total investment attracted during the existence of these incentives was 1.5 billion US$ from Ukraine
residents and 600 million US$ from foreigner investors. Currently, there is debate about the negative consequences
of SEZ discontinuing, especially the impact on the investors in those zones, and their potential reopening with stricter
conditions.
ANNEX I Special Economic Zones
142
Ukraine_2015_nov26.indd 142 2015-11-26 5:14 PM
Figure 1 – Special economic zones Ukraine (1998-2005)
Sources:
Violeta Skrypnykova, Channels of Corruption in Establishment of Special Economic Zones in Ukraine
Ondrej Klipa | Ph.D. Candidate, Charles University, the Czech Republic| Issue 2, 2005, Problem Of The Special Economic Zones
Within The Ukrainian Economy And Politics
Mark Davis, The World Bank, The debate on Elimination of Free Enterprise Zones in Ukraine, December 12, 2005
ANNEX I Special Economic Zones
!
!
!
!
!
!
!
!
!
!
!!
!
!
!!
!!!
!
!
!
!
!
!
!
!
!
!
!
!
!
!
!
!!
!
!
!
!
!
!
!
!
!
!
!
!
!
!
!
!
!
!
!
!
ROMANIA
RUSSIAN FEDERATION
BELARUS
POLAND
MOLDOVA
BULGARIA
SERBIA
HUNGARY
SLOVAK
REPUBLIC
Kyiv
Lviv
Sumy
Odessa
Kharkiv
Volyn
Poltava
Rivne
Chernihiv
Zhytomyr
Luhansk
Crimea
Kherson
Vinnytsya
Cherkasy
Mykolaiv
Kirovohrad Dnipropetrovsk
Zaporizhzhia
Ternopil
Khmelnytskyi
Ivano-Frankivsk
Zakarpat Chernivtsi
Kyiv City
Sevastopol
Donetsk
Kyiv
Lviv
Sumy
Odessa
Kharkiv
Volyn
Poltava
Rivne
Chernihiv
Zhytomyr
Luhansk
Crimea
Kherson
Vinnytsya
Cherkasy
Mykolaiv
Kirovohrad Dnipropetrovsk
Zaporizhzhia
Ternopil
Khmelnytskyi
Ivano-Frankivsk
Zakarpat Chernivtsi
Kyiv City
Sevastopol
Donetsk
Novovolynsk Zhovtneve
K
olynsky
Y
K
Novovolynsk Zhovtneve
K
olynsky
Y
K
T s
Kovel
R
T s
Kovel
R
!
!
!
!
!
!
!
!
! !
!
!
!
!
!!!
!
!
!
!
!
!
!
!
!
!
!
!
P
K
Y
TK
P
K
Y
TK
DonetskDonetsk
!
!
s
s
s
!
K
143
Ukraine_2015_nov26.indd 143 2015-11-26 5:14 PM
ANNEXES
Region Sector lq2010 lq2000
Western region
Agriculture, hunting and forestry. Fishing 1.33 1.21
Industry 0.77 0.81
Construction 1.12 1.01
Trade; repair of motor vehicles, household goods and personal use. Hotels and restaurants 0.92 0.91
Transport, storage and communication 0.84 0.85
Finance 0.72 0.85
Real Estate 0.64 0.64
Public Administration 0.96 0.89
Education 1.15 1.13
Health care 1.06 1.03
Other community and personal services; activities in the field of culture and sports 1.17 1.20
Eastern region
Finance 0.79 0.81
Other community and personal services; activities in the field of culture and sports 0.90 0.95
Public Administration 0.78 0.86
Construction 1.05 1.00
Real Estate 0.97 1.02
Health care 0.91 0.90
Transport, storage and communication 1.03 1.03
Education 0.85 0.85
Agriculture, hunting and forestry. Fishing 0.65 0.60
Industry 1.43 1.40
Trade; repair of motor vehicles, household goods and personal use. Hotels and restaurants 1.08 1.15
Annex II
Location Quotient
ANNEX II Location Quotient
144
Ukraine_2015_nov26.indd 144 2015-11-26 5:14 PM
Region Sector lq2010 lq2000
Central region
Finance 1.44 1.24
Other community and personal services; activities in the field of culture and sports 0.94 0.95
Construction 0.98 1.00
Health care 1.02 1.02
Transport, storage and communication 1.02 0.98
Real Estate 1.29 1.19
Public Administration 1.24 1.14
Education 1.03 1.06
Industry 0.86 0.86
Agriculture, hunting and forestry. Fishing 0.97 1.08
Trade; repair of motor vehicles, household goods and personal use. Hotels and restaurants 0.95 0.95
Southern region
Finance 0.91 1.01
Other community and personal services; activities in the field of culture and sports 1.01 0.93
Construction 0.89 0.99
Real Estate 1.00 1.06
Public Administration 0.94 1.05
Health care 1.00 1.04
Transport, storage and communication 1.09 1.11
Education 0.96 0.96
Agriculture, hunting and forestry. Fishing 0.94 0.98
Industry 1.01 0.98
Trade; repair of motor vehicles, household goods and personal use. Hotels and restaurants 1.06 1.00
ANNEX II Location Quotient
145
Ukraine_2015_nov26.indd 145 2015-11-26 5:14 PM
Annex III
Methodological Annex Using NL Data as a Proxy for
Economic Activity
Night-time lights and economic activity. In a series of articles, Henderson, Soreygard and Weil147
have developed a
methodology based on the finding that there is a strong empirical connection between economic activity and the intensity
level of night lights observed by satellites. This can be an important complement to official GDP data particularly when
countries have poor national income accounts. In some cases it can even be used as a replacement or proxy for GDP data.
For example, data on NLs is often readily available at arbitrary granularity levels, while GDP official data is rarely collected
at a level of disaggregation finer than the first subnational division. In this case, night light information can help draw
conclusions about the behavior of economic activity at these smaller geographical levels such as metropolitan areas or
municipalities. NLs also allow for the estimation of economic activity at supranational levels. Several applications of NLs
have been produce, including those found in the World Bank 2014 SAR Urbanization Flagship report.
Having an interest in regional dynamics in this review, NLs are a particularly useful tool. As a reassurance that Ukraine
follows the same patterns shown in the literature for other countries and regions, this appendix provides regression
analyses of the statistical link between night lights and GDP for Ukraine at the Oblast level in absolute, growth, and per
capita levels. A significant positive relationship is ofund between nightlights and economic activity variables using panel
data from the 24 Oblasts in Ukraine, the Autonomous Republic of Crimea, Kiev City and Sebastopol for the years 2004-
2008 (2000-2008 when using gross value added instead of gross regional product as a robustness test). Oblast level
consumer price indices were used to express economic activity variables in real terms (in 2002 Hryvnias).
Correlation between night lights intensity and levels of real Gross Value Added (GVA). Regression Table 1 shows a positive
statistically significant relationship with (GVA), with a robust estimated elasticity of GDP with respect to lights of
around 0.8. The R-squared numbers support the validity of the relationship. The model specification in column (2)
introduces electricity production, which has a positive significant effect in economic activity. The significance of night
lights remains, but is reduced by the inclusion of electricity, which suggests that electricity production is an important
part of the transmission mechanism which links lights to economic activity, but is not the only one148
. Finally, the results
in column (3) include year dummies. The effect of night lights remains significant, supporting that our results are not
driven by time trends. As a robustness test, results calculated using Gross Value Added (GVA) are included in table 2. As
expected, results are reproduced with slight differences in magnitude. Both tables use robust standard errors to take into
account for possible correlation between observations in the same Oblast.
147 Henderson et al. (2009) develop a theoretical model that suggests an optimal way to combine night lights data and available GDP. This
is based on the idea that both pieces of information can present measurement error, but that there is no reason for us to think that these
errors will be correlated with each other. Henderson et al. (2011) apply this to a sample of 170 countries, while Henderson et al., (2012) further
develops the intuition by providing additional examples of how night lights readings react to documented economic and social phenomena, and
estimate a model that focuses on night lights density.
148 Other studies like the 2014 SAR Urbanization Flagship report and Henderson et al., (2012) show electricity consumption has a much higher
correlation. Electricity consumption data available at the disaggregation level required for a similar analysis is not available for Ukraine.
ANNEX III Methodological Annex Using NL Data as a Proxy for Economic Activity
146
Ukraine_2015_nov26.indd 146 2015-11-26 5:14 PM
(1) (2) (3)
Log (Night lights) 0.823*** 0.694*** 0.851***
(0.0496) (0.0806) (0.0753)
2005 -0.0920
(0.149)
2006 0.153
(0.149)
2007 0.230
(0.149)
2008 0.219
(0.149)
Log(Electricity Output) 0.0800***
(0.0277)
Constant -0.278 0.591 -0.691
(0.586) (0.771) (0.866)
Observations 135 135 135
R-squared 0.473 0.507 0.501
Table 1 – Correlations with Log of real GVA
Robust standard errors in parentheses
*** p0.01, ** p0.05, * p0.1
The estimating equations are:
ln(Yit)=β0+β1 ln(NLit)+Ɛit
where i is an index for Oblasts, t is an index for time, ε is the estimation error. β1 is the parameter of interest. Because
our regression is run in logarithms, its estimated value is an estimation of the elasticity. Y is a measurement of economic
performance for Oblast I at time t. In our different regressions specifications gross regional product (GRP), GRP per
capita, and gross value added (GVA) are used as dependent variable Y149
.
149 In some specifications, which are shown in the results tables, electricity consumption is added to the estimation equation as a control.
ANNEX III Methodological Annex Using NL Data as a Proxy for Economic Activity
147
Ukraine_2015_nov26.indd 147 2015-11-26 5:14 PM
Correlation between the growth of night-time light intensity, and GVA growth. Additionally, a regression specification
is estimated that uses the growth of the logarithms across time instead of the levels. The regression in those cases is:
Δln(Yit)=β0+β1 Δln(NLit)+Ɛit
The results in columns (1) and (2) in Table 2 show that there is not a statistically significant positive relationship between
the growth in the intensity of a country’s night-time lights and its growth of real GRP. Growth is calculated for 4 years
periods. The same results are obtained when year by year growth rates are used.
(1)
0.102
Δ log(Night Lights) (0.0637)
Δ log(Electric Output) 0.0373
(0.0546)
Constant 0.888***
(0.0165)
Observations 54
R-squared 0.066
Number of code
Correlation between “URBAN” night lights intensity and levels of real GDP. Gross Value Added (GVA) data is available by
sector for the years 2001-2002. The sectors can be divided into those are typically urban and sectors that are typically
rural according to the following classification: agriculture, hunting, forestry, fishing, fish farming in the rural production,
and industry, construction, trade, repair of motor vehicles, household goods and personal goods, hotels and restaurants,
transport and communication, financial activities, real estate, lease, and engineering. Using this division, measurements
of aggregate urban and rural GVA can be constructed. It is necessary to separate urban and rural GVA, even if it is
done at an Oblast level, because the relationship between each of these two categories and night lights intensity are
fundamentally different. In particular, urban production is expected to be more strongly linked to night light intensity.
Also, given that the interest here is in using NLs to infer economic activity at the city level, it is more accurate to estimate
the relationship between the average urban production in the Oblast (as opposed to total) and the night lights classified
as urban. The tables below do just that for both levels and growth rates.
Table 2 – Correlation between growth of Log of real GRP and growth of Log of night lights
Robust standard errors in parentheses
*** p0.01, ** p0.05, * p0.1
ANNEX III Methodological Annex Using NL Data as a Proxy for Economic Activity
148
Ukraine_2015_nov26.indd 148 2015-11-26 5:14 PM
(1) (2) (3)
luntl 0.791*** 0.751*** 0.790***
(0.0564) (0.0685) (0.0401)
2003.year 0.120
(0.124)
2004.year 0.240*
(0.124)
2005.year 0.147
(0.125)
2006.year 0.235*
(0.124)
2007.year 0.417***
(0.124)
2008.year 0.338***
(0.124)
lelec 0.0296*
(0.0165)
Constant 0.593 0.775 0.391
(0.547) (0.593) (0.412)
Observations 189 189 189
R-squared 0.667 0.670 0.692
Table 3 - Correlations with Log of real urban GVA and Log of urban night lights
A significant positive relationship is obtained as expected. It is in fact quite similar to what was obtained when the
aggregate night lights for both urban and rural were used, confirming the robustness of the results. Tables 4 show results
for growth rates of the logs. Growth is calculated as the total change between 3 year periods. This reduces the effect
of noise. As opposed to the results that use aggregate GVA and lights, here, the growth of urban lights is positively and
significantly correlated with the growth of urban GVA.
ANNEX III Methodological Annex Using NL Data as a Proxy for Economic Activity
149
Ukraine_2015_nov26.indd 149 2015-11-26 5:14 PM
(1) (2)
Δ (Night Lights) 0.404*** 0.390***
(0.0921) (0.0955)
Δ( Electric output) 0.0182
(0.0223)
Constant 0.192*** 0.191***
(0.0117) (0.0123)
Observations 54 54
R-squared 0.260 0.266
Table 4 - Correlations with growth of Log of real urban GVA and growth of Log of urban night
Robust standard errors in parentheses
*** p0.01, ** p0.05, * p0.1
Heterogeneity in interregional variation between night lights intensity and economic activity. In Bickenbach et al (2013)
data on Brazil, India, United States and some countries in Western Europe are used to show that the relationship
between economic activity and night lights is not stable when looking at subnational or regional units. As a consequence,
conclusions drawn about the differences between cities in different regions based solely on night lights are less reliable
than comparisons for a single city across time. In the following table, results are presented for regressions that use
interactions with a dummy for regions. The elasticity between economic activity and nigh lights is, by this construction,
allowed to be different across regions.
In table 4, Region 1 refers to the Western, region 2 to the Eastern region, region 3 to the Central region, and region 4 to
the Southern region (omitted category). The first two columns show a model that uses total (urban and rural) economic
activity and night lights. The second column shows that the interaction with regional dummies is significant, which
implies a varying elasticity . These regional effects are significant and show that, all else equal, the region where a city is
located affects how much light it emits even at similar economic activity levels. This is also true when considering only
urban economic activity and lights in columns 3 and 4.
The regional effects are significant for the Western region, i.e. for similar levels of night lights, economic activity is lower
in the East (when compared to the missed category (Southern)). The contrast is more important in the regressions that
use urban variables, in which both the Western and the Central regions present this trend. This explains statistically
why the large growth in lights in these two regions is not necessarily accompanied by a large growth in economic. The
economic reason behind this might be more complex, but the differences in the movements from urban to rural as well as
the initial conditions (the East being initially much more urban and industrial in nature while Central region being more
service oriented) are candidate explanations.
Finally, joint tests that compare the elasticities between regions conclude that they are statistically different.
150 The elasticity in this case is given by the coefficient on the night lights independent variable plus the coefficient on the interaction between
night lights and the corresponding regional dummy.
ANNEX III Methodological Annex Using NL Data as a Proxy for Economic Activity
150
Ukraine_2015_nov26.indd 150 2015-11-26 5:14 PM
(1) (2) (3) (4)
VARIABLES GVA GVA GVA Urban GVA Urban
Log(Night Lights) 0.839*** 0.728***
(0.0496) (0.0620)
Western X log(Night Lights) -0.0283***
(0.00632)
Eastern X log(Night Lights) 0.0133
(0.00888)
Central X log(Night Lights) -0.00235
(0.0110)
year 0.0754** 0.0705** 0.0573***
(0.0336) (0.0326) (0.0166)
Log (Urban Night Lights) 0.786*** 0.776***
(0.0555) (0.0615)
Western X log (Urban Night Lights) -0.0325***
(0.00605)
Eastern X log (Urban Night Lights) -0.00127
(0.00796)
Central X log (Urban Night Lights) -0.0343***
(0.00818)
Constant -151.8** -140.6** -114.2*** 0.958
(67.54) (65.57) (33.22) (0.623)
Observations 135 135 189 189
R-squared 0.493 0.528 0.687 0.706
Joint Test dummies 0.000 0.000
Table 5 - Correlation between GVA and night lights changes are significantly different between
regions
Robust standard errors in parentheses
*** p0.01, ** p0.05, * p0.1
ANNEX III Methodological Annex Using NL Data as a Proxy for Economic Activity
151
Ukraine_2015_nov26.indd 151 2015-11-26 5:14 PM
Annex IV
Robustness of City Typologies
The threshold used to define whether an area is part of an urban footprint or is rural has been selected by calibrating
the lights data against higher resolution land use cover maps, in particular, the European Space Agency’s GlobCover 2009
map and the MODIS Collection 5 Land Cover Type. This calibration process uses images to determine which areas are urban
and which are rural and then contrasts it with measurements of emitted light. A model is built with this relationship
to determine urban and rural areas in the rest of the country. The errors of this process allow for the calculation of a
distribution of thresholds. The median threshold is the one used in the section to determine urban areas. For Ukraine, this
threshold was determined to be 20.94 DN. Intensity of night-time light here is measured on a “Digital Number” (DN) scale.
The determination of this threshold is subject to measurement error. This error is transmitted to the determination of the
typologies constructed in the section. Depending on how close to the threshold the light emitted by a city is, a city might
jump between the different categories (Found, Appeared, Disappeared, Missed) if the threshold is perturbed marginally.
Similarly, both area change and intensive growth could pass from negative to positive or vice versa, if numbers are close
to the threshold. To test the robustness of these typologies, they can be calculated using not only the original threshold,
but also the 5th
and 95th
percentile. This gives a 90 percent confidence interval that a particular area is urban or rural
when determined by NLs thresholds. This error bounds are passed to the typology classification.
When testing the first typology with the 90 percent confidence interval, a total misclassification or classification error
of 15 percent is obtained. This means that performing the classification of the first typology the 5th
and 95th
percentiles
and comparing it with the current classification (calculated with the median or 50th
percentile), only 15 percent of cities
change type. The change comes from cities that were close to the median threshold. For example, one city could have
disappeared by presenting emitted lights just below the urban threshold in the second period. Changing this threshold
can move it from disappeared to found.
Similarly, when testing the second typology with the 90 percent confidence interval, a total misclassification of 35
percent is obtained. The same logic applies as before. The classification error in this case was expected to be higher
because changing the threshold changes the urban footprint, which changes multiple dimensions of the data used to
construct the second typology: it changes the total area of the footprint, which determines the area change; it also
changes the amount of light emitted in the core, as it changes the measurement of the core, as well as its change
overtime. Given that the confidence interval is so wide, this scale of misclassification error is not so large151
.
151 See Denison D., Holmes C., Mallick B., Smith A., Bayesian Methods for Nonlinear Classification and Regression. (2002) for a discussion on
classification error and applications on the social sciences.
ANNEX IV Robusness of City Typologies
152
Ukraine_2015_nov26.indd 152 2015-11-26 5:14 PM
153
Ukraine_2015_nov26.indd 153 2015-11-26 5:14 PM
Annex V
List of Ukrainian Cities (2013)
City Oblast
Typology
2
Population
2013
Typology
1
Region Size Population growth
Typology
3
Simferopol Crimea 1 337285 FOUND Southern
Mid size cities
(100k - 500k)
Declining but less
than urban average
A
Vinnytsia Vinnytsia 1 371698 FOUND Central
Mid size cities
(100k - 500k)
Positive growth A
Rivne Rivne 1 250333 FOUND Western
Mid size cities
(100k - 500k)
Positive growth A
Ternopil Ternopil 1 217118 FOUND Western
Mid size cities
(100k - 500k)
Declining but less
than urban average
A
Kamianets-
Podilskyi
Khmelnytskyi 1 102743 FOUND Western
Mid size cities
(100k - 500k)
Positive growth A
Sarny Rivne 1 28625 FOUND Western
Large towns
(20k - 50k)
Positive growth A
Kuznetsovsk Rivne 1 41432 FOUND Western
Large towns
(20k - 50k)
Positive growth A
Kivertsi Volhynia 1 14611 FOUND Western
Mid size towns
(10k - 20k)
Declining more than
national average
A
Stryi Lviv 1 60126 FOUND Western
Small cities
(50k - 100k)
Declining but less
than urban average
A
Chernihiv Cernihiv 1 296089 FOUND Central
Mid size cities
(100k - 500k)
Declining but less
than urban average
A
Shepetivka Khmelnytskyi 1 43375 FOUND Western
Small cities
(50k - 100k)
Declining more than
national average
A
Kovel Volhynia 1 68912 FOUND Western
Small cities
(50k - 100k)
Positive growth A
Hnivan Vinnytsia 1 12587 FOUND Central
Mid size towns
(10k - 20k)
Declining but less
than urban average
A
Khust Zakarpattia 1 28643 FOUND Western
Large towns
(20k - 50k)
Declining but less
than urban average
A
Chernivtsi Cernivcy 1 258842 FOUND Western
Mid size cities
(100k - 500k)
Positive growth A
ANNEX V List of Ukrainian Cities
154
Ukraine_2015_nov26.indd 154 2015-11-26 5:14 PM
City Oblast
Typology
2
Population
2013
Typology
1
Region Size Population growth
Typology
3
Kerch Crimea 1 145265 FOUND Southern
Mid size cities
(100k - 500k)
Declining more than
national average
A
Kalush
Ivano-
Frankivsk
1 67585 FOUND Western
Small cities
(50k - 100k)
Declining but less
than urban average
A
Khmel-
nytskyi
Khmel-
nytskyi
1 264988 FOUND Western
Mid size cities
(100k - 500k)
Positive growth A
Kostopil Rivne 1 31590 FOUND Western
Large towns
(20k - 50k)
Positive growth A
Bakhmach Cernihiv 1 18683 FOUND Central
Large towns
(20k - 50k)
Declining more than
national average
A
Kharkov Charkiv 1 1451028 FOUND Eastern
Major cities (
500k)
Declining but less
than urban average
A
Kamianka-
Buzka
Lviv 1 10900 FOUND Western
Mid size towns
(10k - 20k)
Declining more than
national average
A
Pyriatyn Poltava 1 15981 FOUND Central
Mid size towns
(10k - 20k)
Declining but less
than urban average
A
Vynohradiv Zakarpa-ttia 1 25565 FOUND Western
Large towns
(20k - 50k)
Declining but less
than urban average
A
Brody Lviv 1 23784 FOUND Western
Large towns
(20k - 50k)
Positive growth A
Yevpatoria Crimea 1 106877 FOUND Southern
Mid size cities
(100k - 500k)
Positive growth A
Sokal Lviv 1 21386 FOUND Western
Large towns
(20k - 50k)
Declining but less
than urban average
A
Volodymyr-
Volynskyi
Volhynia 1 38870 FOUND Western
Large towns
(20k - 50k)
Positive growth A
Feodosiya Crimea 1 69461 FOUND Southern
Small cities
(50k - 100k)
Declining more than
national average
A
Staro-
kostiantyniv
Khmel
nytskyi
1 34945 FOUND Western
Large towns
(20k - 50k)
Declining but less
than urban average
A
Soledar Donetsk 1 11708 FOUND Eastern
Mid size towns
(10k - 20k)
Declining more than
national average
A
Rava-Ruska Lviv 1 8426 FOUND Western
Small Town
(10k)
Positive growth A
Kolomyia
Ivano-
Frankivsk
1 61428 FOUND Western
Small cities
(50k - 100k)
Declining but less
than urban average
A
ANNEX V List of Ukrainian Cities
155
Ukraine_2015_nov26.indd 155 2015-11-26 5:14 PM
City Oblast
Typology
2
Population
2013
Typology
1
Region Size Population growth
Typology
3
Dunaivtsi
Khmel-
nytskyi
1 16219 FOUND Western
Mid size towns
(10k - 20k)
Declining but less
than urban average
A
Hlukhiv Sumy 1 34574 FOUND Central
Large towns
(20k - 50k)
Declining but less
than urban average
A
Novovo-
lynsk
Volhynia 1 53199 FOUND Western
Small cities
(50k - 100k)
Declining but less
than urban average
A
Nizhyn Cernihiv 1 73282 FOUND Central
Small cities
(50k - 100k)
Declining but less
than urban average
A
Berehove Zakar-pattia 1 24458 FOUND Western
Large towns
(20k - 50k)
Declining more than
national average
A
Yalta Crimea 1 78115 FOUND Southern
Small cities
(50k - 100k)
Declining but less
than urban average
A
Sevastopol Sevas-topol 1 342580 FOUND Southern
Mid size cities
(100k - 500k)
Positive growth A
Zbarazh Ternopil 1 14004 FOUND Western
Mid size towns
(10k - 20k)
Positive growth A
Chervo-
nohrad
Lviv 1 68000 FOUND Western
Small cities
(50k - 100k)
Declining but less
than urban average
A
Horodok_K
Khmel-
nytskyi
1 16761 FOUND Western
Mid size towns
(10k - 20k)
Declining but less
than urban average
A
Ismail Odessa 1 73007 FOUND Southern
Small cities
(50k - 100k)
Declining more than
national average
A
Kalynivka Vinnytsia 1 19291 FOUND Central
Mid size towns
(10k - 20k)
Declining but less
than urban average
A
Mena Cernihiv 1 12264 FOUND Central
Mid size towns
(10k - 20k)
Declining but less
than urban average
A
Ivano-
Frankivsk
Ivano-
Frankivsk
1 226018 FOUND Western
Mid size cities
(100k - 500k)
Positive growth A
Skvyra Kiev 1 16715 FOUND Central
Mid size towns
(10k - 20k)
Declining more than
national average
A
Lviv Lviv 1 730272 FOUND Western
Major cities (
500k)
Declining but less
than urban average
A
Sambir Lviv 1 34899 FOUND Western
Large towns
(20k - 50k)
Declining but less
than urban average
A
Droho-
bych
Lviv 1 77080 FOUND Western
Small cities
(50k - 100k)
Declining but less
than urban average
A
ANNEX V List of Ukrainian Cities
156
Ukraine_2015_nov26.indd 156 2015-11-26 5:14 PM
City Oblast
Typology
2
Population
2013
Typology
1
Region Size Population growth
Typology
3
Lutsk Volhynia 1 214727 FOUND Western
Mid size cities
(100k - 500k)
Positive growth A
Zhytomyr Zhytomyr 1 271303 FOUND Central
Mid size cities
(100k - 500k)
Declining but less
than urban average
A
Zolochiv Lviv 1 24074 FOUND Western
Large towns
(20k - 50k)
Positive growth A
Odessa Odessa 1 1014852 FOUND Southern
Major cities (
500k)
Declining but less
than urban average
A
Hadiach Poltava 1 24196 FOUND Central
Large towns
(20k - 50k)
Positive growth A
Uman Cherkasy 1 87111 FOUND Central
Small cities
(50k - 100k)
Declining but less
than urban average
A
Kiev Kiev 1 2757900 FOUND Central
Small Town
(10k)
Positive growth A
Buryn Sumy 1 9134 FOUND Central
Mid size towns
(10k - 20k)
Declining more than
national average
A
Zoloto-
nosha
Cherkasy 1 28371 FOUND Central
Large towns
(20k - 50k)
Declining but less
than urban average
A
Radekhiv Lviv 1 9600 FOUND Western
Small Town
(10k)
Positive growth A
Dubno Rivne 1 38019 FOUND Western
Large towns
(20k - 50k)
Declining but less
than urban average
A
Kakhovka Kherson 2 37419 FOUND Southern
Large towns
(20k - 50k)
Declining but less
than urban average
B
Bar Vinnytsia 2 16442 APPEAR Central
Mid size towns
(10k - 20k)
Declining but less
than urban average
B
Luhansk Luhansk 2 425848 FOUND Eastern
Mid size cities
(100k - 500k)
Declining more than
national average
B
Starobilsk Luhansk 2 18297 FOUND Eastern
Large towns
(20k - 50k)
Declining more than
national average
B
Mykolaivka Donetsk 2 15684 FOUND Eastern
Mid size towns
(10k - 20k)
Declining but less
than urban average
D
Torez Donetsk 2 57998 FOUND Eastern
Small cities
(50k - 100k)
Declining more than
national average
B
Sniatyn
Ivano-
Frankivsk
2 10106 APPEAR Western
Mid size towns
(10k - 20k)
Declining but less
than urban average
B
ANNEX V List of Ukrainian Cities
157
Ukraine_2015_nov26.indd 157 2015-11-26 5:14 PM
City Oblast
Typology
2
Population
2013
Typology
1
Region Size Population growth
Typology
3
Balakliia Charkiv 2 29499 FOUND Eastern
Large towns
(20k - 50k)
Declining more than
national average
B
Popasna Luhansk 2 21917 FOUND Eastern
Large towns
(20k - 50k)
Declining more than
national average
B
Marhanets
Dnipro-
petrovsk
2 48546 FOUND Southern
Small cities
(50k - 100k)
Declining but less
than urban average
B
Bolekhiv
Ivano-
Frankivsk
2 10768 APPEAR Western
Mid size towns
(10k - 20k)
Positive growth B
Synelny-
kove
Dnipro-
petrovsk
2 31568 FOUND Southern
Large towns
(20k - 50k)
Declining but less
than urban average
B
Khmilnyk Vinnytsia 2 28209 APPEAR Central
Large towns
(20k - 50k)
Positive growth B
Chortkiv Ternopil 2 29640 FOUND Western
Large towns
(20k - 50k)
Positive growth B
Znamianka Kirovohrad 2 23983 FOUND Central
Large towns
(20k - 50k)
Declining more than
national average
B
Buchach Ternopil 2 12597 APPEAR Western
Mid size towns
(10k - 20k)
Positive growth B
Krasnohrad Charkiv 2 21332 FOUND Eastern
Large towns
(20k - 50k)
Declining but less
than national
average
B
Komsomolsk Poltava 2 51730 FOUND Central
Small cities
(50k - 100k)
Declining but less
than urban average
B
Sievero-
donetsk
Luhansk 2 109466 FOUND Eastern
Mid size cities
(100k - 500k)
Declining more than
national average
B
Novoia-
vorivske
Lviv 2 29580 APPEAR Western
Large towns
(20k - 50k)
Positive growth B
Novyj Rozdil Lviv 2 28797 APPEAR Western
Large towns
(20k - 50k)
Positive growth B
Mohyliv-
Podilskyi
Vinnytsia 2 32056 FOUND Central
Large towns
(20k - 50k)
Declining but less
than urban average
B
Volochysk
Khmel-
nytskyi
2 19619 APPEAR Western
Large towns
(20k - 50k)
Declining more than
national average
B
Pervomaisk Mykolaiv 2 66671 FOUND Southern
Small cities
(50k - 100k)
Declining but less
than urban average
B
Kaniv Cherkasy 2 25558 APPEAR Central
Large towns
(20k - 50k)
Declining but less
than urban average
B
ANNEX V List of Ukrainian Cities
158
Ukraine_2015_nov26.indd 158 2015-11-26 5:14 PM
City Oblast
Typology
2
Population
2013
Typology
1
Region Size Population growth
Typology
3
Trostianets Sumy 2 21368 FOUND Central
Large towns
(20k - 50k)
Declining more than
national average
B
Ordzho-
nikidze
Dnipro-
petrovsk
2 41374 FOUND Southern
Large towns
(20k - 50k)
Declining more than
national average
B
Konotop Sumy 2 88787 FOUND Central
Small cities
(50k - 100k)
Declining but less
than urban average
B
Zalishchyky Ternopil 2 9417 APPEAR Western
Mid size towns
(10k - 20k)
Declining more than
national average
B
Bakhchi
saray
Crimea 2 26482 APPEAR Southern
Large towns
(20k - 50k)
Declining but less
than urban average
B
Horodok_L Lviv 2 15959 APPEAR Western
Mid size towns
(10k - 20k)
Declining but less
than urban average
B
Lebedyn Sumy 2 26137 FOUND Central
Large towns
(20k - 50k)
Declining more than
national average
D
Novyi Buh Mykolaiv 2 15531 FOUND Southern
Mid size towns
(10k - 20k)
Declining but less
than urban average
B
Yuzhnou
krainsk
Mykolaiv 2 40555 FOUND Southern
Large towns
(20k - 50k)
Positive growth B
Snizhne Donetsk 2 48485 FOUND Eastern
Small cities
(50k - 100k)
Declining more than
national average
B
Okhtyrka Sumy 2 49047 FOUND Central
Small cities
(50k - 100k)
Declining but less
than urban average
B
Nemyriv Vinnytsia 2 11900 APPEAR Central
Mid size towns
(10k - 20k)
Declining but less
than urban average
B
Nova
Kakhovka
Kherson 2 47852 FOUND Southern
Small cities
(50k - 100k)
Declining more than
national average
B
Kotovsk Odessa 2 40692 FOUND Southern
Large towns
(20k - 50k)
Declining but less
than urban average
B
Enerhodar Zaporizhia 2 54708 FOUND Southern
Large towns
(20k - 50k)
Declining but less
than urban average
B
Slavutych Kiev 2 24826 FOUND Central
Mid size towns
(10k - 20k)
Positive growth B
Zvenyho
rodka
Cherkasy 2 17958 APPEAR Central
Large towns
(20k - 50k)
Declining more than
national average
B
Druzhkivka Donetsk 2 59863 FOUND Eastern
Small cities
(50k - 100k)
Declining more than
national average
B
ANNEX V List of Ukrainian Cities
159
Ukraine_2015_nov26.indd 159 2015-11-26 5:14 PM
City Oblast
Typology
2
Population
2013
Typology
1
Region Size Population growth
Typology
3
Dnipro
dzerzhynsk
Dnipro
petrovsk
2 241880 FOUND Southern
Mid size cities
(100k - 500k)
Declining but less
than urban average
B
Morshyn Lviv 2 6037 APPEAR Western
Small Town
(10k)
Declining more than
national average
B
Chasiv Yar Donetsk 2 13999 FOUND Eastern
Mid size towns
(10k - 20k)
Declining more than
national average
B
Romny Sumy 2 42616 FOUND Central
Small cities
(50k - 100k)
Declining more than
national average
B
Liuboml Volhynia 2 10246 APPEAR Western
Mid size towns
(10k - 20k)
Declining but less
than urban average
B
Lutuhyne Luhansk 2 17989 FOUND Eastern
Mid size towns
(10k - 20k)
Declining but less
than urban average
B
Kherson Kherson 2 299052 FOUND Southern
Mid size cities
(100k - 500k)
Declining more than
national average
B
Berdiansk Zaporizhia 2 116034 FOUND Southern
Mid size cities
(100k - 500k)
Declining but less
than urban average
B
Hrebinka Poltava 2 10960 FOUND Central
Mid size towns
(10k - 20k)
Declining but less
than national
average
D
Poltava Poltava 2 296852 FOUND Central
Mid size cities
(100k - 500k)
Declining more than
national average
D
Burshtyn
Ivano-
Frankivsk
2 15340 APPEAR Western
Mid size towns
(10k - 20k)
Positive growth B
Dolyna
Ivano-
Frankivsk
2 20622 FOUND Western
Large towns
(20k - 50k)
Declining but less
than urban average
B
Zhydachiv Lviv 2 11180 APPEAR Western
Mid size towns
(10k - 20k)
Declining but less
than urban average
B
Myronivka Kiev 2 11964 FOUND Central
Mid size towns
(10k - 20k)
Declining more than
national average
B
Nowomos
kowsk
Dnipro
petrovsk
2 70787 FOUND Southern
Small cities
(50k - 100k)
Declining but less
than urban average
B
Kosiv
Ivano-
Frankivsk
2 8543 APPEAR Western
Small Town
(10k)
Positive growth B
Zmiiv Charkiv 2 15211 FOUND Eastern
Large towns
(20k - 50k)
Declining more than
national average
B
Mostyska Lviv 2 9193 APPEAR Western
Small Town
(10k)
Positive growth B
ANNEX V List of Ukrainian Cities
160
Ukraine_2015_nov26.indd 160 2015-11-26 5:14 PM
City Oblast
Typology
2
Population
2013
Typology
1
Region Size Population growth
Typology
3
Amvrosiivka Donetsk 2 18832 FOUND Eastern
Large towns
(20k - 50k)
Declining more than
national average
B
Horodnia Cernihiv 2 12558 APPEAR Central
Mid size towns
(10k - 20k)
Declining more than
national average
B
Mykolaiv_M Mykolaiv 2 496188 FOUND Southern
Major cities (
500k)
Declining but less
than urban average
B
Krasnyi
Lyman
Donetsk 2 22509 FOUND Eastern
Large towns
(20k - 50k)
Declining more than
national average
B
Kostianty
nivka
Donetsk 2 77066 FOUND Eastern
Mid size cities
(100k - 500k)
Declining more than
national average
B
Shchors Cernihiv 2 11471 APPEAR Central
Mid size towns
(10k - 20k)
Declining more than
national average
B
Oleksandriia Kirovohrad 2 82819 FOUND Central
Mid size cities
(100k - 500k)
Declining more than
national average
B
Khorol Poltava 2 13593 APPEAR Central
Mid size towns
(10k - 20k)
Declining more than
national average
B
Ternivka
Dnipro
petrovsk
2 28920 FOUND Southern
Large towns
(20k - 50k)
Declining but less
than urban average
B
Polohy Zaporizhia 2 19906 FOUND Southern
Large towns
(20k - 50k)
Declining more than
national average
B
Alushta Crimea 2 28418 APPEAR Southern
Large towns
(20k - 50k)
Declining more than
national average
B
Khodoriv Lviv 2 9829 APPEAR Western
Mid size towns
(10k - 20k)
Declining more than
national average
B
Kryvyj Rih
Dnipro
petrovsk
2 656478 FOUND Southern
Major cities (
500k)
Declining but less
than urban average
B
Koziatyn Vinnytsia 2 24247 FOUND Central
Large towns
(20k - 50k)
Declining more than
national average
B
Pomichna Kirovohrad 2 9210 FOUND Central
Mid size towns
(10k - 20k)
Declining more than
national average
D
Druzhba Sumy 2 5031 FOUND Central
Small Town
(10k)
Declining more than
national average
B
Krasnyi Luch Luhansk 2 82765 FOUND Eastern
Mid size cities
(100k - 500k)
Declining more than
national average
B
Vovchansk Charkiv 2 19082 FOUND Eastern
Large towns
(20k - 50k)
Declining more than
national average
B
ANNEX V List of Ukrainian Cities
161
Ukraine_2015_nov26.indd 161 2015-11-26 5:14 PM
City Oblast
Typology
2
Population
2013
Typology
1
Region Size Population growth
Typology
3
Reni Odessa 2 19480 FOUND Southern
Large towns
(20k - 50k)
Declining but less
than urban average
D
Mykolaiv_L Lviv 2 14877 FOUND Western
Mid size towns
(10k - 20k)
Positive growth B
Dzhankoy Crimea 2 36086 FOUND Southern
Small cities
(50k - 100k)
Declining more than
national average
D
Svaliava Zakarpattia 2 17027 FOUND Western
Mid size towns
(10k - 20k)
Declining but less
than urban average
B
Chervono
zavodske
Poltava 2 8612 FOUND Central
Mid size towns
(10k - 20k)
Declining but less
than urban average
B
Saky Crimea 2 23655 APPEAR Southern
Large towns
(20k - 50k)
Declining more than
national average
B
Kitsman Cernivcy 2 6762 APPEAR Western
Small Town
(10k)
Declining more than
national average
B
Dokucha
ievsk
Donetsk 2 23733 FOUND Eastern
Large towns
(20k - 50k)
Declining but less
than urban average
B
Zuhres Donetsk 2 18553 FOUND Eastern
Large towns
(20k - 50k)
Declining more than
national average
B
Zelenodolsk
Dnipro
petrovsk
2 13947 FOUND Southern
Mid size towns
(10k - 20k)
Declining but less
than urban average
B
Chop Zakarpattia 2 8994 FOUND Western
Small Town
(10k)
Positive growth B
Pryluky Cernihiv 2 58475 FOUND Central
Small cities
(50k - 100k)
Declining more than
national average
B
Yaremche
Ivano-
Frankivsk
2 8124 APPEAR Western
Small Town
(10k)
Positive growth B
Berezan Kiev 2 16543 APPEAR Central
Mid size towns
(10k - 20k)
Declining but less
than urban average
B
Swerdlovsk Luhansk 2 65276 FOUND Eastern
Small cities
(50k - 100k)
Declining more than
national average
B
Rozdilna Odessa 2 17904 FOUND Southern
Mid size towns
(10k - 20k)
Positive growth B
Kaharlyk Kiev 2 13758 APPEAR Central
Mid size towns
(10k - 20k)
Positive growth B
Melitopol Zaporizhia 2 156984 FOUND Southern
Mid size cities
(100k - 500k)
Declining but less
than urban average
B
ANNEX V List of Ukrainian Cities
162
Ukraine_2015_nov26.indd 162 2015-11-26 5:14 PM
City Oblast
Typology
2
Population
2013
Typology
1
Region Size Population growth
Typology
3
Izium Charkiv 2 51511 FOUND Eastern
Small cities
(50k - 100k)
Declining more than
national average
B
Sudak Crimea 2 15457 APPEAR Southern
Mid size towns
(10k - 20k)
Positive growth B
Vilniansk Zaporizhia 2 15682 FOUND Southern
Mid size towns
(10k - 20k)
Declining but less
than urban average
B
Staryi
Sambir
Lviv 2 6446 APPEAR Western
Small Town
(10k)
Positive growth B
Svitlovodsk Kirovohrad 2 46613 FOUND Central
Small cities
(50k - 100k)
Declining more than
national average
B
Khrysty
nivka
Cherkasy 2 10860 FOUND Central
Mid size towns
(10k - 20k)
Declining more than
national average
D
Bilopillia Sumy 2 16731 FOUND Central
Mid size towns
(10k - 20k)
Declining more than
national average
B
Verkhivtseve
Dnipro
petrovsk
2 10033 FOUND Southern
Mid size towns
(10k - 20k)
Declining but less
than urban average
B
Krolevets Sumy 2 23574 FOUND Central
Large towns
(20k - 50k)
Declining more than
national average
B
Malyn Zhytomyr 2 26934 FOUND Central
Large towns
(20k - 50k)
Declining but less
than urban average
B
Vilnohirsk
Dnipro
petrovsk
2 23764 FOUND Southern
Large towns
(20k - 50k)
Declining but less
than urban average
B
Kirovske Donetsk 2 28291 FOUND Eastern
Large towns
(20k - 50k)
Declining more than
national average
B
Dniprorudne Zaporizhia 2 19479 FOUND Southern
Large towns
(20k - 50k)
Declining more than
national average
D
Debaltseve Donetsk 2 25774 FOUND Eastern
Large towns
(20k - 50k)
Declining more than
national average
B
Novoselytsia Cernivcy 2 7774 APPEAR Western
Small Town
(10k)
Declining more than
national average
B
Novodni
strovsk
Cernivcy 2 10776 APPEAR Western
Mid size towns
(10k - 20k)
Positive growth B
Zhovkva Lviv 2 13594 APPEAR Western
Mid size towns
(10k - 20k)
Positive growth B
Piatykhatky
Dnipro
petrovsk
2 18944 FOUND Southern
Large towns
(20k - 50k)
Declining more than
national average
B
ANNEX V List of Ukrainian Cities
163
Ukraine_2015_nov26.indd 163 2015-11-26 5:14 PM
City Oblast
Typology
2
Population
2013
Typology
1
Region Size Population growth
Typology
3
Kamin-
Kashyrskyi
Volhynia 2 12018 APPEAR Western
Small Town
(10k)
Positive growth B
Krasyliv
Khmelnyt
skyi
2 19743 APPEAR Western
Large towns
(20k - 50k)
Declining but less
than urban average
B
Khotyn Cernivcy 2 9771 APPEAR Western
Mid size towns
(10k - 20k)
Declining more than
national average
B
Kramatorsk Donetsk 2 164283 FOUND Eastern
Mid size cities
(100k - 500k)
Declining more than
national average
B
Bobrynets Kirovohrad 2 10991 APPEAR Central
Mid size towns
(10k - 20k)
Declining more than
national average
B
Lokhvytsia Poltava 2 11863 APPEAR Central
Mid size towns
(10k - 20k)
Declining but less
than urban average
B
Horokhiv Volhynia 2 9093 APPEAR Western
Small Town
(10k)
Positive growth B
Kupiansk Charkiv 2 29487 FOUND Eastern
Large towns
(20k - 50k)
Declining more than
national average
B
Dnepro
petrovsk
Dnipro
petrovsk
2 997754 FOUND Southern
Major cities (
500k)
Declining more than
national average
D
Horlivka Donetsk 2 256714 FOUND Eastern
Mid size cities
(100k - 500k)
Declining more than
national average
D
Sokyriany Cernivcy 2 9462 APPEAR Western
Mid size towns
(10k - 20k)
Declining more than
national average
B
Smila Cherkasy 2 68636 FOUND Central
Small cities
(50k - 100k)
Declining but less
than urban average
B
Kurakhove Donetsk 2 20098 FOUND Eastern
Large towns
(20k - 50k)
Declining more than
national average
D
Berezhany Ternopil 2 18161 APPEAR Western
Mid size towns
(10k - 20k)
Positive growth B
Alchevsk Luhansk 2 111360 FOUND Eastern
Mid size cities
(100k - 500k)
Declining more than
national average
B
Shpola Cherkasy 2 17806 FOUND Central
Large towns
(20k - 50k)
Declining more than
national average
B
Krasno
perekopsk
Crimea 2 29815 FOUND Southern
Large towns
(20k - 50k)
Declining but less
than urban average
D
Biliaivka Odessa 2 12052 APPEAR Southern
Mid size towns
(10k - 20k)
Declining more than
national average
B
ANNEX V List of Ukrainian Cities
164
Ukraine_2015_nov26.indd 164 2015-11-26 5:14 PM
City Oblast
Typology
2
Population
2013
Typology
1
Region Size Population growth
Typology
3
Dzerzhynsk Donetsk 2 35296 FOUND Eastern
Small cities
(50k - 100k)
Declining more than
national average
B
Nikopol
Dnipro
petrovsk
2 118720 FOUND Southern
Mid size cities
(100k - 500k)
Declining more than
national average
B
Iziaslav
Khmelnyt
skyi
2 17172 APPEAR Western
Mid size towns
(10k - 20k)
Declining more than
national average
B
Komsomol
ske
Donetsk 2 11763 FOUND Eastern
Mid size towns
(10k - 20k)
Declining more than
national average
B
Antratsyt Luhansk 2 54640 FOUND Eastern
Small cities
(50k - 100k)
Declining more than
national average
B
Ilovaisk Donetsk 2 15949 FOUND Eastern
Large towns
(20k - 50k)
Declining more than
national average
B
Korsun-
Shevchenkiv-
skyi
Cherkasy 2 18655 APPEAR Central
Large towns
(20k - 50k)
Declining but less
than urban average
B
Zhmerynka Vinnytsia 2 35390 FOUND Central
Large towns
(20k - 50k)
Declining but less
than urban average
B
Zhovti Vody
Dnipro-
petrovsk
2 47509 FOUND Southern
Small cities
(50k - 100k)
Declining more than
national average
B
Artemivsk Donetsk 2 77620 FOUND Eastern
Small cities
(50k - 100k)
Declining more than
national average
B
Lubny Poltava 2 47643 FOUND Central
Small cities
(50k - 100k)
Declining more than
national average
B
Pochaiv Ternopil 2 7842 APPEAR Western
Mid size towns
(10k - 20k)
Declining but less
than urban average
B
Krasnodon Luhansk 2 44283 FOUND Eastern
Small cities
(50k - 100k)
Declining more than
national average
B
Olevsk Zhytomyr 2 10231 APPEAR Central
Mid size towns
(10k - 20k)
Declining but less
than national
average
B
Stakhanov Luhansk 2 77593 FOUND Eastern
Mid size cities
(100k - 500k)
Declining more than
national average
B
Rovenky Luhansk 2 47852 FOUND Eastern
Small cities
(50k - 100k)
Declining more than
national average
B
Vorozhba Sumy 3 7444
DIS
APPEAR
Central
Small Town
(10k)
Declining more than
national average
C
ANNEX V List of Ukrainian Cities
165
Ukraine_2015_nov26.indd 165 2015-11-26 5:14 PM
City Oblast
Typology
2
Population
2013
Typology
1
Region Size Population growth
Typology
3
Bila Tserkva Kiev 3 210919 FOUND Central
Mid size cities
(100k - 500k)
Positive growth C
Haisyn Vinnytsia 3 25855 FOUND Central
Large towns
(20k - 50k)
Positive growth E
Myrhorod Poltava 3 41109 FOUND Central
Large towns
(20k - 50k)
Declining but less
than urban average
E
Yavoriv Lviv 3 12905 FOUND Western
Mid size towns
(10k - 20k)
Declining but less
than urban average
E
Siversk Donetsk 3 12145
DIS
APPEAR
Eastern
Mid size towns
(10k - 20k)
Declining more than
national average
C
Ladyzhyn Vinnytsia 3 22961 FOUND Central
Mid size towns
(10k - 20k)
Positive growth E
Krasno-
armiysk
Donetsk 3 64895 FOUND Eastern
Small cities
(50k - 100k)
Declining but less
than national
average
E
Bobrovytsia Cernihiv 3 11238
DIS
APPEAR
Central
Mid size towns
(10k - 20k)
Declining but less
than urban average
C
Kobeliaky Poltava 3 10181
DIS
APPEAR
Central
Mid size towns
(10k - 20k)
Declining more than
national average
C
Bohodukhiv Charkiv 3 15797 FOUND Eastern
Mid size towns
(10k - 20k)
Declining more than
national average
E
Haivoron Kirovohrad 3 15214
DIS
APPEAR
Central
Mid size towns
(10k - 20k)
Declining but less
than urban average
C
Volnovakha Donetsk 3 23305 FOUND Eastern
Large towns
(20k - 50k)
Declining but less
than urban average
E
Apostolove
Dnipro
petrovsk
3 14432
DIS
APPEAR
Southern
Mid size towns
(10k - 20k)
Declining more than
national average
C
Kreminna Luhansk 3 20324
DIS
APPEAR
Eastern
Large towns
(20k - 50k)
Declining more than
national average
C
Verkhniod
niprovsk
Dnipro
petrovsk
3 16885
DIS
APPEAR
Southern
Large towns
(20k - 50k)
Declining but less
than urban average
C
Kirovohrad Kirovohrad 3 234322 FOUND Central
Mid size cities
(100k - 500k)
Declining more than
national average
C
Selydove Donetsk 3 24145
DIS
APPEAR
Eastern
Large towns
(20k - 50k)
Declining more than
national average
C
Karlivka Poltava 3 15202
DIS
APPEAR
Central
Large towns
(20k - 50k)
Declining more than
national average
C
ANNEX V List of Ukrainian Cities
166
Ukraine_2015_nov26.indd 166 2015-11-26 5:14 PM
City Oblast
Typology
2
Population
2013
Typology
1
Region Size Population growth
Typology
3
Netishyn
Khmelny
tskyi
3 36741 FOUND Western
Large towns
(20k - 50k)
Positive growth C
Pervo
maisk L
Luhansk 3 38435 FOUND Eastern
Small cities
(50k - 100k)
Declining more than
national average
E
Kremenchuk Poltava 3 225892 FOUND Central
Mid size cities
(100k - 500k)
Declining but less
than urban average
C
Barvinkove Charkiv 3 9709
DIS
APPEAR
Eastern
Mid size towns
(10k - 20k)
Declining more than
national average
C
Cherkasy Cherkasy 3 285605 FOUND Central
Mid size cities
(100k - 500k)
Declining but less
than urban average
E
Novohrad-
Volynskyi
Zhytomyr 3 55991 FOUND Central
Small cities
(50k - 100k)
Declining but less
than urban average
E
Korosten Zhytomyr 3 65503 FOUND Central
Small cities
(50k - 100k)
Declining but less
than urban average
E
Sumy Sumy 3 269177 FOUND Central
Mid size cities
(100k - 500k)
Declining more than
national average
C
Shchastia Luhansk 3 12773
DIS
APPEAR
Eastern
Mid size towns
(10k - 20k)
Declining more than
national average
C
Berdychiv Zhytomyr 3 78523 FOUND Central
Small cities
(50k - 100k)
Declining more than
national average
C
Mala Vyska Kirovohrad 3 11141
DIS
APPEAR
Central
Mid size towns
(10k - 20k)
Declining more than
national average
C
Slavuta
Khmelnyt
skyi
3 35625 FOUND Western
Large towns
(20k - 50k)
Positive growth E
Mariupol Donetsk 3 461810 FOUND Eastern
Major cities (
500k)
Declining but less
than national
average
E
Ovruch Zhytomyr 3 16614 FOUND Central
Mid size towns
(10k - 20k)
Declining but less
than urban average
E
Snihurivka Mykolaiv 3 13131
DIS
APPEAR
Southern
Mid size towns
(10k - 20k)
Declining more than
national average
C
Bilhorod-
Dnistrovskyi
Odessa 3 50246 FOUND Southern
Small cities
(50k - 100k)
Declining but less
than urban average
E
Khorostkiv Ternopil 3 7057
DIS
APPEAR
Western
Small Town
(10k)
Declining but less
than urban average
C
Orikhiv Zaporizhia 3 15281
DIS
APPEAR
Southern
Large towns
(20k - 50k)
Declining more than
national average
C
ANNEX V List of Ukrainian Cities
167
Ukraine_2015_nov26.indd 167 2015-11-26 5:14 PM
City Oblast
Typology
2
Population
2013
Typology
1
Region Size Population growth
Typology
3
Andrushivka Zhytomyr 3 9038
DIS
APPEAR
Central
Mid size towns
(10k - 20k)
Declining more than
national average
C
Novo
ukrainka
Kirovohrad 3 17741 FOUND Central
Large towns
(20k - 50k)
Declining more than
national average
C
Skadovsk Kherson 3 18940 FOUND Southern
Large towns
(20k - 50k)
Declining but less
than urban average
E
Borshchiv Ternopil 3 11222 FOUND Western
Mid size towns
(10k - 20k)
Declining but less
than urban average
E
Svatove Luhansk 3 18241
DIS
APPEAR
Eastern
Large towns
(20k - 50k)
Declining more than
national average
C
Uzhhorod Zakarpattia 3 116349 FOUND Western
Mid size cities
(100k - 500k)
Declining but less
than urban average
C
Nadvirna
Ivano-
Frankivsk
3 22209 FOUND Western
Large towns
(20k - 50k)
Positive growth E
Petrovske Luhansk 3 13260
DIS
APPEAR
Eastern
Mid size towns
(10k - 20k)
Declining more than
national average
C
Pereiaslav-
Khmelnyts
kyi
Kiev 3 27945 FOUND Central
Large towns
(20k - 50k)
Declining more than
national average
E
Persho
travensk
Dnipro
petrovsk
3 29019
DIS
APPEAR
Southern
Large towns
(20k - 50k)
Declining but less
than urban average
C
Novhorod-
Siverskyi
Cernihiv 3 13791
DIS
APPEAR
Central
Mid size towns
(10k - 20k)
Declining more than
national average
C
Mukachevo Zakarpattia 3 84992 FOUND Western
Small cities
(50k - 100k)
Positive growth E
Mospyne Donetsk 3 10806
DIS
APPEAR
Eastern
Mid size towns
(10k - 20k)
Declining more than
national average
C
Vosnessensk Mykolaiv 3 36613 FOUND Southern
Large towns
(20k - 50k)
Declining more than
national average
C
Zymohiria Luhansk 3 9949
DIS
APPEAR
Eastern
Mid size towns
(10k - 20k)
Declining more than
national average
C
Hirske Luhansk 3 10131
DIS
APPEAR
Eastern
Mid size towns
(10k - 20k)
Declining more than
national average
C
Talne Cherkasy 3 14216 FOUND Central
Mid size towns
(10k - 20k)
Declining more than
national average
E
Vasylivka Zaporizhia 3 13996
DIS
APPEAR
Southern
Mid size towns
(10k - 20k)
Declining more than
national average
C
ANNEX V List of Ukrainian Cities
168
Ukraine_2015_nov26.indd 168 2015-11-26 5:14 PM
City Oblast
Typology
2
Population
2013
Typology
1
Region Size Population growth
Typology
3
Tsiurupynsk Kherson 3 25112
DIS
APPEAR
Southern
Large towns
(20k - 50k)
Positive growth C
Svitlodarsk Donetsk 3 12164
DIS
APPEAR
Eastern
Mid size towns
(10k - 20k)
Declining more than
national average
C
Fastiv Kiev 3 48237 FOUND Central
Small cities
(50k - 100k)
Declining more than
national average
E
Hirnyk Donetsk 3 11641
DIS
APPEAR
Eastern
Mid size towns
(10k - 20k)
Declining more than
national average
C
Yahotyn Kiev 3 20445 FOUND Central
Large towns
(20k - 50k)
Declining more than
national average
C
Armiansk Crimea 3 22337 FOUND Southern
Large towns
(20k - 50k)
Declining more than
national average
E
Chervono
partyzansk
Luhansk 3 15659 FOUND Eastern
Large towns
(20k - 50k)
Declining more than
national average
E
Tokmak Zaporizhia 3 32996
DIS
APPEAR
Southern
Large towns
(20k - 50k)
Declining more than
national average
C
Bashtanka Mykolaiv 3 12680
DIS
APPEAR
Southern
Mid size towns
(10k - 20k)
Declining but less
than urban average
C
Shostka Sumy 3 79058 FOUND Central
Small cities
(50k - 100k)
Declining more than
national average
E
Liubotyn Charkiv 3 21909 FOUND Eastern
Large towns
(20k - 50k)
Declining more than
national average
E
Korostyshiv Zhytomyr 3 25817 FOUND Central
Large towns
(20k - 50k)
Declining but less
than urban average
E
Donetsk Donetsk 4 953217 FOUND Eastern
Major cities
( 500k)
Declining but less
than national
average
.
Zaporizhia Zaporizhia 4 770672 FOUND Southern
Major cities (
500k)
Declining but less
than national
average
.
Yasynuvata Donetsk 35836 FOUND Eastern
Large towns
(20k - 50k)
Declining but less
than urban average
.
Busk Lviv 8437 MISSED Western
Small Town
(10k)
Declining but less
than urban average
.
Artemove Donetsk 5598
DIS
APPEAR
Eastern
Small Town
(10k)
Declining more than
national average
.
ANNEX V List of Ukrainian Cities
169
Ukraine_2015_nov26.indd 169 2015-11-26 5:14 PM
City Oblast
Typology
2
Population
2013
Typology
1
Region Size Population growth
Typology
3
Artsyz Odessa 15178 MISSED Southern
Large towns
(20k - 50k)
Declining more than
national average
.
Novohro
divka
Donetsk 15398 MISSED Eastern
Mid size towns
(10k - 20k)
Declining more than
national average
.
Rudky Lviv 5434 MISSED Western
Small Town
(10k)
Positive growth .
Boryspil Kiev 59545 FOUND Central
Small cities
(50k - 100k)
Positive growth .
Peremy
shliany
Lviv 6874 MISSED Western
Small Town
(10k)
Declining more than
national average
.
Komarno Lviv 3842 MISSED Western
Small Town
(10k)
Declining but less
than urban average
.
Dovbysh Zhytomyr 4498 MISSED Central
Small Town
(10k)
Declining but less
than urban average
.
Marinka Donetsk 9913 FOUND Eastern
Mid size towns
(10k - 20k)
Declining more than
national average
.
Vynnyky Lviv 16278 FOUND Western
Mid size towns
(10k - 20k)
Positive growth .
Shcholkine Crimea 11184 MISSED Southern
Mid size towns
(10k - 20k)
Declining but less
than urban average
.
Brianka Luhansk 47512 FOUND Eastern
Small cities
(50k - 100k)
Declining more than
national average
.
Zastavna Cernivcy 8063 MISSED Western
Small Town
(10k)
Declining more than
national average
.
Oster Cernihiv 6339 MISSED Central
Small Town
(10k)
Declining more than
national average
.
Ustyluh Volhynia 2214 MISSED Western
Small Town
(10k)
Declining but less
than urban average
.
Illichivsk Odessa 59718 FOUND Southern
Small cities
(50k - 100k)
Positive growth .
Kamianka Cherkasy 12652 MISSED Central
Mid size towns
(10k - 20k)
Declining more than
national average
.
Pivdenne Charkiv 7818 FOUND Eastern
Small Town
(10k)
Declining more than
national average
.
Kremenets Ternopil 21729 MISSED Western
Large towns
(20k - 50k)
Declining but less
than urban average
.
ANNEX V List of Ukrainian Cities
170
Ukraine_2015_nov26.indd 170 2015-11-26 5:14 PM
City Oblast
Typology
2
Population
2013
Typology
1
Region Size Population growth
Typology
3
Baranivka Zhytomyr 11980 MISSED Central
Mid size towns
(10k - 20k)
Declining but less
than urban average
.
Bilozerske Donetsk 16101 MISSED Eastern
Large towns
(20k - 50k)
Declining more than
national average
.
Rzhyshchiv Kiev 7532 MISSED Central
Small Town
(10k)
Declining more than
national average
.
Bilohirsk Crimea 18220 MISSED Southern
Mid size towns
(10k - 20k)
Declining but less
than urban average
.
Bolhrad Odessa 15631 MISSED Southern
Mid size towns
(10k - 20k)
Declining more than
national average
.
Polonne Khmelnytskyi 21749 MISSED Western
Large towns
(20k - 50k)
Declining but less
than national
average
.
Huliaipole Zaporizhia 14358 MISSED Southern
Mid size towns
(10k - 20k)
Declining more than
national average
.
Inkerman Sevastopol 11985 FOUND Southern
Mid size towns
(10k - 20k)
Positive growth .
Hlyniany Lviv 3183 MISSED Western
Small Town
(10k)
Declining but less
than national
average
.
Zboriv Ternopil 6923 MISSED Western
Small Town
(10k)
Declining more than
national average
.
Pryvillia Luhansk 7747
DIS
APPEAR
Eastern
Mid size towns
(10k - 20k)
Declining more than
national average
.
Kirovsk Luhansk 28529
DIS
APPEAR
Eastern
Large towns
(20k - 50k)
Declining more than
national average
.
Zorynsk Luhansk 7331 MISSED Eastern
Small Town
(10k)
Declining more than
national average
.
Obukhiv Kiev 33102 FOUND Central
Large towns
(20k - 50k)
Positive growth .
Artemivsk L Luhansk 7506 FOUND Eastern
Mid size towns
(10k - 20k)
Declining more than
national average
.
Shumsk Ternopil 5404 MISSED Western
Small Town
(10k)
Positive growth .
Teplodar Odessa 10204 MISSED Southern
Small Town
(10k)
Positive growth .
ANNEX V List of Ukrainian Cities
171
Ukraine_2015_nov26.indd 171 2015-11-26 5:14 PM
City Oblast
Typology
2
Population
2013
Typology
1
Region Size Population growth
Typology
3
Vasylkiv Kiev 36672 FOUND Central
Large towns
(20k - 50k)
Declining more than
national average
.
Radomyshl Zhytomyr 14943 MISSED Central
Mid size towns
(10k - 20k)
Declining but less
than urban average
.
Dubrovytsia Rivne 9414 MISSED Western
Mid size towns
(10k - 20k)
Declining but less
than urban average
.
Lanivtsi Ternopil 8752 MISSED Western
Small Town
(10k)
Positive growth .
Pustomyty Lviv 9111 APPEAR Western
Small Town
(10k)
Declining more than
national average
.
Henichesk Kherson 20353 MISSED Southern
Large towns
(20k - 50k)
Declining more than
national average
.
Lysychansk Luhansk 104314 FOUND Eastern
Mid size cities
(100k - 500k)
Declining more than
national average
.
Skalat Ternopil 4018 MISSED Western
Small Town
(10k)
Declining but less
than urban average
.
Vashkivtsi Cernivcy 5406 MISSED Western
Small Town
(10k)
Declining more than
national average
.
Krasno
horivka
Donetsk 15937 FOUND Eastern
Mid size towns
(10k - 20k)
Declining but less
than urban average
.
Velyki Mosty Lviv 6121 MISSED Western
Small Town
(10k)
Positive growth .
Ochakiv Mykolaiv 14632 MISSED Southern
Mid size towns
(10k - 20k)
Declining more than
national average
.
Lypovets Vinnytsia 8727 MISSED Central
Small Town
(10k)
Declining more than
national average
.
Rodynske Donetsk 10698 FOUND Eastern
Mid size towns
(10k - 20k)
Declining more than
national average
.
Irmino Luhansk 10044 FOUND Eastern
Mid size towns
(10k - 20k)
Declining more than
national average
.
Borzna Cernihiv 10535 MISSED Central
Mid size towns
(10k - 20k)
Declining more than
national average
.
Yunokomu
narivsk
Donetsk 14154 FOUND Eastern
Large towns
(20k - 50k)
Declining more than
national average
.
Boiarka Kiev 35320 FOUND Central
Large towns
(20k - 50k)
Declining but less
than urban average
.
ANNEX V List of Ukrainian Cities
172
Ukraine_2015_nov26.indd 172 2015-11-26 5:14 PM
City Oblast
Typology
2
Population
2013
Typology
1
Region Size Population growth
Typology
3
Sukhodilsk Luhansk 21061 FOUND Eastern
Large towns
(20k - 50k)
Declining more than
national average
.
Sosnivka Lviv 11517 MISSED Western
Mid size towns
(10k - 20k)
Declining but less
than urban average
.
Korets Rivne 7388 MISSED Western
Small Town
(10k)
Declining more than
national average
.
Brovary Kiev 98250 FOUND Central
Small cities
(50k - 100k)
Positive growth .
Turka Lviv 7173 MISSED Western
Small Town
(10k)
Declining more than
national average
.
Khartsyzk Donetsk 59315 FOUND Eastern
Small cities
(50k - 100k)
Declining more than
national average
.
Sharhorod Vinnytsia 6975 MISSED Central
Mid size towns
(10k - 20k)
Declining but less
than urban average
.
Berezivka Odessa 9760 MISSED Southern
Mid size towns
(10k - 20k)
Positive growth .
Uzyn Kiev 12122 MISSED Central
Mid size towns
(10k - 20k)
Declining more than
national average
.
Monasty
ryska
Ternopil 6089 MISSED Western
Small Town
(10k)
Declining but less
than urban average
.
Balta Odessa 19211 MISSED Southern
Large towns
(20k - 50k)
Declining but less
than urban average
.
Storozhy
nets
Cernivcy 14473 MISSED Western
Mid size towns
(10k - 20k)
Declining but less
than urban average
.
Skole Lviv 6312 MISSED Western
Small Town
(10k)
Declining more than
national average
.
Vyshhorod Kiev 26536 FOUND Central
Large towns
(20k - 50k)
Positive growth .
Terebovlia Ternopil 13783 MISSED Western
Mid size towns
(10k - 20k)
Positive growth .
Stary Krym Crimea 9512 MISSED Southern
Small Town
(10k)
Declining but less
than national
average
.
Miusynsk Luhansk 4830 MISSED Eastern
Small Town
(10k)
Declining more than
national average
.
Belz Lviv 2343 MISSED Western
Small Town
(10k)
Declining but less
than urban average
.
ANNEX V List of Ukrainian Cities
173
Ukraine_2015_nov26.indd 173 2015-11-26 5:14 PM
City Oblast
Typology
2
Population
2013
Typology
1
Region Size Population growth
Typology
3
Ostroh Rivne 15725 MISSED Western
Mid size towns
(10k - 20k)
Positive growth .
Tavriysk Kherson 11001 FOUND Southern
Mid size towns
(10k - 20k)
Declining but less
than urban average
.
Ulianovka Kirovohrad 6109 MISSED Central
Mid size towns
(10k - 20k)
Declining more than
national average
.
Tysmeny
tsia
Ivano-
Frankivsk
9497 APPEAR Western
Small Town
(10k)
Declining but less
than urban average
.
Bylbasivka Donetsk 6310 FOUND Eastern
Small Town
(10k)
Declining more than
national average
.
Rakhiv Zakarpattia 15243 MISSED Western
Mid size towns
(10k - 20k)
Positive growth .
Zdolbuniv Rivne 24569 FOUND Western
Large towns
(20k - 50k)
Declining but less
than urban average
.
Pereshche
pyne
Dnipro
petrovsk
10178 MISSED Southern
Small Town
(10k)
Positive growth .
Prymorsk Zaporizhia 12208 MISSED Southern
Mid size towns
(10k - 20k)
Declining but less
than national
average
.
Monasty
ryshche
Cherkasy 9040 MISSED Central
Mid size towns
(10k - 20k)
Declining but less
than urban average
.
Vakhrusheve Luhansk 11878 MISSED Eastern
Mid size towns
(10k - 20k)
Declining more than
national average
.
Kodyma Odessa 8865 MISSED Southern
Mid size towns
(10k - 20k)
Declining more than
national average
.
Horodysche Cherkasy 14291 MISSED Central
Mid size towns
(10k - 20k)
Declining more than
national average
.
Kiliya Odessa 20606 MISSED Southern
Large towns
(20k - 50k)
Declining more than
national average
.
Hola Prystan Kherson 14870 MISSED Southern
Mid size towns
(10k - 20k)
Declining more than
national average
.
Zinkiv Poltava 9953 MISSED Central
Mid size towns
(10k - 20k)
Declining but less
than national
average
.
Dubliany Lviv 10240 FOUND Western
Small Town
(10k)
Positive growth .
Sudova
Vyshnia
Lviv 6461 MISSED Western
Small Town
(10k)
Declining but less
than urban average
.
ANNEX V List of Ukrainian Cities
174
Ukraine_2015_nov26.indd 174 2015-11-26 5:14 PM
City Oblast
Typology
2
Population
2013
Typology
1
Region Size Population growth
Typology
3
Nosivka Cernihiv 14077 MISSED Central
Mid size towns
(10k - 20k)
Declining more than
national average
.
Putyvl Sumy 16317 MISSED Central
Mid size towns
(10k - 20k)
Declining but less
than national
average
.
Novyi Kalyniv Lviv 4105 MISSED Western
Small Town
(10k)
Positive growth .
Irpin Kiev 42924 FOUND Central
Large towns
(20k - 50k)
Positive growth .
Rozhyshche Volhynia 13327 MISSED Western
Mid size towns
(10k - 20k)
Declining but less
than urban average
.
Dobromyl Lviv 4457 MISSED Western
Small Town
(10k)
Declining more than
national average
.
Perechyn Zakarpattia 6716 MISSED Western
Small Town
(10k)
Declining but less
than urban average
.
Zhashkiv Cherkasy 14234 MISSED Central
Mid size towns
(10k - 20k)
Declining more than
national average
.
Valky Charkiv 9410 MISSED Eastern
Mid size towns
(10k - 20k)
Declining more than
national average
.
Pervoma
iskyi
Charkiv 31061 FOUND Eastern
Large towns
(20k - 50k)
Declining but less
than urban average
.
Nova Odesa Mykolaiv 12298 MISSED Southern
Mid size towns
(10k - 20k)
Declining more than
national average
.
Novo
druzhesk
Luhansk 7749 FOUND Eastern
Mid size towns
(10k - 20k)
Declining more than
national average
.
Ananiv Odessa 8614 MISSED Southern
Mid size towns
(10k - 20k)
Declining more than
national average
.
Hlobyne Poltava 10043
DIS
APPEAR
Central
Mid size towns
(10k - 20k)
Declining more than
national average
.
Dolynska Kirovohrad 19420 FOUND Central
Mid size towns
(10k - 20k)
Positive growth .
Pohre
byshche
Vinnytsia 9898 MISSED Central
Mid size towns
(10k - 20k)
Declining more than
national average
.
Baturyn Cernihiv 2716 MISSED Central
Small Town
(10k)
Declining more than
national average
.
Ukrainka Kiev 15644 FOUND Central
Mid size towns
(10k - 20k)
Positive growth .
ANNEX V List of Ukrainian Cities
175
Ukraine_2015_nov26.indd 175 2015-11-26 5:14 PM
City Oblast
Typology
2
Population
2013
Typology
1
Region Size Population growth
Typology
3
Derhachi Charkiv 18154 FOUND Eastern
Large towns
(20k - 50k)
Declining more than
national average
.
Vyshneve Kiev 37457 FOUND Central
Large towns
(20k - 50k)
Positive growth .
Semenivka Cernihiv 8476 MISSED Central
Mid size towns
(10k - 20k)
Declining more than
national average
.
Bilytske Donetsk 8691 MISSED Eastern
Mid size towns
(10k - 20k)
Declining more than
national average
.
Tarashcha Kiev 11410 MISSED Central
Mid size towns
(10k - 20k)
Declining more than
national average
.
Irshava Zakarpattia 9221 MISSED Western
Small Town
(10k)
Declining but less
than urban average
.
Bohuslav Kiev 16825 MISSED Central
Mid size towns
(10k - 20k)
Declining but less
than urban average
.
Ichnia Cernihiv 11587 MISSED Central
Mid size towns
(10k - 20k)
Declining more than
national average
.
Seredyna-
Buda
Sumy 7231 MISSED Central
Small Town
(10k)
Declining but less
than urban average
.
Novoazovsk Donetsk 11760 MISSED Eastern
Mid size towns
(10k - 20k)
Declining more than
national average
.
Tetiiv Kiev 13329 MISSED Central
Mid size towns
(10k - 20k)
Declining more than
national average
.
Tatarbunary Odessa 10992 MISSED Southern
Mid size towns
(10k - 20k)
Positive growth .
Vyzhnytsia Cernivcy 4207 MISSED Western
Small Town
(10k)
Declining more than
national average
.
Stebnyk Lviv 20993 FOUND Western
Large towns
(20k - 50k)
Positive growth .
Berestechko Volhynia 1752 MISSED Western
Small Town
(10k)
Declining more than
national average
.
Rubizhne Luhansk 60374 FOUND Eastern
Small cities
(50k - 100k)
Declining more than
national average
.
Molochansk Zaporizhia 6980 MISSED Southern
Small Town
(10k)
Declining more than
national average
.
Makiivka Donetsk 353918 FOUND Eastern
Mid size cities
(100k - 500k)
Declining more than
national average
.
ANNEX V List of Ukrainian CitiesANNEX V List of Ukrainian Cities
176
Ukraine_2015_nov26.indd 176 2015-11-26 5:14 PM
City Oblast
Typology
2
Population
2013
Typology
1
Region Size Population growth
Typology
3
Beryslav Kherson 13187 MISSED Southern
Mid size towns
(10k - 20k)
Declining more than
national average
.
Pidhorodne
Dnipro
petrovsk
19498 FOUND Southern
Mid size towns
(10k - 20k)
Positive growth .
Yampil Vinnytsia 11300 MISSED Central
Mid size towns
(10k - 20k)
Declining but less
than urban average
.
Ukrainsk Donetsk 11994 MISSED Eastern
Mid size towns
(10k - 20k)
Declining more than
national average
.
Dymytrov Donetsk 49646 FOUND Eastern
Small cities
(50k - 100k)
Declining more than
national average
.
Merefa Charkiv 22280 FOUND Eastern
Large towns
(20k - 50k)
Declining more than
national average
.
Vuhlehirsk Donetsk 7868 FOUND Eastern
Mid size towns
(10k - 20k)
Declining more than
national average
.
Perevalsk Luhansk 25941 FOUND Eastern
Large towns
(20k - 50k)
Declining more than
national average
.
Bucha Kiev 28483 FOUND Central
Large towns
(20k - 50k)
Declining but less
than urban average
.
Shakhtarsk Donetsk 51007 FOUND Eastern
Small cities
(50k - 100k)
Declining more than
national average
.
Almazna Luhansk 4325 FOUND Eastern
Small Town
(10k)
Declining more than
national average
.
Pavlohrad
Dnipro
petrovsk
110070 FOUND Southern
Mid size cities
(100k - 500k)
Declining more than
national average
.
Novomyr
horod
Kirovohrad 11569 MISSED Central
Mid size towns
(10k - 20k)
Declining more than
national average
.
Uhniv Lviv 1007 MISSED Western
Small Town
(10k)
Declining but less
than urban average
.
Lozova Charkiv 58307 FOUND Eastern
Small cities
(50k - 100k)
Declining more than
national average
.
Sloviansk Donetsk 117445 FOUND Eastern
Mid size cities
(100k - 500k)
Declining but less
than national
average
.
Rohatyn
Ivano-
Frankivsk
8077 MISSED Western
Small Town
(10k)
Declining but less
than national
average
.
Illintsi Vinnytsia 11366 MISSED Central
Mid size towns
(10k - 20k)
Positive growth .
ANNEX V List of Ukrainian CitiesANNEX V List of Ukrainian Cities
177
Ukraine_2015_nov26.indd 177 2015-11-26 5:14 PM
City Oblast
Typology
2
Population
2013
Typology
1
Region Size Population growth
Typology
3
Vatutine Cherkasy 17563 FOUND Central
Large towns
(20k - 50k)
Declining more than
national average
.
Truskavets Lviv 29516 FOUND Western
Large towns
(20k - 50k)
Declining but less
than urban average
.
Chuhuiv Charkiv 32279 FOUND Eastern
Large towns
(20k - 50k)
Declining more than
national average
.
Awdijivka Donetsk 35128 FOUND Eastern
Large towns
(20k - 50k)
Declining but less
than urban average
.
Boryslav Lviv 34938 FOUND Western
Large towns
(20k - 50k)
Declining more than
national average
.
Zolote Luhansk 14572 MISSED Eastern
Large towns
(20k - 50k)
Declining more than
national average
.
Horodenka
Ivano-
Frankivsk
9386 MISSED Western
Mid size towns
(10k - 20k)
Declining but less
than urban average
.
Tiachiv Zakarpattia 9162 MISSED Western
Mid size towns
(10k - 20k)
Declining more than
national average
.
Halych
Ivano-
Frankivsk
6290 MISSED Western
Small Town
(10k)
Declining but less
than urban average
.
Bershad Vinnytsia 13160 MISSED Central
Mid size towns
(10k - 20k)
Declining but less
than urban average
.
Molodo
hvardiysk
Luhansk 23332
DIS
APPEAR
Eastern
Large towns
(20k - 50k)
Declining more than
national average
.
Pidhaitsi Ternopil 2866 MISSED Western
Small Town
(10k)
Declining more than
national average
.
Koriukivka Cernihiv 13161 MISSED Central
Mid size towns
(10k - 20k)
Declining more than
national average
.
Tlumach
Ivano-
Frankivsk
8829 MISSED Western
Small Town
(10k)
Declining but less
than urban average
.
Zhdanivka Donetsk 12352 FOUND Eastern
Mid size towns
(10k - 20k)
Declining more than
national average
.
Derazhnia Khmelnytskyi 10317 MISSED Western
Mid size towns
(10k - 20k)
Declining but less
than urban average
.
Vuhledar Donetsk 15357 MISSED Eastern
Mid size towns
(10k - 20k)
Declining more than
national average
.
Dobropillia Donetsk 31196 MISSED Eastern
Large towns
(20k - 50k)
Declining more than
national average
.
ANNEX V List of Ukrainian Cities
178
Ukraine_2015_nov26.indd 178 2015-11-26 5:14 PM
City Oblast
Typology
2
Population
2013
Typology
1
Region Size Population growth
Typology
3
Berezne Rivne 13444 MISSED Western
Mid size towns
(10k - 20k)
Declining but less
than urban average
.
Alupka Crimea 8520 MISSED Southern
Mid size towns
(10k - 20k)
Declining but less
than urban average
.
Hertsa Cernivcy 2122 MISSED Western
Small Town
(10k)
Positive growth .
Bibrka Lviv 3829 MISSED Western
Small Town
(10k)
Declining but less
than urban average
.
Kamianka-
Dniprovska
Zaporizhia 13495 MISSED Southern
Mid size towns
(10k - 20k)
Declining more than
national average
.
Yenakiieve Donetsk 82629 FOUND Eastern
Mid size cities
(100k - 500k)
Declining more than
national average
.
Oleksan
drivsk
Luhansk 6635 FOUND Eastern
Small Town
(10k)
Declining but less
than national
average
.
Tulchyn Vinnytsia 15849 MISSED Central
Mid size towns
(10k - 20k)
Declining but less
than urban average
.
Radyvyliv Rivne 10508 MISSED Western
Mid size towns
(10k - 20k)
Positive growth .
Kopychyntsi Ternopil 6890 MISSED Western
Small Town
(10k)
Declining but less
than urban average
.
Sviatohirsk Donetsk 4654
DIS
APPEAR
Eastern
Small Town
(10k)
Declining more than
national average
.
Chyhyryn Cherkasy 9371 MISSED Central
Mid size towns
(10k - 20k)
Declining more than
national average
.
Vylkove Odessa 8480 MISSED Southern
Mid size towns
(10k - 20k)
Declining more than
national average
.
Khyriv Lviv 4088 MISSED Western
Small Town
(10k)
Declining more than
national average
.
ANNEX V List of Ukrainian Cities
179
Ukraine_2015_nov26.indd 179 2015-11-26 5:14 PM
Annex VI
Extensive Growth
Extensive change refers to the change in brightness in the urban periphery. The periphery is usually defined as the area
surrounding the urban core that was not considered as urban by NL standards in the initial period but becomes “urban”
in T1. However, the periphery takes another interpretation when urban footprints are shrinking. In this case extensive
change is interpreted as the change in NLs in the disappearing footprint. The interpretation in this case, which is the
most common case in Ukraine, is not as straightforward as the interpretation of the other indicators used in the section,
and hence the analysis of extensive change was moved to this appendix. The following figure and equations explain the
way this indicator is calculated.
Figure 1 – Urban footprint, intensive and extensive change using NLs (1996-2010)
• Intensive change = Y – A
• Extensive change = (B – Y) – (Z – A)
• Area Change = B – A
• Area Change % = (B – A) / A
ANNEX VI Extensive Growth
180
CITY FOOTPRINT (1996 - 2010)
T0NTL
A
Z
T0footprint
T1footprint
The columns represent the summed
nighttime lights values for the
identified footprint
T1NTL
Y
B
Ukraine_2015_nov26.indd 180 2015-11-26 5:14 PM
The following figure compare intensive versus extensive change over the 1996-2010 period and using the same color
coding as the group types mentioned before (Group 1, 2  3).
Figure 2 – Intensive vs extensive change (without outliers)
ANNEX VI Extensive Growth
181
Ukraine_2015_nov26.indd 181 2015-11-26 5:14 PM
The following table extends the analysis in the text by dividing cities further based on whether they present positive or
negative extensive growth.
Growing urban footprint Shrinking urban footprint
- Extensive growth
Dimming periphery
+ Extensive growth
Growing light intensity in
periphery
- Extensive growth
Dimming shrinking
footprint
+ Extensive growth
Growing light intensity in
shrinking footprint
+ Intensive growth
Growing light intensity in
the urban core
Type 1:
Thriving urban core, expanding urban footprint
Thriving urban core, shrinking urban footprint
Growing economic
activity focused in
the core: increased
economic activity in
the urban center. The
new periphery, despite
increasing in area,
experienced a decline
in economic activity as
captured by night lights.
Examples: no examples in
Ukraine found
A. Growing economic
activity in the core and
periphery: the urban
footprint has expanded
and economic activity as
captured by night lights
has increased both in
the urban core and the
expanding periphery.
Examples: Odessa, Lutsk,
Kiev, Kharkov, Lviv.
Examples: no examples in
Ukraine found
F. Examples:
Donetsk,Zaporizhia
- Intensive growth
Declining light intensity
in the urban core
Type 3: Dimming core, expanding area Type 2: Dimming core, shrinking area
C. Declining economic
activities in the core
and periphery while
increasing urban
footprints: despite
a spreading out of
the urban footprint,
economic activity is
declining in the core
and in the new larger
periphery.
Examples: Mykolaiv,
Sumy, Kirovohrad.
E. Declining economic
activities in the core,
growing area with
stronger peripheries:
activity has been
transferred from the
core to the periphery.
Examples: Torez,
Borshchiv, Ostroh.
B. Declining in all
aspects: these cities
have decreased their
economic activity both in
the core in the shrinking
footprint.
Examples:
Dnepropetrovsk, Hirnyk,
Kramatorsk.
D. Activity shifted to
the periphery: activity
in the core has declined
but economic growth
has occurred in shrinking
footprint.
Examples: Donetsk,
Balta, Vuhledar.
Table 1 - Description of the different types that uses extensive growth
ANNEX VI Extensive Growth
182
Ukraine_2015_nov26.indd 182 2015-11-26 5:14 PM
152 Defined by urban NL measurements per capita.
Growing area Shrinking area
- Extensive growth + Extensive growth - Extensive growth + Extensive growth
+ Intensive growth
Type 1: Thriving core, expanding area
Mean (Std dev)
Thriving core, shrinking area
Mean (Std dev)
A F
Population 2013 (000s) 124.8 (363.2) 861 (129)
Average annual
Population growth
(‘89-’13)
124.8
(363.2)
-0.59%
(0.041)
Total NLs value
(000s of NLs units) in
2010. 148
9.40
(32.40)
69.11
(44.80)
Total NLs value
(000s of NLs units) per
cap (2010).
0.067
(.032)
0.077
(0.048)
NLs growth
(% Growth of NLs units)
(1996-2010)
587%
(22.46)
142.6%
(1.23)
- Intensive growth
Type 3: Dimming core, expanding area
Mean (Std dev)
Type 2: Dimming core, shrinking area
Mean (Std dev)
C E B
Population 2013 (000s) 76.3
(88.3)
50.8
(94.4)
79.2
(181.2)
152.3
(399.8)
Average annual
Population growth
(‘89-’13)
-0.57%
(.454)
-0.44%
(.566
-0.70%
(.614)
-0.69%
(.256)
Total NLs value
(000s of NLs units) in
2010.
6.16
(5.49)
3.23
(7.40)
4.50
(12.95)
10.41
(27.25)
Total NLs value
(000s of NLs units) per
cap (2010).
0.017
(.012)
0.053
(.030)
0.044
(.03)
0.055
(.065)
NLs growth
(% Growth of NLs units)
(1996-2010)
-7.7%
(.056)
39.4%
(.624)
-61.5 %
(.24)
-30.4%
(.20)
Table 2 – Typology of cities based on NL observations over 1996  2010: selected statistics
ANNEX VI Extensive Growth
183
Ukraine_2015_nov26.indd 183 2015-11-26 5:14 PM
By adding extensive growth to the previously used intensive growth and area change, the following five city typologies
emerge when
(A) THRIVING AND SPRAWLING153
CITIES, Growing economic activity in the core and periphery: the urban footprint
has expanded and economic activity as captured by night lights has increased both in the urban core and the expanding
periphery. These are mainly large cities (average population is 124.8k) and although – on average – they are still
experiencing demographic decline, their decline is the lowest compared to the other types. They present also the highest
levels of economic activity per capita suggesting that these cities are more productive. In addition, these cities have a
higher average total economic growth (587 percent) than the rest suggesting that these are true growth engines in the
country. However, the growth of the urban footprint accompanied by the observed demographic decline suggests that
these cities are sprawling. Examples of TYPE A are: Odessa, Lutsk, Kiev, Kharkov and Lviv. Around 24 percent of cities
in Ukraine fall under this type.
On the other side of the spectrum cities that are declining economically are found;
(B) ABSOLUTE DECLINE – COMPACT, These are cities declining in all aspects with a decreasing economic activity in
the core and periphery and shrinking footprint: These cities are smaller than thriving cities - the average population is
79.2k. In addition to experiencing a decline in economic activity, these cities have the fastest declining population – with
-0.70 percent annual decline on average and have lowers levels of productivity than thriving cities measured by NL per
capita. Examples of TYPE B are: Dnepropetrovsk, Hirnyk and Kramatorsk. Around 33 percent of cities in Ukraine fall
under this type.
(C) ABSOLUTE DECLINE AND SPRAWLING, These cities have experienced economic decline in the urban core and
periphery despite a growth of the urban footprint. These cities also present the lowest level of productivity and have
fast declining population – with -0.57 percent annual decline on average. The growth of the urban footprint accompanied
by the observed demographic decline suggests that these cities are sprawling. Examples of TYPE C are: Mykolaiv, Sumy,
Kirovohrad. Around 5.47 percent of cities in Ukraine fall under this type.
A third set of cities are those whose urban core has experienced economic decline that was partly compensated through
growth in expanding or shrinking areas;
(D) DECLINING CENTERS but INCREASED ACTIVITY IN SHRINKING AREA, These cities are experiencing a declining
in economic activity in the initial urban core and a shrinking urban footprint but increased economic activity in
shrinking footprint. These cities, although rare, have dying centers but economic activity has been catching up in the
shrinking footprint. Demographic decline is similar to the one observed in absolute declining cities but productivity –
measured as NL per capita – is higher. Examples of TYPE D are: Donetsk, Balta, Vuhledar. Around 2.84 cities in Ukraine
fall under this type.
(E) DECLINING CENTERS but INCREASED ACTIVITY IN GROWING URBAN FOOTPRINT, These cities have experienced
economic decline in the urban core but increased economic activity in the growing urban footprint. These cities,
although rare, have dying centers but growing economic activity in the periphery and present overall a positive economic
growth – on average. These cities are small – having on average 50.8k population – and have productivity levels similar to
those in TYPE D. Examples of TYPE E are: Torez, Borshchiv, Ostroh. Around 6.13 percent of cities in Ukraine fall under
this type.
153 Sprawling is a hypothesis based on the growth of the urban footprint and population decline. However the NL footprints do not correspond
to the city’s boundaries and therefore population data might not correspond to the population living inside the urban footprint defined through
NLs.
ANNEX VI Extensive Growth
184
Ukraine_2015_nov26.indd 184 2015-11-26 5:14 PM
(F)	 GROWING LIGHT INTENSITY IN SHRINKING FOOTPRINT. These cities have experienced economic growth
despite dimishing areas, which in both examples found also imply declining population. The only two cities found
in this category are Donetsk and Zaporizhia, which are an agglomeration in the Eastern region and a single city in the
Southern respectively.
In the same way most of the Thriving cities (A – in BLUE) are located in the Western and Central regions while most
of the absolute declining (B and C) settlements are located in the Southern and Eastern Region.
Figure 3 - Distribution of city typologies across economic regions
ANNEX VI Extensive Growth
185
100%
90%
80%
70%
60%
50%
40%
30%
20%
10%
0%
Western Central Southern Eastern
A - Thriving and sprawling
C - Absolute decline - sprawling
B - Absolute decline/compact
E - Declining centers increased activity in growing footprint
D - Declining centers increased activity in shrinking area
Ukraine_2015_nov26.indd 185 2015-11-26 5:14 PM
Annex VII
Assignment of Expenditure Responsibilities
in The Budget Code
Oblast District Sub-district Voluntary
Public administration Own staff Own staff Own staff Local debt
Defense none none none mobilization training of
local significance
Public order, safety
and judicial authority
none none none none
Economic affairs none none none local-significance roads;
transportation and road
infrastructure; regulation
of passenger fares; land
use regulation
Environmental
protection activity
none none none environmental protection
events of local
significance
Housing and
municipal economy
none none none local housing and utilities
development, populated
area improvement
Healthcare specialized care,
sanatoriums medical
and sanitary education
programs; other activity
in the health protection
system
Out-patients’ clinics, ambulance
departments, ambulance and first aid
stations; primary care, medical and
sanitary education programs
none none
Physical and
intellectual
development system
sports schools for children
and young people, physical
culture and sports-based
rehabilitation of the
disabled people, culture
and sports events, libraries,
museums and exhibitions,
philharmonic societies,
musical ensembles, theatres,
culture palaces and houses
sports schools for children and youth
of all types, physical culture and sports
events and organizations; cultural/
education and theatrical/show
programs (theatres, rayon (city), libraries
or centralized libraries of the centralized
rayon (city) library system, museums,
exhibitions, culture palaces and houses,
aesthetic education schools for children;
zoos
palaces and houses
of culture, clubs,
entertainment centers,
other clubs and libraries
community-owned zoos
ANNEX VII Assignment of Expenditure Responsibilities in The Budget Code
186
Ukraine_2015_nov26.indd 186 2015-11-26 5:14 PM
Oblast District Sub-district Voluntary
Education General secondary
education system for
individuals with special
needs; Vocational training
system; Higher education;
Postgraduate education
system; Out-of-school
education system and
establishments for non-
school activity of children;
Other establishments and
initiatives in the national
education system
Pre-school education system; General
secondary education system; continuing
education; Out-of-school education
system and establishments for non-
school activity of children; Other
establishments and initiatives in the
national education system
Pre-school education
system
extracurricular education
Social protection
and social security
system
fulfillment of allowances
and other entitlements
for disabled; fulfillment
of allowances and other
entitlements for orphans
disabled children social rehabilitation
centers; disabled people professional
rehabilitation centers, shelters for
children, the centers of the socio-
psychological rehabilitation of children
and social dormitories for orphan
children and children deprived of
parental care; implementation of the
state policy in respect of children, young
people, women and families assistance
to families with children, poor families,
people disabled since childhood, disabled
children, temporary state assistance
to children; additional payments to
the population for the coverage of the
utilities expenses (housing subsidies
for the population), support to the
housing construction (rehabilitation)
for certain categories of individuals;
compensations to individuals rendering
social services to senior citizens, the
disabled, disabled children, outpatients
unable to take care of themselves and
requiring outside assistance: benefits for
special categories of individuals
none social protection for
poor students of
vocational education
establishments; social
protection establishments
for homeless individuals;
utility rates subsidized
through local council
decision; centers of the
social adaptation of
individuals released from
penitentiary institutions;
reduced fares granted
to certain categories of
individuals
ANNEX VII Assignment of Expenditure Responsibilities in The Budget Code
187
Ukraine_2015_nov26.indd 187 2015-11-26 5:14 PM
Annex VIII
Summary of Urban  Spatial Planning Legislation
Law/Act with access
address and date of
approval
Core objectives
Elements relevant to urban planning
and spatial policy
Fundamental legislation
Civil Code #435-15,
16.01.2003
Regulates personal property and non-property
ownership rights and relationships among
different stakeholders on the basis of principles
of judicial equality, freedom of action and
independence of ownership. It does not cover
the aspects of ownership rights emerging
as a result of administrative subordination,
execution of power and budgetary relationships.
› Stipulates rights of private ownership, including
property, and measures to protect these rights.
› Provides legal basis for concluding and implementing
civil agreements (contracts), their enforcement and
procedures for restoring abused rights of ownership.
Land Code #2768-14,
25.10.2001
Regulates issues of land property and relations
among various stakeholders in managing,
transferring and owning the land resources of
Ukraine.
› Stipulates rights and responsibilities of central,
regional and local authorities in managing land
resources.
› In particular determines that the right to change
the borders of rayons and cities, as well as change the
status of the most valuable land resources belongs to
the parliament of Ukraine.
› Stipulates separately the rights and responsibilities of
each tier of territorial government in land management,
appropriation, sale, purchase and rent of state,
communal and private land plots.
› Stipulates nine different types of land plots depending
on the core use, including housing and communal
building, as well as the procedures for change of main
use.
Law on Local
Self‑Government
280/97-вр, 21.05.1997
Stipulates the system of self-government in
Ukraine, basic principles and guarantees of
self-government, its organisation and activities,
legal status and responsibilities of local self-
government institutions and personalities
› Defines the authorities and responsibilities of self-
government bodies, among others, in the sphere of
managing communal property, land ownership, land use
and management (including the right to setup the level
of land use tax), urban planning, construction, housing.
› Stipulates what territorial community is in the
territorial-administrative arrangement, what are its
rights, including land and property ownership, principles
of functioning of representative elected bodies and
individuals (councils and mayors), executive bodies of
the councils.
› Defines the rights to unite with other territorial
communities, create self-organised bodies by
community members, organise public hearings.
ANNEX VIII Summary of Urban  Spatial Planning Legislation
188
Ukraine_2015_nov26.indd 188 2015-11-26 5:14 PM
Law/Act with access
address and date of
approval
Core objectives
Elements relevant to urban planning
and spatial policy
Law on the
Fundamentals of State
Regional Policy #156-19,
05.02.2015
Stipulates legal, economic, social, environmental,
humanitarian and organisational fundamentals
of state regional policy as an integral element of
Ukraine’s domestic policy.
› Defines the principles of regional development,
which among other includes subsidiarity – transfer of
responsibilities to the lowest possible territorial level of
governance.
› Defines the role of local and regional self-government
bodies in formulation and implementation of regional
policy on their respective territories.
Sector-specific legislation
Law on Amendments to
Certain Laws of Ukraine
on Regulation of City
Building Activities and
State Construction and
Architectural Control
#1546, approved on
9.04.2015 but is still
awaiting President’s
signature (as of 10 April
2015)
Stipulates framework for decentralising
the authorities in the sphere of building,
architectural and construction activities, their
monitoring, control over compliance.
› Envisages transfer of responsibilities for (1) issuing
construction permits and land use permits; (2)
architectural and construction control; and (3) approval
of complete construction objects from oblast state
administrations to executive bodies of city, rayon and
village councils where respective land plots and buildings
are located (with some exceptions).
› Stipulates reduction of the number of days for
obtaining necessary technical documentation for
construction works.
› Removes the limitation to use only specialists
of scientific research and engineering institutions
accredited by the MinRegion for architecture and
construction control.
Law on Master Scheme
of Territorial Planning
of Ukraine #3059-14,
07.07.2002
Stipulates the terms and conditions of
use of the territory of Ukraine, responsible
authorities for developing General Scheme, its
implementation, monitoring and control.
Includes maps and text, which explains current
spatial organisation of economic, social and
environmental systems and presents priorities
for development until 2020.
› Outlines priorities and conceptual decisions about
planning and use of territory of Ukraine, including
improving the settlement system, development
of industrial, social, engineering and transport
infrastructure, creation of national environmental
network etc.
› Defines four types of territories in Ukraine, including
urbanisation zones, which require (strict) regulation of
construction and zoning.
ANNEX VIII Summary of Urban  Spatial Planning Legislation
189
Ukraine_2015_nov26.indd 189 2015-11-26 5:14 PM
Law/Act with access
address and date of
approval
Core objectives
Elements relevant to urban planning
and spatial policy
Law on Regulation
of City Construction
Activity #3038-17,
17.02.2011
Stipulates legal and organisational
fundamentals of city construction activities.
Ensures that these are congruent with the
objectives of sustainable development of
territories; with state, communal and private
interests.
› Defines terminology of city construction activities,
including master plan, detailed plans of territories,
zoning, suburban territories etc. Regulates procedures
for preparation of project documentation, ensuring
continuous oversight and control over construction
activities according to technical, architectural and land
use standards defined for each individual city by its self-
governing bodies.
› Stipulates that city planning and construction should
be aimed at creating rational system of settlement,
balanced use of territory that combines housing and
communal buildings, industrial, recreational, cultural,
and environmentally important and protected areas.
› Divides responsibilities among different tiers and
branches of power (see the most recent Law #1546
above).
› Requires obligatory publication of all planning
documentation, including online (with the exceptions of
secret and restricted information).
› Requires obligatory preparation of master plans for
ALL cities, settlements and villages of Ukraine, which
is the condition for taking any decisions in the area of
land ownership transfer and management.
Law on Architectural
Activity #687-14,
20.05.1999
Stipulates legal and organisational
fundamentals of architectural activities and
aimed at creating beneficial life environment,
achieving aesthetical distinctiveness, economic
expediency, reliability of buildings and
constructions.
› Defines standards and principles of architectural
activities towards all objects, including buildings and
constructions of all purposes and ownership types,
landscapes, specific areas and territorial-administrative
units.
› Defines standards and principles for preparing
necessary documentations and drawings, maintaining
high standards of technical, architectural and
engineering expertise, actual construction of the objects,
their acceptance, monitoring compliance with technical
and other standards, activities of self-regulated
professional organisations in the sphere etc.
ANNEX VIII Summary of Urban  Spatial Planning Legislation
190
Ukraine_2015_nov26.indd 190 2015-11-26 5:14 PM
Law/Act with access
address and date of
approval
Core objectives
Elements relevant to urban planning
and spatial policy
Law on Complex
Reconstruction
of Outdated
Housing Estates
(Neighbourhoods) #526-
16, 22.12.2006
Stipulates legal, economic, social and
organisational aspects of complex
reconstruction of outdated housing estates
(neighbourhoods) with the substitution of
dilapidated residential and non-residential
housing stock.
› Determines the notion of dilapidated residential
housing – with the amortisation level above 60%.
› Determines the procedures for guaranteeing property
rights in the process of complex reconstruction of
outdated and dilapidated housing stock requiring
resettlement of residents to temporary and/or
permanent new housing.
› Defines responsibilities of central government
institutions and local self-governments. The latter,
among others, is responsible for preparing complex
master plans of reconstruction of estates with
outdated housing, conduction competitive tenders
for selection of investor and construction company,
managing all relations with the residents of estates due
for reconstruction, including dispute resolution.
Law on Land Planning
#858-15, 22.05.2003
Stipulates legal and organisational
fundamentals of land management and
regulates relationships among state government
institutions, self-government, physical and
judicial persons aimed at achieving the
standards of sustainable land use.
› Defines priorities for land use and stipulates
responsibilities for central government and regional/
local self-governments to adhere to those, especially in
terms of prioritisation of protection of agrarian lands,
setting and monitoring environmental standards;
› Defines responsibilities for actual management of
land allocation for all types of owners across all types
of settlements, including cities.
Law on State Land
Cadastre #3613-17,
07.07.2011
Establishes State Land Cadastre as Ukraine’s
single GIS system that contains information
about all land plots regardless their ownership
and type of use.
› Defines the principles and procedures for registering
land plots of different types of ownership and land use;
as well as requirements for information for each land
plot that should be gathered, classified, presented in GIS
form and published with open access.
› Stipulates free public access to information in
Land Cadastre. It includes online access to the entire
database, which was launched in 2013 at the address
http://map.land.gov.ua/
ANNEX VIII Summary of Urban  Spatial Planning Legislation
191
Ukraine_2015_nov26.indd 191 2015-11-26 5:14 PM
Law/Act with access
address and date of
approval
Core objectives
Elements relevant to urban planning
and spatial policy
Relevant legislation in adjacent spheres
Law On Information,
#2657-XII, 02.10.1992
Regulates relationships for creating, collecting,
obtaining, storing, using, sharing, protecting and
securing information; stipulates core principles
and mechanisms of state information policy.
› Stipulates universal right on free access to
information, its use, sharing, storing, protecting and
securing, except when information is classified as
confidential, secret or for internal use only;
› Defines the obligation for all government agencies to
inform public and mass media about its activities and
decisions;
› Obliges government agencies to create special units
responsible for ensuring access to the information.
Law on Public Access to
Information #2939-VI,
13.01.2011
Introduces procedures for ensuring the
universal right for public access to information
produced by authorities at different tiers, as
well as by other providers of publicly significant
information.
› Stipulates obligations of state authorities to publish
information – proactively or reactively; as well as
mechanisms, timeframe and costs related to disclosure;
› Sets up clear limitations when information cannot
be disclosed and procedures for communicating these
limitations to the public;
› Defines procedure for substantiating the refusal to
release information in the public domain (three-stage
test).
Presidential Decree
on Provision of Public
Access to Information
by the Executive
Power agencies #547,
05.05.2011
Regulates public access to information produced
and administered by the executive power
authorities
› Stipulates forms and procedures, timeframe for
disclosing information in the public domain;
› Standards of dealing with information requests and
appeals for all executive power agencies.
Decree of the Cabinet
of Ministers on Ensuring
Public Participation
in Formulation and
Implementation of State
Policy #996, 03.11.2010
Established mechanisms for public participation
in developing, implementing and monitoring
state policies.
› Sets up typical procedure for establishing and
functioning of Public Councils, their responsibilities and
rights;
› Defines mechanisms for public consultations,
survey of public opinions, submitting proposals,
recommendations and complaints;
› Stipulates mechanisms for organising public hearings.
ANNEX VIII Summary of Urban  Spatial Planning Legislation
192
Ukraine_2015_nov26.indd 192 2015-11-26 5:14 PM
193
Ukraine_2015_nov26.indd 193 2015-11-26 5:14 PM
Annex IX
Summary of Planning Stakeholders
Legislative
Parliament has authority to develop and approve legislation governing all spheres.154
It has to vote on any decisions
with regard to local elections, status and responsibilities of different tiers of public administration and self-government,
changes in the borders of administrative units, including cities, budgetary allocation etc. Two committees of Verkhovna
Rada are responsible for developing and submitting legislation in the sphere of urban planning, spatial development and
housing. These are:
1. Committee for Construction, Urban Planning, and Communal Housing
2. Committee for State Construction, Regional Policy, and Local Self-Government
Executive – central level
Ministry of Regional Development, Construction and Housing (MinRegion) is responsible for developing and implementing
policies and regulations in the spheres of territorial-administrative organization and self-government, construction,
spatial planning, housing and communal services. It is led by the Minister who is at the same time Vice Prime Minister
of the Cabinet, with the responsibility of introducing e-government and development of territories of Ukraine affected
by the security crisis. MinRegion has a range of state agencies/services under its jurisdiction, among which the most
crucial are:
• State Architectural and Construction Inspection (SACI) which is responsible for implementing policy of state
architectural and construction control and oversight; issues permits for various types of planning and construction
works; issues licenses for professional market operators. Has 25 regional offices.
• State Service of Geodesy, Cartography and Cadastre (created as a result of merger of State Agency of Land
Resources and Cartography Agency in 2015) which is responsible for land management functions, evaluation of value
and technical characteristics of land plots, expertise and environmental protection, managing State Land Cadastre and
database of valid expert organisations and individuals with technical skills in land survey and management. It has 557
regional departments across all regions of Ukraine. Currently the State Service is in the process of changing all heads of
oblast and rayon offices as one of the steps aimed at reducing large-scale corruption.
Ministry of Economic Development and Trade is responsible for state regional policy and overall economic policy,
performs monitoring of the development of Ukrainian regions, as well as development of deprived territories (that include
monofunctional cities), provides administrative, organizational support and expertise in preparation of socio-economic
strategies for oblasts, ARC and cities of state significance. The Ministry is responsible for implementation of the State
Strategy for Regional Development 2020 (approved by the Cabinet in August 2014), which recognizes the importance of
the network of large cities for enhancing the competitiveness of national economy. It is also responsible, together with
MinRegion, for implementation of the Law on Fundamentals of State Regional Policy (February 2015).
Ministry of Culture is responsible, among other things, for developing and implementing policy in the area of protecting
national cultural heritage.
It includes Department for Protection of Cultural Architectural Heritage, that is crucial agency for agreeing and issuing
154 According to Ukrainian legislation, initiators/authors of the law could be both MPs and executive power – Cabinet of Ministers. All draft
legislator acts developed by executive agencies, for example MinRegion, have to be approved by the Cabinet of Ministers before submission to
the Verkhovna Rada.
ANNEX IX Summary of Planning Stakeholders
194
Ukraine_2015_nov26.indd 194 2015-11-26 5:14 PM
permits for construction and development activities in the areas with special cultural and historical status (e.g. UNESCO
site, architectural national reserve etc) and in adjacent areas.
Ministry of Ecology and Natural Resources of Ukraine is responsible, among other things, for developing and implementing
policy in the area of protecting environment, air, water, land resources including designating the land use and establishing
restriction in use of land and other resources.
Ministry of Infrastructure of Ukraine is responsible, among other things, for developing and implementing policy in the
area of development and maintenance of infrastructure, use of land and construction of buildings on land that belongs
to road and other infrastructural objects.
Legislative and executive power agencies – regional and local level
Oblast and rayon state administrations, including regional representative offices of national agencies and ministries,
such as Territorial Architectural and Construction Inspections (property, construction, planning), as well as oblast, city and
rayon departments of State Service of Geodesy, Cartography and Cadastre (land allocation, planning and management);
oblast departments of economic development. They are responsible for implementing national legislation and regulations
at oblast and rayon level, for ensuring oversight and monitoring over execution, providing a range of administrative
services in the areas of urban development, architecture, planning, land management etc.
Oblast and rayon councils are self-government bodies elected every 5 years. They are responsible for developing policies
at oblast and rayon tiers according to the authorities granted to them by the Constitution and the Law on Local Self-
Government, approving budgets, special programs and project of development, managing assets belonging to the oblast
and rayon community. They do not have their own executive committees and delegate ALL executive functions to state
administrations at oblast and rayon levels (see above).
City councils and their executive committees are legislative bodies at city level with their own executive bodies elected
every 5 years. City mayors are directly elected local politicians (with 5 years term of service) who are leading executive
committees of the councils. These bodies are responsible for developing and implementing local socio-economic and other
policies in the boundaries of their respective cities.
Other Organizations
Three state scientific and research institutes in the area of urban planning are responsible for preparing master plans
for oblasts, rayons and cities of Ukraine, zoning plans and detailed territory plans; providing expertise for monitoring and
oversight of their implementation as stipulated by specific national and local level regulations. These are:
1. Scientific Research Institute Dipromisto
2. Scientific Research Institute of City Construction
3. State Company “Ukrainian State Scientific Research and Planning Institute of Civil Construction”
City of Kyiv has its own communal enterprise Institute of Master Plan of Kyiv. It is responsible for development,
implementation and monitoring of execution of Kyiv Master Plan, as well as zoning plans and detailed plans of territories,
other urban planning documentation, planning of engineering infrastructure.
Association of Ukrainian Cities (AUC) is one of the most influential lobbying platforms in Ukraine that brings together
mayors of all major and medium-sized cities of Ukraine. It has special section for small cities and towns. AUC is traditionally
one of the strongest protagonists of functional and fiscal decentralization, strengthening the role and capacities of city
councils in developing and implementing effective policies.
Association of small cities of Ukraine is another lobbying platform that evolved from original Association of the heads
of villages and settlements. It unites mayors of cities of rayon significance with the headquarters in the city of Ukrainka
(Kyvska o blast).
ANNEX IX Summary of Planning Stakeholders
195
Ukraine_2015_nov26.indd 195 2015-11-26 5:14 PM
Eastern Ukrainian Centre of Community Initiatives is one of very few Ukrainian NGOs, which is specifically dealing with
the issues of transparency and public participation in the area of urban planning and spatial development. In particular
it is a very active lobbyist of the question of making 100% of master plans open for public.
ANNEX IX Summary of Planning Stakeholders
196
Ukraine_2015_nov26.indd 196 2015-11-26 5:14 PM

Ukraine: Urbanization Review

  • 1.
  • 2.
    Disclaimer: This volumeis a product of the staff of the International Bank for Reconstruction and Development/The World Bank. The findings, interpretations, and conclusions expressed in this paper do not necessarily reflect the views of the Executive Directors of The World Bank or the governments they represent. The World Bank does not guarantee the accuracy of the data included in this work. The boundaries, colors, denominations, and other information shown on any map in this work do not imply any judgment on the part of The World Bank concerning the legal status of any territory or the endorsement or acceptance of such boundaries. Copyright Statement: The material in this publication is copyrighted. Copying and/or transmitting portions or all of this work without permission may be a violation of applicable law. The International Bank for Reconstruction and Development/ The World Bank encourages dissemination of its work and will normally grant permission to reproduce portions of the work promptly. For permission to photocopy or reprint any part of this work, please send a request with complete information to the Copyright Clearance Center, Inc., 222 Rosewood Drive, Danvers, MA 01923, USA, telephone 978-750-8400, fax 978-750-4470, http://www.copyright.com/. All other queries on rights and licenses, including subsidiary rights, should be addressed to the Office of the Publisher, The World Bank, 1818 H Street NW, Washington, DC 20433, USA, fax 202-522-2422, e-mail pubrights@worldbank.org. UKRAINE iii This volume is a product of the staff of the International Bank for Reconstruction and Development/The World Bank. The findings, interpretations, and conclusions expressed in this paper do not necessarily reflect the views of the Executive Directors of The World Bank or the governments they represent. The World Bank does not guarantee the accuracy of the data included in this work. The boundaries, colors, denominations, and other information shown on any map in this work do not imply any judgment on the part of The World Bank concerning the legal status of any territory or the endorsement or acceptance of such boundaries. The material in this publication is copyrighted. Copying and/or transmitting portions or all of this work without permission may be a violation of applicable law. The International Bank for Reconstruction and Development/ The World Bank encourages dissemination of its work and will normally grant permission to reproduce portions of the work promptly. For permission to photocopy or reprint any part of this work, please send a request with complete information to the Copyright Clearance Center, Inc., 222 Rosewood Drive, Danvers, MA 01923, USA, telephone 978-750-8400, fax 978-750-4470, http://www.copyright.com/. All other queries on rights and licenses, including subsidiary rights, should be addressed to the Office of the Publisher, The World Bank, 1818 H Street NW, Washington, DC 20433, USA, fax 202-522-2422, e-mail pubrights@worldbank.org. © 2015 The International Bank for Reconstruction and Development / the World Bank 1818 H Street NW Washington DC 20433 Telephone: 202-473-1000 Internet: www.worldbank.org
  • 3.
  • 4.
    Table of Contents LISTOF ANNEXES vi LIST OF TABLES vi LIST OF BOXES vi LIST OF FIGURES vii LIST OF ACRONYMS x ACKNOWLEDGEMENTS xi INTRODUCTION xii EXECUTIVE SUMMARY xv CHAPTER 1 THE URBAN SYSTEM: DEMOGRAPHICS AND ECONOMIC TRENDS 1 I. Demographics 3 II. Urbanization and the Urban System 15 III. Regional Economic Trends 34 IV. Cities of Ukraine: Engines Of Economic Growth 51 CHAPTER 2 CITIES AND THE INTER-GOVERNMENTAL FISCAL SYSTEM 79 I. The Inter-Governmental System 81 II. Revenue Sources 88 III. Analysis of Expenditures 100 IV. Cities and the Fiscal System 108 CHAPTER 3 URBAN PLANNING AND THE SPATIAL DEVELOPMENT 113 I. Regulatory and Institutional Framework 115 II. Spatial Planning 118 III. Housing Market 125 IV. Planning as an Instrument for Managing City Growth And City Decline 130 CHAPTER 4 IMPACT OF THE CURRENT CONFLICT ON THE URBAN SYSTEM 135 ANNEXES141 v Ukraine_2015_nov26.indd 5 2015-11-26 5:14 PM
  • 5.
    List of Annexes ANNEXI. Special economic zones ANNEX II. Location quotient ANNEX III. Methodological annex using night-lights data as a proxy for economic activity ANNEX IV. Robustness of city typologies ANNEX V. List of Ukranian cities ANNEX VI. Extensive growth ANNEX VII. Assignment of expenditure responsibilities in the budget code ANNEX VIII. Summary of urban spatial planning legislation ANNEX IX. Summary of planning stakeholders List of Tables TABLE 1 Ukrainian diaspora by country of residence (ca. 2012) TABLE 2 Between 2010 and 2012, migrants came mainly from Ukraine’s Western region TABLE 3 Five largest urban centers in each region by population in 2013 TABLE 4 Ranking of Ukraine’s 15 largest cities by population TABLE 5 Ranking of Ukraine’s largest urban agglomerations TABLE 6 Ranking of the fastest growing cities in Ukraine TABLE 7 Growth of sector employment in regions and relation of that sector employment against the sector’s employment nationally using location quotients TABLE 8 Cities with the highest number of firms in 2000 and 2008 TABLE 9 Typology of cities based on NLS observations between 1996 and 2010: selected statistics TABLE 10 Ukraine’s agglomerations: merged night-light urban footprints TABLE 11 Top global increment of built-up last 40 years TABLE 12 Functional responsibilities TABLE 13 Own sources of local Government revenues TABLE 14 Utilization of local revenue instruments by cities as % of UAH per capita, 2013 TABLE 15 Age distribution of housing stock List of Boxes BOX 1 Mono-functional cities system BOX 2 Evolution of the Propiska system BOX 3 Definition of agglomeration using night lights satellite imaging BOX 4 Poverty in Ukraine BOX 5 The rise and fall of Ukraine’s coal industry vi Ukraine_2015_nov26.indd 6 2015-11-26 5:14 PM
  • 6.
    List of Figures FIGURE1 Ukraine’s population is declining faster than the ECA region average FIGURE 2 Aging is increasingly an urban issue in Ukraine FIGURE 3 Population dynamics flattened as the younger share of the population has decreased FIGURE 4 The urban population age mimics the flattening of the general population pyramids FIGURE 5 The decrease in younger population is less in the rural areas. These areas also show a decrease in the older cohorts of the population FIGURE 6 A sharp decline in fertility rates is leading to an important reduction of the young cohort FIGURE 7 Ukraine is aging more dramatically than neighboring countries FIGURE 8 The birth rate has recovered since 2001, but remains very low. fertility rates follow similar trends, remaining under replacement levels at least since 1990 FIGURE 9 Ukraine’s eastern region has the highest rate of overall population decline FIGURE 10 The eastern region has the highest overal decline in population in urban areas FIGURE 11 The average age is increasing in all urban areas FIGURE 12 Migration is increasingly a factor in ukraine’s population decline FIGURE 13 Labor migration rate by regions FIGURE 14 Both urban and rural populations declined between 1989 and 2011; yet the country continues to urbanize FIGURE 15 There are strong differences among urbanization levels across the regions FIGURE 16 Population dynamics are heterogeneous across ukraine’s regions. in all cases, however, population declines yield increased urbanization rates FIGURE 17 Distribution of cities across Ukraine FIGURE 18 Ukraine has a high percentage of small and mid-sized towns - 2013 FIGURE 19 Most of the urban population is concentrated in eight major cities - 2013 FIGURE 20 The western region has the greatest number of small towns. also, its urban population lives mostly in mid- sized cities (100-500k) FIGURE 21 All categories of cities in Ukraine are losing population FIGURE 22 Ukrainian cities with growing or declining population 2001-2013 FIGURE 23 Real GDP decreased sharply after Ukraine’s departure from the Soviet Union (1991-1998) and experienced a slow recovery lasting until the recent conflict (1999-2012) FIGURE 24 GDP per capita grew steadily from 1998 until the global financial crisis BOX 6 Location quotient estimates of sector employment in the regions BOX 7 A first typology of Ukraine’s cities BOX 8 A second typology of Ukraine’s cities BOX 9 Types of urban/spatial plans in Ukraine BOX 10 Kyiv 2025 city development strategy BOX 11 Detroit (USA) master plan BOX 12 Disconnect between reality and plan BOX 13 National level spatial policy: Stadtumbau Ost and West (Germany) vii Ukraine_2015_nov26.indd 7 2015-11-26 5:14 PM
  • 7.
    FIGURE 25 EBRDtransition INDEX (2012) FIGURE 26 GVA shares: the service and finance sectors now lead Ukraine’s economy, but the industrial sector still occupies a prominent place FIGURE 27 The change in the share of employment by sector between 2001 and 2008 in percentage points against sectoral productivity in 2001. the economy’s average productivity rate is provided for comparison FIGURE 28 GDP per person employed in countries of the former Soviet Union 2001 FIGURE 29 Trend of GDP per person employed in Ukraine FIGURE 30 Remittances to Ukraine by expatriates, 2001-2013 FIGURE 31 GVA shares: the Eastern and Southern regions remain more industrial in nature, while the central region is predominent in trade, services and the financial sector FIGURE 32 Sectoral employment in the Western region by location quotient FIGURE 33 Sectoral employment in the Central region by location quotient FIGURE 34 Sectoral employment in the Eastern region by location quotient FIGURE 35 Sectoral employment in the Southern region by location quotient FIGURE 36 Ukraine’s urban GVA (upper graph) is much greater than its rural GVA (lower) FIGURE 37 Urban-rural GVA ratios are much greater than urban-rural population ratios, indicating much higher productivity in the urban sector FIGURE 38 The performance of firms based on firm, city, and industry characteristics FIGURE 39 There is a strong positive correlation between urban GDP and night lights FIGURE 40 NIght lights and urban footprints in Ukraine 1996 and 2010 FIGURE 41 Compound growth/decline in NLS in Ukraine between 1996 and 2010 FIGURE 42 Urban GVA production at the oblast level FIGURE 43 Urbanization shows steady growth mainly in the Central and Western regions FIGURE 44 Real GVA growth per worker shows strongest increase in the Western region FIGURE 45 Distribution of found, appear, disappear, and missed cities by population in 2013 FIGURE 46 Distribution of missed cities by population in 2013 FIGURE 47 Distribution of found, appear, disappear, and missed cities by geographic location FIGURE 48 Distribution of found, appear, disappear, and missed cities FIGURE 49 Changes in NLS urban footprint vs. changes in NLS intensity in the urban core FIGURE 50 The distribution of city sizes varies across types in the second typology; type 1 cities are overall larger FIGURE 51 The distribution of cities by economic growth varies across types in the second typology; type 1 cities have more cities with positive growth FIGURE 52 The distribution of cities by economic growth varies across types in the second typology; type 1 cities have more cities with positive growth FIGURE 53 Intensity of night lights has a strong relationship to population dynamics FIGURE 54 The distribution of types of cities varies by region; the western region has the majority of thriving (type 1) cities FIGURE 55 Kyiv’s agglomeration 1996-2010 FIGURE 56 Distribution of agglomerations and individual cities by city type; agglomerations are disproportionately thriving (type 1) FIGURE 57 Ukraine is 4th in absolute number of new built-up areas over the last 15 years FIGURE 58 Prosperity is not pushing the massive addition of built-up areas in Ukraine viii Ukraine_2015_nov26.indd 8 2015-11-26 5:14 PM
  • 8.
    FIGURE 59 Sub-nationalgovernments account for almost half of public expenditures FIGURE 60 Sub-national expenditures are dominated by the three social sectors FIGURE 61 Composition of sub-national revenues, 2005-2012 FIGURE 62 Decentralization of social services is associated with transfer dependence FIGURE 63 Type of city revenues and % of total provided by different tiers of government, 2013 FIGURE 64 Composition of city revenues by night light type as % of total, 2013 FIGURE 65 Composition of city revenues by population size as % of total, 2013 FIGURE 66 Composition of city revenues as % of total relative to population decline, 2013 FIGURE 67 Utilization of local revenue instruments by cities, uah per capita, 2013 FIGURE 68 Utilization of local revenue instruments by city night light typology, UAH per capita, 2013 FIGURE 69 Utilization of local revenue instruments by city population size, in UAH per capita, 2013 FIGURE 70 Per capita revenue from own taxes and the night light typology of sub-oblast cities, in UAH, 2013 FIGURE 71 Per capita revenue from own taxes and population decline of sub-oblast cities, in UAH 2013 FIGURE 72 Composition of inter-governmental transfers to cities by type, 2013 FIGURE 73 Composition of inter-governmental transfers to cities by population trend, 2013 FIGURE 74 Composition of inter-governmental transfers to cities by population size, 2013 FIGURE 75 Functional composition of city expenditures by sub-type, 2013 FIGURE 76 Per capita expenditures on social sectors by night light category in sub-oblast cities, in UAH, 2013 FIGURE 77 Average per capita expenditures by function and city population size, 2013 FIGURE 78 Per capita expenditures by function and population trend, 2013 FIGURE 79 Per capita expenditures on social sectors by population decline in sub-oblast cities, in UAH, 2013 FIGURE 80 Economic composition of city expenditures by city typology, 2013 FIGURE 81 Economic composition of city expenditures by city population size, 2013 FIGURE 82 Economies of scale by economic item, 2013 FIGURE 83 Economic composition of city expenditures by population trend, 2013 FIGURE 84 Composition of capital expenditures by function and city typology, 2013 FIGURE 85 Per capita capital expenditures by function and population size, 2013 FIGURE 86 Per capita capital expenditures by function and population trend, 2013 FIGURE 87 Hierarchy of spatial plans produced by dipromisto FIGURE 88 Dwelling stock by Tenure status 2000-2009 FIGURE 89 Dwelling stock by country FIGURE 90 Level of mortgage penetration FIGURE 91 House price to income ratio FIGURE 92 Conflict and displacement in Eastern Ukraine (as of February 2015) ix Ukraine_2015_nov26.indd 9 2015-11-26 5:14 PM
  • 9.
    List of Acronyms CDS City Development Strategy CIS Commonwealth of Independent States CIT Corporate Income Tax DN Digital Number EBRD European Bank for Reconstruction and Development ECA Europe and Central Asia Region EU European Union FAOSTAT Food and Agriculture Organization of the United Nations Statistics Division FDI Foreign Direct Investment FSU Former Soviet Union GAWC Globalization and World Cities (Research Network) GDP Gross Domestic Product GHSL Global Human Settlement Layer GIS Geographic Information System GVA Gross Value Added ICT Information and Communications Technology ILO International Labor Organization IMF International Monetary Fund KM Kilometer MGI McKinsey Global Institute NLs Night lights OECD Organisation for Economic Co-operation and Development PIT Personal Income Tax PPP Purchasing Power Parity RPA Recovery and Peacebuilding Assessment SAR Special Administrative Region SME Small and Medium Enterprises SNG Sub-national Public Expenditures UAH Ukrainian Hryvnya UN United Nations UUR Ukrainian Urbanization Review USD United States Dollar USSR Union of Soviet Socialist Republics WDR World Development Report (World Bank) WWII World War II x Ukraine_2015_nov26.indd 10 2015-11-26 5:14 PM
  • 10.
    Acknowledgements The Ukraine UrbanizationReview was prepared under the Multi-Donor Trust Fund for Sustainable Urban Development, which funds the World Bank’s urbanization reviews for all countries of the globe. It was initiated before the onset of the current conflict in Eastern Ukraine and prior to the referenda held in the Autonomous Republic of Crimea and the city of Sevastopol on 16 March 2014. The report uses historical data sets ranging between 1989 and 2013, as well as historical maps; further, the report does not intend to make any judgment as to the legal or other status of any disputed territories or prejudice the final determination of the parties’ claims. The study was developed under the guidance of Qimiao Fan and Sumila Gulyani. It benefitted from guidance and direction provided by Peter Ellis, Christine Kessides, and Judy Baker. The team that developed Chapter 1 was led by Paula Restrepo Cadavid and included Luis Eduardo Quintero, Benjamin Stewart (GIS analysis), Katie McWilliams (GIS analysis and maps), and Sofia Zhukova. Chapter 2 was prepared by Andrey Timofeev and Iryna Shcherbyna, and inputs from Sebastian Eckardt. Chapter 3 was prepared by Brent Ryan, Yarissa Lyngdoh Sommer, Olga Mrinska, Kate Owens, and Mariana Kuchlevska. Copyediting was provided by Will Ferroggiaro and graphic design additions by George Maier. The overall work on the Ukraine Urbanization Review was led by Kremena Ionkova and Tamara Sulukhia. The team has benefitted tremendously from guidance and comments provided by Mark Roberts, Denyz Nizalov, Olga Mrinska, and Klavdiya Maksymenko. xi Ukraine_2015_nov26.indd 11 2015-11-26 5:14 PM
  • 11.
    1 Eurasian Cities: NewRealities along the Silk Road, World Bank (2012). Objectives, Audience and Limitations The present report is a diagnostic Economic and Sector Work (ESW) on the urban landscape in Ukraine. Its objective is to link population dynamics with economic dynamics, and to present emerging spatial characteristics and trends. Ukraine has experienced a dramatic population decline over the past two decades, which impacts the urban system. This ESW seeks to elicit a policy dialogue on opportunities to enhance efficiency through dedicated urban planning and fiscal instruments. The intended primary audience is the Government of Ukraine, including city mayors and city managers; international partners; and other stakeholders engaged in the area of urban development. The Ukraine Urbanization Review (UUR) was initiated before the onset of the current conflict in Eastern Ukraine and prior to the referenda held in the Autonomous Republic of Crimea and the city of Sevastopol on 16 March 2014. The report uses historical data sets ranging between 1989 and 2013 as well as historical maps. Consequently, events related to the current conflict are not a part of the present analysis, although they are recognized in the concluding chapter of this report. This stems from the lack of recent, reliable data from the conflict areas as well as the continuously evolving and changing characteristics of the conflict. Despite this limitation, the UUR remains relevant and opportune in its findings on trends, challenges, and opportunities for the urban system in Ukraine. Report Organization The UUR is organized into three main Chapters and a concluding Chapter. Chapter 1 outlines recent demographic changes, presents the urban system and its economic characteristics, and develops city typologies based on their economic, spatial and demographic patterns. Chapter 2 offers an analysis of sub-national finance arrangements and examines tiers of government and the city typologies developed in Chapter 1 for discrepancies that could be explored to enhance efficiency in spending. Chapter 3 discusses current urban and spatial planning practices and outlines shortcomings in view of changing demographics. The concluding Chapter touches on the impact of the current conflict on the urban space and system. For clarity, the section immediately below describes the territorial administrative division of Ukraine as it is used throughout this report. Territorial-Administrative System of Ukraine Ukraine has inherited its territorial-administrative system from the Ukrainian Soviet Socialist Republic and it has not changed significantly since the 1950-60s when it was formed. Each of the 15 Soviet republics, depending on their territory and population, was divided into several sub-regional tiers of administration1 . The larger republics— including the Russian Federation and Ukraine—had three territorial-administrative tiers. According to Ukraine’s constitution, the territorial–administrative system is as set forth below, Introduction xii Ukraine_2015_nov26.indd 12 2015-11-26 5:14 PM
  • 12.
    24 oblasts, 1Autonomous Republic of Crimea and 2 cities of state significance – Kyiv and Sevastopol (until 2013) 24 oblasts have elected councils, however they do not have own executive committees and all executive functions are delegated to oblast state administrations – representative body of the central government. Most of Ukraine’s oblasts are named after their respective administrative centers. Cities of Kyiv and Sevastopol had (until 2013) special status and are regulated by separate laws. Cities have councils with executive committee, which at the same time performs functions of the regional representative of central government (city state administration). Kyiv as well as being a separate territorial- administrative unit serves as the administrative center for Kyiv oblast. 490 raions and 182 cities of oblast significance, which have equal status within oblast Both raions and cities have their elected councils. However only cities of oblast significance have their own executive committees, which are responsible for implementation of municipal policies in the framework of their own powers. Raion councils do not have executive committees and delegate all their executive functions to raion state administrations, similar to oblast councils. In addition to 490 raions there are 111 municipal raions (districts) in larger cities of state and oblast significance. At the moment only 55 municipal raions have their own councils but all of them have raion state administrations. For example in Kyiv in 2010 ten raion councils were abolished by the decision of city council and approval of the parliament, and raion state administrations were left to manage raions’ development. Also some cities might have separate settlements and villages within their geographical boundaries, which have a separate administrative structures (councils). The oblast significance status is usually granted to a city, which is an economic, administrative and cultural center. Each oblast has at least one city of oblast significance as its administrative center. cities of raion significance, urban and rural settlements, and villages (united into communities). Urban populated places can be either cities or urban settlements, while rural populated places can be either villages or rural settlements. There are no state administrations below raion level and all basic tier territories are governed by their elected councils and executive committees. Central Government Autonomous Republic of Crimea (until 2013) 276 cities of raion significance and 28,388 villages and settlements formed in 10,279 village and settlement councils 24 oblasts 490 raions Cities with special status: KyivSevastopol (until 2013) 182 cities of oblast significance (including 111 municipal districts) TIER 1 TIER 2 TIER 3 Introduction xiii Ukraine_2015_nov26.indd 13 2015-11-26 5:14 PM
  • 13.
    The total of458 cities of state, oblast and raion significance is considered for the analysis presented in this Urbanization Review Macroregions of Ukraine Source: Kiev Institute Of Sociology (2013) Introduction Luts’k Rivne Lvyv Uzhhorod Ivano-Frankivs’k Chernivtsi Ternopil Khmelnytskyi Vinnytsya Zhytomyr Kyiv Chernihiv Sumy Poltava Cherkasy Kirovorad Mykolayiv Odesa Zaporizhzhya Kherson Simferopol Sevastopol Kharkiv Luhans’k Donets’k East West Center South Dnepropetrovsk These are 2 cities of state significance, 182 cities of oblast significance (both types administered by their own councils and executive committees) and 276 cities of raion significance that have their own councils and executive committees however are more dependent on oblast state administrations. In addition, there are two cities, Chernobyl and Pripyat that were abandoned after accident at Chernobyl nuclear power station in 1986 due to unsafe levels of radiation. Although they officially have the administrative status of a city, they are not considered in the current analysis as they do not have any population or economic activities and in practice are administered directly by the central government. Due to the scale of the territory and population Ukraine is sometimes divided into macroregions and mesoregions – groups of oblasts – that are used for the planning, economic, social, political and other purposes. For example, in USSR era Ukraine officially had three economic macroregions, which were used for spatial planning of industrial development, infrastructure, agriculture and system of settlements. This system was effective for large-scale planning however not suitable for Ukraine when it became an independent state, as the scale of mobilization of resources and population has downshifted. Ukrainian researchers have been proposing different systems of socio-economic macroregions and mesoregions since the beginning of XX century, which would correspond to the spatial structure of Ukraine and would better reflect the potential of each territory. In order to combine the different oblasts of the country and in order to facilitate the analysis of economic and demographic trends across the Ukraine territory macroregions have been identified in Ukraine. The model of regionalization used for this Review has been developed by Kiel Institute of Sociology. In this model Ukraine is divided into four macroregions: West, East, South and Central, as shown in the figure below. These macroregions do not have any legal or administrative significance in Ukraine’s territorial-administrative system. xiv Ukraine_2015_nov26.indd 14 2015-11-26 5:14 PM
  • 14.
    Executive Summary The UKRAINEURBANIZATION REVIEW is a DIAGNOSTIC REPORT on the URBAN LANDSCAPE, linking population dynamics with economic dynamics and presenting emerging spatial characteristics and trends. It was initiated before the onset of the current conflict in Eastern Ukraine and uses historical data sets ranging from 1989 to 2013. Consequently, events related to the current conflict are not part of the present analysis, although they are addressed in the concluding chapter. The Ukraine Urbanization Review is limited to data analytics rather than discussion of policy options and recommendations. Still, it outlines areas and implication for further policy work as well as areas that require further analysis. The CENTRAL FINDING of this report is that, over the past two decades (prior to the conflict), demographic profiles and economic activities in Ukraine have been changing in a manner that has not been uniform across the territory. Meanwhile, urban public policy remained stagnant. Inter-governmental fiscal relationships as well as urban and spatial planning, two key public policy tools, continue the legacy of the past and have yet to be fully utilized in supporting economic growth and managing decline across the urban space. The key findings of the report are further summarized below. xv Ukraine_2015_nov26.indd 15 2015-11-26 5:14 PM
  • 15.
    2 In providing aregional overview of the country, this document uses the description of four geographic regions developed by the Kiev International Institute of Sociology: East, Center, South and West. Shifting Economic Geography: from East to West 2 Over the past two decades, Ukraine’s population has been declining and aging, but not uniformly among regions. The sharp decline in population (13 percent nationally over two decades) is linked to an overall aging trend, a significant decline in fertility (below replacement levels since 1990), and, in part, out-migration. While population is declining across the territory, the demographic transition has not been uniform across the regions. There is significant variation – the Eastern Region has seen a sharper decline over the past two decades, while in the West the population decline has been lower and a few cities, including Kyiv, continue to grow. At the same time, although the urban population is increasingly aging across all regions, the Eastern Region is losing its youngest population at a faster rate.. Similarly, economic activity has been shifting within and across regions. This is confirmed by analyzing trends in regional Gross Value Added (GVA), firm-level and employment locational data, and night-lights data (NLs – used to analyze the dynamics of economic growth). Although the Eastern Region continues to play an important role in the economy, the Western and Central regions have been much more dynamic. This is partly explained by a combination of lower initial levels of economic activity in the West – compared to the East – and a faster transformation of the West from agriculture to more productive sectors. The Eastern Region is also less productive than its urbanization level would suggest. The shift can be observed clearly in the figure below, which compares night-lights data emissions between 1996 and 2010. The red- and orange-colored areas are those that have experienced the highest growth in night-lights (proxy for economic activity), while the blue areas are those with the lowest growth levels. Compound Growth Rate, 1996-2010 Executive Summary xvi Ukraine_2015_nov26.indd 16 2015-11-26 5:14 PM
  • 16.
    In terms ofstructural transformation, Ukraine’s economy has moved slowly from an industrial enterprise-centered economy to a services-centered economy, with a finance sector at the forefront of this change. Services have grown significantly in a number of areas, including retail, property, and information and communications technology. Here too, progress has not occurred uniformly across the regions. Industry remains very important in the Southern and Eastern regions, while the Western Region has seen a slow increase in the importance of services as the agriculture sector’s dominance wanes. Finance’s share of national GVA has nearly doubled, but its share of the labor market is still minor and cannot be expected to replace jobs in traditional sectors. In the strict sense of the term, Ukraine continues to urbanize despite an overall decline in its urban population (as rural population has declined even faster). The Eastern and Southern regions, which at the time of the fall of the Soviet Union were already highly urbanized, have shown slower urbanization rates in the last two decades, while the historically rural Western Region and to a lesser extent the Central Region experienced higher urbanization rates. The rural population has migrated to urban areas at greater rates in the Western and Central regions, resulting in greater relative growth of urban production in the West. More than 80 percent of the cities have experienced population decline, but shrinking cities are disproportionally concentrated in the East and growing ones are disproportionally concentrated in the West. An analysis of the evolution of cities reveals that the Eastern Region has the highest number of cities that in 1996 met the threshold to be classified as cities (in terms of the amount of night-light emitted), but had “disappeared” (i.e. were no longer classified as such) by 2010. By contrast, the Western Region has the highest number of “appeared” cities, i.e., cities that could not be classified as cities by night-lights standards in 1996, but passed the night-light threshold in 2010. A similar “disappeared-appeared” correlation with these regions is found when comparing population trends at the city-level between 1989 and 2013. A large number of agglomerations are concentrated in the East; however, the agglomerations in the West and the Kiev agglomeration are more dynamic. Only one city in the Western Region is ranked among the fifteen largest individual cities. However, five agglomerations among the fifteen largest are located in this region, as well as four of the fastest- growing cities. This suggests that, despite having the lowest urbanization levels, the cities in this region are taking advantage of the economies generated by their agglomeration into large-scale urban regions. By contrast, the Eastern Region has five cities among the largest fifteen individual cities, but has none of the fastest-growing cities. Finally, the agglomeration patterns are much more concentrated in the Central Region, led by Kyiv’s agglomeration. The figure below plots the location of Ukraine’s cities and agglomerations (agglomerations are labeled with the name of the main city in them) with colors assigned according to their population growth rate. Again, this graph shows a strongly declining Eastern Region, despite the fact it contains a large number of agglomerations. The West, by contrast, shows a higher concentration of growing cities as well as cities that are at least declining less than the urban population and national population. The significance of Kyiv’s agglomeration and its pattern of growth are noticeable. Moving to Opportunity: Push and Pull factors Observed economic geography shifts might have been even stronger if internal mobility was less constrained. Migration studies reveal that few people in Ukraine are moving to opportunities. Migration to and between urban areas is typically an indication that people are looking for better labor opportunities, and is a sign of an efficient re-organization of human resources within a country (pull factors). In Ukraine, however, studies indicate that few people are moving to seek new economic opportunities. Instead, their movement seems to be catalyzed by low levels of social spending in their home regions (push factors). Key barriers to internal migration include very high housing ownership rates and an underdeveloped rental market, the lack of access to credit and underdevelopment of the housing and mortgage market, the costs of moving to economically vibrant regions of the country, and high transaction costs. Nevertheless, agglomerations have been forming slowly. Executive Summary xvii Ukraine_2015_nov26.indd 17 2015-11-26 5:14 PM
  • 17.
    Percent Change inPopulation, 2001-2013 Percent Change by city Declining more than national average (less than -6.3%) Declining less than national average (-6.3 to -5.7%) Declining less than urban average (-5.7 to 0%) Growing Cities Agglomerations: Engines of Economic Growth Ukrainian cities and agglomerations in particular, are important engines of economic growth. Not only is urban sector production much greater than rural sector production, in absolute terms, it is also much more productive in per capita terms. Agglomerations in Ukraine seem to be concentrating the little urban (population) growth currently witnessed in the country, but they are also engines of economic growth. Cities in all regions, especially smaller ones, have been losing population, mostly to the largest cities, and usually to those that have formed large urban centers, or agglomerations. Agglomerations, according to night-lights measurements, are more productive in both per capita and per km2 terms. Firm-level data also shows that larger cities had a higher concentration of both economic activity and productivity. The growth of agglomerations is indicative of a movement towards a more efficient urban system. Led by the Kyiv agglomeration, these city clusters hold the large majority of the cities that are actually growing in population (eleven out of fifteen fastest growing cities in the country belong to an agglomeration). This growth might be explained by the fact that these larger groups of cities can through their agglomeration increase productivity by sharing costs, increase access to and the size of their markets, and enhance interactions between citizens and firms. The agglomerations of Ukraine are therefore an important source of economic growth in the country. Overall for Ukraine, steady progress has been observed in the main economic (GDP and GDP per capita) and poverty indicators over the last decade. However, continued progress in these areas is highly uncertain due to (i) the observed negative population trends; (ii) the current conflict; and (iii) the slow progress that Ukraine has made in terms of institutional adaptation and reforms. It is not uncommon that a declining population initially has a positive impact on Executive Summary Source: Ukraine Statistics Department xviii Ukraine_2015_nov26.indd 18 2015-11-26 5:14 PM
  • 18.
    economic indicators, butits effect on economic performance over the long run is uncertain. The higher GDP per capita that is observed following population decline is generally linked to the fact that capital is durable. Such economies may experience an increase in their capital per worker ratio, which may render each inhabitant marginally more productive. Additionally, decreasing population causes an initial shortage of labor, increasing relative demand for it, and potentially resulting in a reduced unemployment rate as well as higher wages. The negative effects of population decline appear later, and are generally visible in the decline in demand for consumption. The effects over time of diminished demand as well as expectations of further population decline reduce incentives for investment and affect GDP growth negatively3 . Additionally, fixed costs in the provision of services also become more burdensome as they are shared among fewer people. Overall, given the demographic trends, the observed increase in GDP per capita should be viewed with cautious optimism; if appropriate measures are not adopted, the increase may not be sustained in the mid-term or long term. Ukraine’s firms and institutions have been adapting slowly to a market economy system. Compared to other countries in the region, Ukraine lags behind in its transition from a centrally-planned economy to a market economy, as well as on its institutional and business environment reforms (for instance, in surveys on the ease of doing business, Ukraine ranks 96th worldwide and 22nd in the ECA region4 ). The EBRD transition index finds Ukraine doing poorly in several areas, including small-scale privatization efforts, enterprise restructuring, price liberalization, and trade and foreign exchange policy. Unless changes are made in these spheres, continued progress will be threatened. Emerging City Typology: Growing and Shrinking Cities An analysis of the urban system reveals the emergence and consolidation of three city types with contrasting economic, spatial, and demographic patterns. The typologies were constructed based on whether cities have growing or declining economic activity, growing or declining population, and expanding or shrinking urban footprints5 . Cities growing in economic activity and expanding in footprint are also performing better in other indicators. These cities have on average significantly lower declines in population, higher concentrations of economic activity and higher rates of growth, and higher productivity. 22 percent of Ukrainian cities and the majority of the largest cities in the country fall within this category (Type 1). These cities are also overwhelmingly concentrated in the Western and Central regions. However, it is important to highlight that an important number of Type 1 cities continue to grow economically despite declining in population. This means that in these areas population decline is not necessarily coming at the expense of growth. While this might be a reflection of a temporal increase in productivity due to an increase in the capital per worker ratio – as observed at the national level – it might also be linked to a decline in congestion costs associated with the city moving toward a new population equilibrium. On the contrary, cities that are declining in economic activity have experienced a sharper population decline. The majority of cities in Ukraine (68 percent) fall under this category. Compared to their thriving peers, these cities are smaller in size (averaging 50,000 inhabitants), are concentrated in the Eastern and Southern regions and to a lesser extent in the Central Region, and have much lower levels of productivity. Two distinct types can be found here: those that are declining in economic activity and shrinking in urban footprint (Type 2) and those that despite economic decline present an expanding urban footprint (Type 3). Type 2 and Type 3 cities are and will continue to experience important urban development challenges including financing and operating their infrastructure as economies of scale decrease with falling population density. These challenges are greater for declining and sprawling cities (Type 3). Executive Summary xix Ukraine_2015_nov26.indd 19 2015-11-26 5:14 PM
  • 19.
    Urban Public PolicyTools: Intergovernmental Fiscal Policy Intergovernmental fiscal relations have lagged behind as a key instrument of urban public policy. Until 2014, the majority of fiscal revenues were not raised by city governments, but came from retained shares of national taxes and transfers. The allocation of these transfers was largely based on the existing network of service facilities and staffing rather than on the demand for services. The system of inter-governmental transfers has led to wide disparities across city types in per capita levels of expenditures per function. The highest per capita expenditures were observed in cities with declining cores and peripheries, while the lowest were observed in growing cities with expanding footprints. Such financial disincentives, combined with legal constraints on local government’s discretion in downsizing the network of facilities and staff, impede the fiscal adjustments necessitated by Ukraine’s demographic and economic changes. In December 2014, the Budget Code was significantly changed; it is expected to help improve the alignment of resources to actual population as part of the ongoing decentralization reform in Ukraine. As a result, the new equalization system will factor in per capita revenue levels and thus significantly decrease the disincentive that focuses on infrastructure need. Such re-design of the transfer mechanism will likely realign resources among local governments, channeling more resources to large and growing cities. Derivation-based sharing of revenues, although partially mitigated with a new basic grant, will likely exacerbate the impact on shrinking cities. It will, however, improve the efficiency of spending. These changes are expected to improve fiscal autonomy and to better align public services with the needs of local communities. Urban Public Policy Tools: Urban Planning Planning has also lagged behind as a key instrument of urban public policy. Urban planning in Ukraine bears the legacy of a centralized planning system. It is not sufficiently flexible to respond to market conditions and to be an effective tool in developing the urban space. Centralized development of master plans and zoning plans is inefficient, costly, and distant from realities on the ground. It is also not sufficiently transparent or welcoming to public input and debate. In addition, the planning framework is not equipped to adequately support strategies that reflect the reality of population loss and economic decline. Existing urban plans are aligned with national growth policies, and so propose expansions of housing and economic activity across all cities despite different local contexts. Recent steps outlined in the Government’s Action Plan on Decentralization that orchestrate towards a planning reform, if implemented in full, have the potential to place planning at the local level, which will permit cities to correlate their own priorities with their economic and social needs. It will promote a more transparent system resulting in plans more closely attuned to the actual conditions of growing and shrinking cities. Such changes will require increased funding and intense capacity-building at the local level. In addition, there is an increased need to raise awareness about the scale and consequences of urban decline so that local governments start to reflect their population’s realities in their urban plans. 3 Markus Brückner and Hannes Schwandt, Income and Population Growth: Discussion Paper No. 7422, Bonn: Institute for the Study of Labor, May 2013, available at http://ftp.iza.org/dp7422.pdf. 4 World Bank Group, Doing Business 2015: Going Beyond Efficiency, available at http://www.doingbusiness.org/data/exploreeconomies/ ukraine/. Only Kiev is considered. 5 A fourth city type (Type 4) with growing light intensity in the core but shrinking urban footprint was found. However, only two cities – Donetsk and Zaporizhia – comprised this classification. Executive Summary xx Ukraine_2015_nov26.indd 20 2015-11-26 5:14 PM
  • 20.
    What Does ItAll Mean for the Future? Implications for Further Analysis and Policy Work, and the Role of the Conflict The overall decline and aging of the Ukrainian population poses important economic and urban development challenges with implications in terms of fiscal policy and demand for public services. Overall labor participation might decline, as older workers leave the labor force and become a larger share of the population. This aging may lead to a reduction of tax revenues due to a diminishing workforce and lower private savings of workers, while it is also expected to lead to an increase in demand for public expenditures related to healthcare, long-term care, and pensions. However, as argued in the recent World Bank Study “The Golden Age of Aging,”6 an aging and declining population does not necessarily lead to economic catastrophe. For instance, a reduction of the labor force can make more capital available to existing workers and lead to increased productivity. To lessen the potential negative consequences of an aging population, the report recommends increasing the retirement age to better reflect gains in life expectancy; focusing on policies that increase fertility to sustainable levels; reforming health and long-term care systems to allow for healthier aging; and embracing migration as a part of the solution. Local governments have a key role to play in this. As cities shrink, Ukraine needs to put in place the right national policies to better manage the population decline of most of its cities while managing population growth in the large agglomerations. The Central Government should create the right mechanisms and incentives (e.g., financial transfers) so that cities focus on declining efficiently and shifting their focus from existing infrastructure to future demand such as agglomerating schools when needed. Given the extent of urban decline, the country should explore the need for establishing national-level programs, such as technical assistance and funds for downsizing, that provide resources to better manage decline. There is also a need to increase awareness of the scale and type of urban decline as many cities continue to follow unrealistic population growth projections. At the same time, local authorities will need to re-assess how infrastructure is planned and maintained and the way services are financed and delivered. Neighborhoods may need to be consolidated as cities lose density. Public service plans, designed for larger populations, may have to be re-considered to address lower demand. In addition, an aging urban population has consequences for the demand for and type of housing (e.g., long-term care facilities), the demand for public transportation (as elderly tend to commute less and have different design needs), and other basic services. The combination of an overall aging urban population and declining fertility rates will also likely shift demand from education to health services. Urban areas will, therefore, need to adapt their social and material infrastructure to better serve the changing needs and demands of their populations. Ukraine should also recognize the role of urban areas in economic growth and make sure that they use the right tools to reach their full potential. To achieve increased productivity in urban centers, the right mix of good governance, a beneficial business climate, and an efficient provision of public goods, usually in the form of public services and infrastructure, is necessary so that agglomeration economies are fostered and congestion costs reduced. In urban areas experiencing population growth, cities should focus on adapting infrastructure and services to ensure that new-comers are well- absorbed and integrated into the city and manage peri-urban growth to avoid sprawl, etc. In addition, the realignment of city boundaries or introduction of metropolitan governance mechanisms might be needed to achieve an effective coordination of agglomerations which span across administrative units. This might require the involvement of the Central Government and is particularly important in the case of public transport. The country also needs to put in place the right policies in cities that continue to grow economically, but are experiencing population decline. In these cases, city administrators should aim at managing population decline in an efficient and harmonious way making the best out of it, for example, turning brownfields into public space and optimizing public transportation. Executive Summary xxi Ukraine_2015_nov26.indd 21 2015-11-26 5:14 PM
  • 21.
    13 Ukraine should reducebarriers to move internally. The low mobility of Ukraine’s internal population is an obstacle preventing the country from reaping the rewards of its urban potential. Improved mobility might further spur the growth of urban centers with emerging employment opportunities. However, increased mobility most likely will also deepen the decline of most Ukrainian cities, which will then require policies to protect the less mobile and more vulnerable population that is left behind. Increasing population mobility will require eliminating or reducing some of the obstacles to move including making the housing market more fluid and permeable (e.g., by increasing rental options and improving access to housing finance) and lowering the transaction costs of moving. In addition, as outlined in the World Development Report 20097 , governments should be neutral in regards to the migration of unskilled labor: encouraging migration for economic reasons, discouraging migration in search of public services, and strongly supporting internal migration of skilled labor. The latter can be done through investment in services in lagging areas to build portable human capital and to increase the flow of labor market information, among other initiatives, so migrants arrive better informed of employment opportunities. In terms of fiscal policy, Ukraine’s policy makers might re-think the structure of functional sub-national expenditure in view of changing demographics. So far, expenditures for education have been steadily increasing despite the rapidly aging population, which itself has placed increasing demands on the health system. By earmarking new subventions separately for education and health, the new system can take advantage of under-utilized social infrastructure and focus on increasing capacity in places with growing demand. More generally, the focus of reforms in the short-term might be on increasing the yield of user fees and property taxes as a way to make cities assume their responsibility to collect own revenue. In the medium-term, some of these taxes could be re-assigned from national to the sub-national level as a way to increase horizontal accountability of local officials to their residents as well as fiscal responsibility. Addressing fiscal fragmentation and amalgamating the bottom tier should remain a priority for government as a way to improve fiscal efficiency in service provision. Finally, urban planning and spatial development should take note of the continuing demographic changes and shifts in the country. Current mobility remains low and the high homeownership rate has prevented the widespread housing abandonment that characterizes typical shrinking cities in Europe and United States. Once mobility increases and people start migrating to opportunity, declining cities are likely to decline even faster, while the growing centers and agglomerations may experience peri-urban growth and sprawled development. In both cases, authorities will need to reassess how infrastructure is planned and maintained to ensure that shrinking cities continue to provide acceptable levels of service to their populations at reasonable cost, while growing urban centers are supported to foster further growth. 13 6 World Bank Group, The Golden Age of Aging (2014). 7 World Bank (2009), Reshaping Economic Geography – World Development Report. Executive Summary xxii Ukraine_2015_nov26.indd 22 2015-11-26 5:14 PM
  • 22.
  • 23.
    CHAPTER 1 The UrbanSystem: Demographics and Economic Trends 1 CHAPTER 1 The Urban System: Demographics and Economic Trends Ukraine_2015_nov26.indd 1 2015-11-26 5:14 PM
  • 24.
    Key Highlights andImplications for Further Policy and Analytical Work Over the past two decades, Ukraine has experienced population decline and aging trends, which have had important consequences at the city level. Over this time, national population has declined by 13 percent; urban population has declined by around 9 percent. In the strict sense of the term, the country continues to urbanize as its rural population is declining at faster rates than its urban population. However, more than 80 percent of its cities are losing population. There are important geographic differences in this demographic transition with the Eastern region observing a sharper population decline when compared to the Western and Central regions. In a similar way, shrinking cities are disproportionally concentrated in the East while growing ones are disproportionally concentrated in the West. The observed demographic shifts across the territory might have been stronger if mobility had been less constrained, as internal migration has been low. In fact, recent migration studies reveal that in Ukraine few people are moving to economic and social opportunity. Economic activity has been shifting within and across regions, but Ukraine’s firms and institutions have been slow in adapting to a market economy. This is confirmed by analyzing trends in regional Gross Value Added (GVA), firm-level and employment location data, and night-light (NLs) data (used as a proxy for economic activity). Although the Eastern region continues to play an important role in the economy, the Western and the Central regions have been much more dynamic. This is partly explained by a combination of lower initial levels of economic activity in the West – compared to the East – and a faster transformation of the West from agriculture to more productive sectors. The Eastern region is also less productive than its urbanization level would suggest. There has also been a shift in the structure of the Ukrainian economy with the service sector growing significantly in importance in the Western and Central regions. The structural shift has been accompanied by steady progress in the main economic indicators of the country (GDP, GDP per capita, and poverty). However, continued progress in these areas is highly uncertain due to (i) the observed negative population trends, (ii) the current conflict, and (iii) the slow progress that the country has made in terms of institutional adaptation and reforms towards a market-oriented system. Ukrainian cities and agglomerations, in particular, are important engines of economic growth. The urban sector is more productive than the rural both in absolute and per capita terms. Agglomerations – cities whose NLs footprint merge – account for the little urban population growth currently witnessed in the country, and are more productive in both per capita and per km2 terms than their smaller peers. Firm-level data also show that larger cities have a higher concentration of both economic activity and productivity. This growth might be explained by the fact that these larger groups of cities can through their agglomeration increase productivity by sharing costs, increasing access to and the size of their markets, and enhancing interactions between citizens and firms. Over the past decade, three City Types with contrasting economic, spatial and demographic patterns have emerged and consolidated in Ukraine. The first type corresponds to cities that are growing in economic activity and expanding in footprint (Type 1). Type 1 cities – which comprise 22 percent of the urban system – are also performing better in other indicators; they have, on average, significantly lower declines in population, higher concentrations of economic activity and rate of growth, and higher productivity. However, an important number of Type 1 cities continue to grow economically despite declining in population. This means that in these areas – at least in the short term – population decline is not coming at the expense of growth. The second and third types of cities correspond to cities that are declining in economic activity, but either shrinking (Type 2) or expanding (Type 3) in footprint. They have much lower productivity levels, have experienced a sharper population decline, are smaller in size (average 50,000 inhabitants), and are overwhelmingly concentrated in the Eastern and Southern regions. These cities are experiencing and will continue to experience important urban development challenges, including financing and operating their infrastructures as economies of scale decrease with falling population density. 1 Figures that do not include a source in this Chapter were developed by World Bank staff working on the report. CHAPTER 1 The urban system: Demographics and Economic Trends1 2 Ukraine_2015_nov26.indd 2 2015-11-26 5:14 PM
  • 25.
    Going forward, Ukraineneeds to put in place the right policies to better manage urban population decline while managing growth in the number of large agglomerations. On the one hand, the overall decline and aging of the Ukrainian population poses important economic and urban development challenges with implications in terms of fiscal policy, infrastructure financing, and demand for public services. In shrinking cities, neighborhoods may need to be consolidated and public service plans designed for larger populations may have to be re-considered to address lower demand. The combination of an overall aging urban population and declining fertility rates will also likely shift demand from education to health services. The Central government should in turn create the right incentive frameworks so that cities focus on declining efficiently. Given the scale of urban population decline, the country should explore the need for establishing national-level programs, such as technical assistance and funds for downsizing. On the other hand, the country should recognize the role of urban areas in economic growth and make sure that growing urban centers have the right tools to reach their full potential. To increase productivity in urban centers, the right mix of governance, a beneficial business climate, and efficient provision of public services and infrastructure is necessary so that agglomeration economies are fostered and congestion costs are reduced. In the case of agglomerations that span across administrative units, the country might need to assess the benefits of realigning city boundaries or the introduction of metropolitan governance mechanisms. In addition, to reach its full economic potential the country needs to reduce barriers so that people can move to opportunity. However, increased mobility will likely deepen the decline of most Ukrainian cities, which will then require policies to protect the less mobile and more vulnerable population that is left behind. Increasing population mobility will require eliminating or smoothening some of the obstacles to move, including making the housing market more fluid and permeable (e.g., increase rental options and improve access to housing finance) and lowering the transaction costs of moving. I. Demographics2 A declining and aging population presents challenges going forward Over the past two decades Ukraine has experienced a dramatic population decline. In 1993, Ukraine had 52.2 million inhabitants while in 2013, it was estimated to have 45.5 million inhabitants. Over this period the country lost 13 percent of its population. While similar levels of population decline can be found in other countries in the region, such as Bulgaria (-14 percent) and Romania (-13 percent), the degree of decline in Ukraine’s population growth rate is below the ECA regional average (Figure 1). The sharp decline in population growth rate observed in the decade after the fall of the Soviet Union – 1990 to 2000 – was partly the result of out-migration but was also very much linked to an overall aging trend of the population and a significant decline in fertility. However, the sharp decline in the growth rate appeared to be rebounding toward population stabilization prior to the current conflict. CHAPTER 1 The urban system: Demographics and Economic Trends 2 In order to provide a regional overview of the country, this document uses the definition of four geographic regions developed by the Kiev International Institute of Sociology: East, Center, South, and West. 3 Ukraine_2015_nov26.indd 3 2015-11-26 5:14 PM
  • 26.
    The overall declinein the population, much like in the region, is driven by a strong decline in fertility rates and a fast aging population, but it is also exacerbated by still high old-age mortality rates. The average age in Ukraine has increased from 33 to 39 over the last 20 years, led largely by a dramatic increase in the average age in urban areas. Measured by average remaining life expectancy, Central and Eastern Europe is by far the oldest region in the world, even significantly older than Western Europe. As in Ukraine, this is caused by low fertility rates and high old-age mortality rates. As an example, in France a 71-year-old man in 2009 had the same risk of dying as a 60-year-old man in 1959, while in Ukraine a 54-year-old man in 2009 had the same risk of dying as a 60-year-old in 1959. Figure 2 – Aging is increasingly an urban issue in Ukraine Source: World Development Indicators Source: Ukraine Statistics Department CHAPTER 1 The urban system: Demographics and Economic Trends Figure 1 – Ukraine’s population is declining faster than the ECA region average Azerbaijan Kyrgyz Republic Turkey Romania Russian Federation Ukraine Europe Central Asia (developing only) AnnualPopulationGrowth(%) 1961 1964 1967 1970 1973 1976 1979 1982 1985 1988 1991 1994 1997 2000 2003 2006 2009 2012 4 3 2 1 0 -1 -2 40 38 36 34 Averageage Total Avg age Urban Avg age Rural Avg age 1990 1995 2000 2005 2010 4 Ukraine_2015_nov26.indd 4 2015-11-26 5:14 PM
  • 27.
    17 Ukraine’s population dynamicsare very different across the age distribution, with declining fertility rates creating a diamond-shaped population pyramid (Figure 3). Both Figure 3 and Figure 4 below suggest that the overall negative population growth is better demonstrated with data disaggregated by age. The decline in the 0-10 years cohorts is much sharper (-41 percent) than the one observed in the 11-39 years cohorts (-6 percent) between the years of 1989 and 2011. In addition, the decline of these younger cohorts is higher, in percentage terms, in urban areas (-42 percent) than in rural areas (-38 percent), which is probably due to lower urban fertility rates. This also supports our previous point of an increasingly accelerating average age in urban areas. The fastest growing segment of the population – by age cohort – is the 60+ cohort living in urban areas (Figures 4 and 5). Between 1989 and 2011, this age cohort grew 21 percent in urban areas. By contrast, a 19 percent decrease of this cohort in the rural areas offset the effect of this urban growth, such that national growth was 3 percent. The dynamics within this older age cohort are different between genders, with the 60+ overall population increasing 11 percent among men, while increasing less than 1 percent for women between 1989 and 2011. Some analysts suggest that the large number of men that died during the Second World War3 could explain the low numbers observed in 1989 in this cohort and the subsequent large percentage increase in 2011. Large increases can be observed in the urban population of men in the 60+ age cohort, which grew 26 percent, and of women of the same age group, which grew 18 percent. In contrast, in the rural sector, population in this age cohort decreased for both men and women, but more than twice as fast for women than men (23 percent for women and 10 percent for men). These trends are a result of the combination of internal and external migration dynamics, where more men can be found migrating internally from rural to urban areas, and relatively more women migrating outwards. CHAPTER 1 The urban system: Demographics and Economic Trends Figure 3 – Population dynamics flattened as the younger share of the population has decreased Source: Ukraine Statistics Department 3 It is estimated that around 7 million people died in this period (Andrew Gregorovich, World War II in Ukraine: Total Losses by Country). 3 000 3 0002 000 2 0001 000 1 0000 100 95-99 90-94 85-89 80-84 75-79 70-74 65-69 60-64 55-59 50-54 45-49 40-44 35-39 30-34 25-29 20-14 15-19 10-14 5-9 0-4 Population Pyramid 1989 WomenMen 3 000 3 0002 000 2 0001 000 1 0000 100 95-99 90-94 85-89 80-84 75-79 70-74 65-69 60-64 55-59 50-54 45-49 40-44 35-39 30-34 25-29 20-14 15-19 10-14 5-9 0-4 Population Pyramid 2011 WomenMen ThousandsThousands 5 Ukraine_2015_nov26.indd 5 2015-11-26 5:14 PM
  • 28.
    Figure 4 –The urban population age mimics the flattening of the general population pyramids Figure 5 – The decrease in younger population is less in the rural areas. These areas also show a decrease in the older cohorts of the population Source: Ukraine Statistics Department Source: Ukraine Statistics Department Despite its similarities to populations of other countries of the Former Soviet Union (FSU), Ukraine’s population is aging more dramatically. As shown in Figure 7, for both 1991 and 2008, Ukraine had the lowest percentage of population aged 0-14 than any other country of the FSU. At the same time, Ukraine’s share of population that is age 65 and older is the region’s largest and is increasing. These trends are accompanied by a slightly recovering but still very low birth rate since 2001 (Figure 8). More importantly, fertility rates remain very low and under replacement levels at least since 1990. CHAPTER 1 The urban system: Demographics and Economic Trends 2 000 2 0001 500 1 5001 000 500 500 1 0000 100 95-99 90-94 85-89 80-84 75-79 70-74 65-69 60-64 55-59 50-54 45-49 40-44 35-39 30-34 25-29 20-14 15-19 10-14 5-9 0-4 Urban Population Pyramid 1989 WomenMen Thousands 2 000 2 0001 500 1 5001 000 500 500 1 0000 100 95-99 90-94 85-89 80-84 75-79 70-74 65-69 60-64 55-59 50-54 45-49 40-44 35-39 30-34 25-29 20-14 15-19 10-14 5-9 0-4 Urban Population Pyramid 2011 WomenMen Thousands 10 000 10 0004 000 4 0006 000 6 0008 000 8 0002 000 2 0000 100 95-99 90-94 85-89 80-84 75-79 70-74 65-69 60-64 55-59 50-54 45-49 40-44 35-39 30-34 25-29 20-14 15-19 10-14 5-9 0-4 Rural Population Pyramid 1989 WomenMen Thousands 10 000 10 0004 000 4 0006 000 6 0008 000 8 0002 000 2 0000 100 95-99 90-94 85-89 80-84 75-79 70-74 65-69 60-64 55-59 50-54 45-49 40-44 35-39 30-34 25-29 20-14 15-19 10-14 5-9 0-4 Rural Population Pyramid 2011 WomenMen Thousands 6 Ukraine_2015_nov26.indd 6 2015-11-26 5:14 PM
  • 29.
    Ukraine’s population dynamicsvary across its regions, with the Eastern region losing its youngest population at a faster rate than others. This region presents negative growth at all cohort levels, except for the 60+ age cohort (See Figure 9 below). By contrast, all of the other regions present positive growth of the 40-60 years cohort. The population in the Western region is declining at a slower pace; this is due both to its – on average – higher fertility rates (12.76 births per 1,000 inhabitants in Western versus 9.7 births per 1,000 inhabitants in the Eastern region) and lower mortality rates (13.62 per 1,000 inhabitants in the Western versus 15.56 per 1,000 inhabitants in the Eastern region) than Eastern, central and southern regions. Additionally, higher mortality rates in the Eastern region may be explained by a significant share of employment in the region in the mining sector, a sector that generally presents higher rates of employee mortality and disability4 . 4 The Jamestown Foundation states that Ukraine has the world’s second-highest mining fatality rate, behind only China (Eurasia Daily Monitor Volume: 6 Issue: 167). This is a common trend worldwide. For example, mining has the second highest fatality rate among all sectors in the US (US Bureau of Labor Statistics; national census of fatal occupational injuries in 2006). Figure 6 – A sharp decline in fertility rates is leading to an important reduction of the young cohort Source: Ukraine Statistics Department CHAPTER 1 The urban system: Demographics and Economic Trends Figure 7 – Ukraine is aging more dramatically than neighboring countries Source: Eurasian Cities 2012 national urban rural all ages 0-10 11-24 25-39 40-60 60 plus 30% 20% 10% 0% -10% -20% -30% -40% -50% Population changes by age cohort in Ukraine (1989-2011) 20081991 Tajikistan Uzbekistan Turkmenistan Kyrgyz Republic Azerbaijan Kazakhstan Armenia Moldova Georgia Belarus Russian Fed. Ukraine Percentageoftotalpopulation Population ages 0-14 50 45 40 35 30 25 20 15 10 5 0 20081991 Tajikistan Uzbekistan Turkmenistan Kyrgyz Republic Azerbaijan Kazakhstan Armenia Moldova Georgia Belarus Russian Fed. Ukraine Percentageoftotalpopulation Population ages 65 and older 18 16 14 12 10 8 6 4 2 0 7 Ukraine_2015_nov26.indd 7 2015-11-26 5:14 PM
  • 30.
    Figure 8 –The birth rate has recovered since 2001, but remains very low. Fertility rates follow similar trends, remaining under replacement levels at least since 1990 Figure 9 – Ukraine’s eastern region has the highest rate of overall population decline Source: Ukraine Statistics Department (left) and World Bank WDI (right) Source: Ukraine Statistics Department CHAPTER 1 The urban system: Demographics and Economic Trends Urban areas are aging rapidly across all Ukraine’s regions. While increases in aging in the urban population’s first three age cohorts—0 to 10, 11 to 24, and 25 to 39—look very similar to those observed for all Ukraine, the 60+ urban cohort is growing at a much faster pace than other cohorts in urban areas (Figure 10). Among this cohort, the fastest growing population is in the Western Region, which is also observing a significant increase in its 40 to 60 age cohort. The fast- aging urban population, across all regions, is reflected in an increase in Ukraine’s average age as shown below in Figure 11. Western Eastern Central Southern Ukraine 1995 20122001 13 11 9 7 5 Births per 1000 inhabitants 1990 1992 1994 1996 1998 2000 2002 2004 2006 2008 2010 2012 2.2 2.1 2.0 1.9 1.8 1.7 1.6 1.5 1.4 1.3 1.2 1.1 1.0 Fertility Rates Fertility Rates Replacement rate Ukraine Central Region Southern Region Western Region Eastern Region 20% 10% 0% -10% -20% -30% -40% -50% all ages 0-10 11-24 25-39 40-60 60 plus Population changes by age cohort and by regions (1989-2011) 8 Ukraine_2015_nov26.indd 8 2015-11-26 5:14 PM
  • 31.
    CHAPTER 1 Theurban system: Demographics and Economic Trends Figure 10 – The Eastern region has the highest overal decline in population in urban areas Figure 11 – The average age is increasing in all urban areas Source: Ukraine Statistics Department Source: Ukraine Statistics Department Ukraine Central Region Southern Region Western Region Eastern Region 40% 30% 20% 10% 0% -10% -20% -30% -40% -50% -60% all ages 0-10 11-24 25-39 40-60 60 plus Urban population changes by age cohort and by regions (1989-2011) 45 40 35 30 45 40 35 30 Averageage Total Avg age Urban Avg age Rural Avg age 1990 19901995 19952000 20002005 20052010 2010 Western Eastern Central Southern 9 Ukraine_2015_nov26.indd 9 2015-11-26 5:14 PM
  • 32.
    CHAPTER 1 Theurban system: Demographics and Economic Trends Although both a decline in fertility and aging play a central role in the overall population decline, out-migration is also playing an important role. An analysis of implied migration5 data across regions suggests that a large part of the population decline is the result of net out-migration reveals the potential role that outmigration can be playing on the overall population6 decline. In addition, the Western region presents an interesting shift in behavior when comparing annual data from 1995 to 2001 and from 2001 to 2010. As the analysis of implied migration is imperfect, secondary sources of information are used to further review migration patterns. Recent studies confirm that negative net migration has contributed to further population decline, becoming one of the biggest challenges in the country. The International Labor Organization (ILO) estimated that between January 2010 and June 2012, 1.2 million people (or 3.4 percent of the population) were working or searching for employment abroad7 . Additionally, according to the Ukrainian statistics bureau, in 2013 alone, 621,842 people left the country8 . Labor migration from Ukraine is mostly of cyclical and seasonal character. According to the Modular Sample Survey on Labor Migration in Ukraine 2013, the average duration of stay abroad for migrants on their most recent labor trip taken was 5 months. Persons migrating to neighboring countries (Russia, Belarus, Poland, the Czech Republic, and Hungary) generally undertake periodic short trips with a permanent return to Ukraine. However, those travelling to the South European countries and Germany usually remain working there for longer periods of time. Evidence suggests that most of the recent migration from Ukraine – prior to the current conflict – was to the countries of the Commonwealth of Independent States (CIS) countries and the European Union (EU). For the 2010-2012 period, the largest recipient countries were the Russian Federation (43.2 percent of Ukraine migrants), Poland (14.3 percent), Italy (13.2 percent), and the Czech Republic (12.9 percent). Spain, Germany, Hungary, Portugal, and Belarus also received significant influxes of migrants from Ukraine. Historically, there have been three distinct waves of migration from Ukraine: in 1890-1914, before and after WWII, and after Ukraine became independent. The Ukrainian diaspora abroad can be measured under different criteria of, one being the country of birth and country of nationality. Table 1 below presents the distribution of the Ukrainian diaspora according to both criteria by the Migration Policy Center. According to the official statistical institute of Ukraine, the following countries have the biggest stock of Ukrainians: the Russian Federation (1.93 million), Canada (1.2 million), the USA (893 thousand), Brazil (500 thousand), Kazakhstan (333 thousand), Moldova (477 thousand) and Argentina (250 thousand). The vast majority of migrants in the wave of migration after Ukraine’s independence but prior to the conflict came from oblasts located in the Western region (Figure 12 and Figure 13). According to the ILO’s 2012 Modular Sample Survey on Migrations in Ukraine, in fact, 72 percent of migrants in the period of 2010-2012 were estimated to come from this area. It is important to note that official statistics may underestimate the real flow of migrants, many of whom may be illegal and undocumented. Specifically, the oblast with the highest migration rate was Zakarpattia, whose population is relatively young and diverse, with large shares of Hungarians (12 percent), Romanians (2.6 percent), Russians (2.5 percent), and Slovaks (0.5 percent). This is also the oblast with the highest percentage of Gypsy population (1.1 percent), whose mobility might add to the migration balance. The others regions contributed to a lesser extent to Ukraine’s out- migration. Some patterns regarding migration destinations can be observed in the ILO sample; as expected, most of the Eastern region’s migrants headed to Russia, while the Western region’s migrants had a greater variety of destinations. Apart from Russia, Germany was a popular destination for migrants from the South, while nearby Poland attracted a significant number of migrants from the Western region. 5 Implied migration is estimated as the residual after births and deaths are considered in population comparisons. 6 International Organization for Migration, Migration in Ukraine: Facts and Figures, 2011. 7 ILO, Modular Sample Survey on labor Migration in Ukraine (2013). 8 Ukrstat.org – “публикація документів Державної Служби Статистики України” 10 Ukraine_2015_nov26.indd 10 2015-11-26 5:14 PM
  • 33.
    CHAPTER 1 Theurban system: Demographics and Economic Trends Table 1 – Ukrainian diaspora by country of residence (ca. 2012) Source: : Migration Policy Center, Mpc - Migration Profile: Ukraine (2013) Definition: Depending on the country of destination, Ukrainian migrants are classified by country of birth (A) orcountry of nationality (B). As Russia reports numbers using both definitions, total estimations are used for Russia (A) and for (B). Country of residence Definition Reference date Number (Russia –A) Number (Russia – B) % (Russia-A) % (Russia B) EU of which 1,052,184 19.7 53.3 Poland (A) 2012 227,446 4.3 12.2 Italy (A) 2012 201,830 3.8 10.8 Germany (B) 2012 153,393 2.9 8.2 CSI Countries and Georgia 3,581,104 114,519 67.1 6.1 of which Russia (A) 2002 3,581,104 x 66.7 x Russia (B) 2010 3,559,975 59,339 x 5.0 Belarus (B) 2009 16,874 0.3 0.9 Moldova (B) 2010 0.1 0.2 Other countries of which 702,551 13.2 37.6 US (A) 2011 352,793 6.6 18.8 Israel (A) 2005 258,793 4.9 13.8 Canada (A) 2006 59,460 1.1 3.2 TOTAL 5,335,840 1,869,255 100 100 11 Ukraine_2015_nov26.indd 11 2015-11-26 5:14 PM
  • 34.
    CHAPTER 1 Theurban system: Demographics and Economic Trends Figure 12 – Migration is increasingly a factor in Ukraine’s population decline Source: Authors’ analysis of data from Ukraine Statistics Department Figure 13 – Labour migration rate by regions Source: Authors’ analysis; ILO, Modular Sample Survey on Labor Migration in Ukraine (2012) Population change Deaths Implied migration Births Thousandsperyear 2001-2011 600 400 200 0 -200 -400 -600 -800 -1000 Ukraine central western southern easthern Population change Deaths Implied migration Births Thousandsperyear 1995-2001 600 400 200 0 -200 -400 -600 -800 -1000 Ukraine central western southern easthern Volyn Lviv Ternopil Zakarpat Chernivtsi Ivano- Frankyvsk Rivne Zhytomyr Chernihiv Sumy Cherkasy Kirovohrad Mykolaiv Odessa Kherson Crimea Sevastopol Poltava Kharkiv Luhansk Donetsk Dnipropetrovsk Zaporizhzhia Vinnytsya Kyiv Khmelnytskyi KyivCity RUSSIAN FEDERATION BELARUS ROMANIA POLAND MOLDOVA Participation Rate Population, Aged 15-70 Very High Average Low Very Low High 12 Ukraine_2015_nov26.indd 12 2015-11-26 5:14 PM
  • 35.
    Total (000) Total (%) Total (thousands) Percentageby destination Percentage by origin Central South East West Central South East West Central South East West Russian Fed. 511 43.2 76,1 50,6 102,2 282,1 14.9 9.9 20.0 55.2 64.5 49.9 88.1 33.2 Poland 168,4 14.3 6,6 3,9 0,0 158,0 3.9 2.3 0.0 93.8 5.6 3.8 0.0 18.6 Italy 156 13.2 9,0 10,9 2,7 133,4 5.8 7.0 1.7 85.5 7.7 10.8 2.3 15.7 Czech Republic 153 12.9 10,3 0,0 0,0 142,7 6.7 0.0 0.0 93.3 8.7 0.0 0.0 16.8 Spain 52,6 4.5 1,3 10,0 0,0 41,3 2.5 19.0 0.0 78.5 1.1 9.9 0.0 4.9 Germany 27,8 2.4 2,0 11,8 4,5 9,5 7.2 42.4 16.2 34.2 1.7 11.6 3.9 1.1 Hungary 23 1.9 0,0 0,0 0,0 23,0 0.0 0.0 0.0 100.0 0.0 0.0 0.0 2.7 Portugal 21,7 1.8 9,1 0,0 0,0 12,6 41.9 0.0 0.0 58.1 7.7 0.0 0.0 1.5 Belarus 21,5 1.8 2,4 0,0 0,0 19,1 11.2 0.0 0.0 88.8 2.0 0.0 0.0 2.2 Other Countries 46,6 3.9 1,3 14,1 6,7 29,1 2.8 30.3 14.4 62.5 1.1 13.9 5.8 3.4 TOTAL 1181,6 100 118,1 101,3 116,1 850,8 10.0 8.6 9.8 72.0 100.0 100.0 100.0 100.0 TheCzechRepublicandHungarywerethemainrecipientsofmigrantsfromZakarpattia.Thisisprimarilyduetogeographical proximity. Further, the Western region’s ethnic specificity is a contributing factor – most Ukrainian Hungarians live there – and Zakarpattia was historically part of the Austro-Hungarian Empire. Other western oblasts generated a large number of migrants to Southern European countries such as Portugal, where in relative terms Ukrainians are the second biggest immigrant group after Brazilians – with about 44 thousand migrants officially registered. The profile of Ukraine’s migrants is diverse, but they are disproportionally young and approximately two-thirds of emigrants are male. However, certain distinctions can be observed among the emigrant populations of the destination countries. Some Southern European countries receive a larger share of women because of the demand for service- oriented jobs in those countries, whereas the Russian Federation receives a higher share of migrant men because of the demand for manual or mechanical jobs. Moreover, 45 percent of migrants are between 15 to 35 years of age, while this age cohort comprised 29% of Ukraine’s total population, demonstrating an over-representation of young people among Ukraine’s migrants. In addition, migrants’ origins were almost equally divided between rural (55 percent) and urban areas (45 percent). CHAPTER 1 The urban system: Demographics and Economic Trends Table 2 – Between 2010 and 2012, migrants came mainly from Ukraine’s western region Source: ILO, Modular Sample Survey on Labor Migration in Ukraine (2012) 13 Ukraine_2015_nov26.indd 13 2015-11-26 5:14 PM
  • 36.
    Regarding the educationallevel of migrants, an ILO study9 concluded that for most European countries Ukrainian migrants are more educated than the local labor. Nevertheless, most of Ukraine’s temporary migrants are from segments of the Ukrainian population with lesser educational achievement (e.g., construction workers going to Russia as well as service workers going to Southern Europe). By contrast, younger, highly-educated migrants are usually leaving permanently in order to find better opportunities professionally and financially. Figure 13 shows that higher labor migration rates were in the Western region in Ukraine between 2010 and 2012. An analysis of the migration patterns since the conflict’s onset is provided in the Conclusion Section. An analysis of internal labor migration patterns prior to the conflict has been included in Section 2 following the urbanization analysis. Key messages and implications for further policy and analytical work Over the past two decades Ukraine’s population has been declining and aging. Over this period the country lost 13 percent of its population. The sharp decline in population was partly the result of out-migration but is also very much linked to an overall aging trend of the population in the country and a significant decline in fertility. Fertility rates remain very low and have been below replacement levels since 1990. Population dynamics differ across age cohorts, urban and rural, and regions. The decline in the youngest cohorts, from 0 to 10 years, is much sharper – at 41 percent – than the one observed in the 11 to 39 years old cohort. The youngest cohort is also declining more in urban areas than in rural areas. On the contrary, the fastest growing segment of the population is the 60+ cohort living in urban areas, which grew by 21 percent over the past two decades. Variation in population dynamics is also visible across regions, with the Eastern region losing its youngest population at a faster rate than others. In terms of out-migration, the vast majority of migrants – prior to the conflict – came from Oblasts located in the Western region; were disproportionately young and to a large extent male. As will be discussed in subsequent sections, the overall population decline is leading to an important decline of the population in the majority of urban centers in Ukraine, and even more dramatically since the conflict started in 2014. The overall decline and aging of the Ukrainian population poses important economic and urban development challenges with implications in terms of fiscal policy and demand for public services. Overall labor participation might decline, as older workers leave the labor force and become a larger share of the population. This aging may lead to a reduction of tax revenues due to a diminishing workforce and lower private savings of workers, while it is also expected to lead to an increase in demand for public expenditures related to healthcare, long-term care, and pensions. However, as argued in the recent World Bank Study “The Golden Age of Aging”10 , an aging and declining population does not necessarily lead to economic catastrophe as the demographics observed in the region may prove temporary in nature. For instance, a reduction of the labor force can make more capital available to existing workers and lead to increased productivity. To lessen the potential consequences of an aging population, the report recommends increasing the retirement age to better reflect gains in life expectancy; focusing in policies that increase fertility to sustainable levels; reforming health and long- term care systems to allow for healthier aging; and embracing migration as a part of the solution. Local governments have a key role to play in this. 9 Ganna Vakhitova and Tom Coupe, The Relations between Education and Migration in Ukraine, International Labor Organization, 2014. 10 World Bank Group: The Golden Age of Aging, 2014. CHAPTER 1 The urban system: Demographics and Economic Trends 14 Ukraine_2015_nov26.indd 14 2015-11-26 5:14 PM
  • 37.
    Ukraine’s cities duringthe soviet period Large-scale urbanization in Soviet Ukraine commenced only after 1945 and resulted from an increase in the demand for labor by the country’s industries and a massive housing production initiative. In 1945 only 34 percent of the population of Ukraine lived in urban areas and Ukraine was still predominantly rural. Rapid urbanization only came later and was caused by an increase in the demand for labor in the industrial centers in the cities of Soviet Ukraine and a large campaign for the construction of residential housing units driven by the housing reform of Nikita Khrushchev in the late 1950s. The growth of the urban population throughout the USSR was mainly due to a large-scale migration of rural population to the cities. In Ukraine, urbanization and industrialization went hand-in-hand; as the USSR restored infrastructure and factories demolished in the war and built new one and workers started arriving from the central parts of Russia and from further away in the USSR. At the time, the majority of Ukraine’s population lived in multi-family apartments, hostels, or barracks, and the drive for single-family dwellings with all basic amenities became an important national policy in the 1950s-1960s. Urban development policies were strongly linked to the decision to expand housing construction. The industrialization and standardization of housing construction made it possible to rapidly increase the supply of housing and played an elemental role in the growth of Ukrainian cities. The idea of simple and utilitarian blocks of flats came to the USSR from Germany and the US, where pre-fabricated construction took off in the 1930s and expanded significantly immediately after WWII (e.g., Concept of Plattenbau in Germany). New buildings were produced in factories using panel construction that could then be assembled on site. It was estimated that more buildings were built in Ukraine from 1956 to 1964 than in the previous 38 years of Soviet rule12 . Urban development at the time was viewed through the perspective of achieving higher socio-economic equity across Ukraine’s cities. The 22nd Communist Congress held in 1961 outlined a roadmap, which aimed to eliminate disparities in social infrastructure between cities and villages. However, officials were also instructed to avoid an excessive concentration of population in big cities, to promote the development of small cities and towns, and to transform farm villages into bigger town-like settlements. The optimal size for a city in terms of population was considered to be between 20,000 and 300,000 inhabitants13 . The national policy was also influenced by meager per capita size of the housing stock, which was around 4-5 m2 in cities like Moscow or Kyiv. Going forward, as cities shrink, local authorities will need to re-assess how infrastructure is planned and maintained, and the way services are financed and delivered. Neighborhoods may need to be consolidated as cities lose density. Public service plans, designed for a larger population, may have to be re-considered to address lower demand. In addition, an aging urban population has consequences for the demand for and type of housing (e.g., long-term care facilities), the demand for public transportation (as elderly tend to commute less and have different design needs), and other basic services. The combination of an overall aging urban population and declining fertility rates will also likely shift demand from education to health services. Urban areas will, therefore, need to adapt their social and material infrastructure to better serve the changing needs and demands of their population. II. Urbanization and the Urban System11 11 In providing a regional overview of the country, this document uses the description of four geographic regions developed by the Kiev International Institute of Sociology: East, Center, South, and West. 12 Yaroslav Hyrych, “Urbanization According to Plan,” The Ukrainian Week, 26 September 2012, available at http://ukrainianweek.com/ History/60924 . 13 Urban Development Institute under the Academy for Construction and Architecture of Ukrainian SSR (1950). CHAPTER 1 The urban system: Demographics and Economic Trends 15 Ukraine_2015_nov26.indd 15 2015-11-26 5:14 PM
  • 38.
    The emergence andlater obsolescence of Ukraine’s cities was facilitated by the Soviet command-administrative system. Between 1956 and 1965 the number of cities increased substantially due in part to legal changes that allowed Oblast councils to grant city status to settlements – a power previously limited to Ukraine’s central government (or Verkhovna Rada). While in 1946 Ukraine urban system was composed of 258 cities, by 1959 the number had grown to 331 and by 1970 to 385. Uzhhorod, for example, was a town that had only 17,000 inhabitants at the war’s end, but experienced a population increase when it was granted oblast center status (in 1946) and a university opened there. By 1989, it counted more than 100,000 inhabitants. By contrast, settlements that lost their “city” status eventually declined. Cities in the post-war era were developed around a core industry and guided by industrialization policies. The majority of these cities emerged in priority industrial areas identified and established by the central Government such as Donetsk, Luhansk, and Dnipropetrovsk oblasts and along the Black Sea coast. These policies produced flourishing, mono-functional cities14 , where the majority of the population was employed by one or few inter-connected industries and the city’s economy was fully dependent on them. A more detailed review of the mono-functional cities system is described in Box 1 below. 14 Law on the Approval of the National Programme of Development of Small Cities # 1580-IV approved on 04.03.2004 (in Ukrainian) - http:// zakon2.rada.gov.ua/laws/show/1580-15 The term mono-functional city or mono-town refers to a city whose economic performance and employment is highly dependent on one or few industries. In Ukraine, this term is defined in law as cities where the employment of economically active population works in enterprises mainly focused on one or two main economic sectors that also support a substantial part of the city’s budget and social infrastructure. At present, there are 111 mono-functional cities in Ukraine: 32 are focused on coal extraction, 27 on the processing industry, 18 are agricultural centers, nine are focused on transport and nine on power engineering, seven focused on production of ore and non-metallic resources, six on chemicals and the oil refining industry, two on therapeutics, and one on art. The Donetsk oblast counts with the highest number of mono-functional cities with 27 of them. This is partly explained by the decision to have eastern Soviet Ukraine specialize as a region in coal-mining, metallurgy, heavy machinery, chemicals, etc., based on the abundance of natural resources found in the Eastern Region. A mono- functional city approach was extensively used in the period of the centrally-planned economy as the instrument for implementing industrialization and the territory management policy, which was heavily oriented towards large- scale industry and its accompanying infrastructure. During the 1950s-1970s, the narrow industrial specialization of individual cities combined with large-scale infrastructure and intensive transport flows were features of the paradigm of ‘territorial industrial complexes’ implemented throughout the USSR. Due to the heritage of this narrow economic specialization, mono-functional cities are highly vulnerable to the economic changes that have occurred in the country since the post-Soviet era. For example in the Donetsk and Lugansk oblasts, the economic performance of these cities is highly dependent on the status of the region’s mineral reserves, the degree of their industrial development, and the competitiveness of enriched raw materials extracted by local enterprises. It is also dependent on the ability of new private owners to manage local enterprises in a way that enhances their competitiveness. Many of these cities, which are dependent on the coal mining industry, struggled to find new economic growth following the massive industry restructuring and closure of enterprises due to their low level of competitiveness in the post-Soviet era. Source: L.M. Kuzmenko, M.O. Soldak, Mono-functional cities: Problems, support provision and development, 2010. CHAPTER 1 The urban system: Demographics and Economic Trends BOX 1 – MONO-FUNCTIONAL CITIES SYSTEM 16 Ukraine_2015_nov26.indd 16 2015-11-26 5:14 PM
  • 39.
    15 Paul R.Magocsi, A History of Ukraine: The Land and Its Peoples, 2nd ed., 2010. Ukraine’s major urban agglomerations emerged between 1957 and 1979. The city of Kyiv hit the one million-inhabitant mark in 1957, followed by Kharkiv in 1962 and Odessa in 1974. By 1976, Kyiv had already two million inhabitants, and by 1979, Dnipropetrovsk and Donetsk counted more than a million residents. Urbanization was rapid; while in 1959, Soviet Ukraine had only 25 cities with more than 100,000 inhabitants, by 1979 it had 46 such cities15 . At the same time, internal migration was very restricted by regulations such as the “propiska” system, (name of the registration system during soviet times, a brief review is included in Box 2) which made it very difficult for residents of the former Soviet Union to move within the country. Internal migration policies were relaxed only after the country entered the post-Soviet transition. Between 1935 and 1974 there was a de facto ban on mobility of rural inhabitants. Only in 1974 were residents of collective farms that had the name of kolkhoz able to obtain passports. Prior to that date, they had no national documents and could not leave their place of residence without fear of criminal prosecution. One of the main restrictions for internal mobility in Ukraine was the propiska system, (the registration system in the Soviet countries) developed in the 1930s to serve as both a residency permit and a tool to monitor migration in the Soviet Union. The name propiska literally means an inscription and in this case, alludes to the inscription in a state internal passport permitting a person to reside in a given place. Propiska was documented in local police (Militsiya) registers and certified by a stamp made on internal passports. Official permission from local authorities was required to register one’s residence or change of residence; residing anywhere without a propiska was prohibited until the collapse of the USSR. Beginning in 1933, an additional feature of the propiska system was the existence of separate passports for residents of the so-called “regime” places, which were settlements where it was practically impossible for an outsider to receive a passport and, therefore, the required propiska. The state authorities exercised full control over the issuance of passports and propiska in this places. The first “regime” places were Kyiv, Odessa, Dnipropetrovsk, and Donetsk (then known as Stalino). Later on, other cities were added. By 1953, there were 340 “regime” cities, locations, and railway connections. Ukraine officially discontinued the institution of propiska with the adoption of a new regulation on identification documents on September 2, 1993. However, in practice there was little difference between the old Soviet system of propiska and the newly-adopted regulation system. In 2004, after years of debate, the Law on the Right to Freedom of Movement and Choice of Place of Residence came into effect replacing the old registry system. Human rights groups stressed that a major difference between the propiska system and the new system of registration, which is required by law, is that a person may live, work, and receive services anywhere in the country. The rationale for the law was not based on denial of services; there was no indication that individuals were denied access to services because they were not registered in the locality where they resided. However, the new system still has some rigidities that makes it difficult to “de-register” when selling property and “register” while buying new property (buyers need to present proof of prospective place of residence while receiving certificate of “de- registration” from the old residence, which is not always feasible). Sources: Immigration and Refugee Board of Canada, Ukraine: Information on whether the residence permit (propiska) system still exists, 1992; Court Abolishes Propiska Law, Kyiv Post, 29 November 2001, available at http://www.kyivpost. com/content/ukraine/court-abolishes-propiska-law.html; Evgenija Navrotskaja, Roma and propiska in Ukraine, 3 April 1999, available at http://www.errc.org/article/roma-and-propiska-in-ukraine/593; Immigration and Refugee Board of Canada, Responses to Information Requests: UKR42598.E, available at http://www.irb-cisr.gc.ca/Eng/ResRec/RirRdi/Pages/index. aspx?doc=445385; United Kingdom, Home Office, Country of Origin Information Service, Country of Origin Information Report: Ukraine, available at http://www.justice.gov/eoir/vll/country/uk_cntry_assess/2006/ukraine0606.pdf CHAPTER 1 The urban system: Demographics and Economic Trends BOX 2 – EVOLUTION OF THE PROPISKA SYSTEM 17 Ukraine_2015_nov26.indd 17 2015-11-26 5:14 PM
  • 40.
    Ukraine’s system ofcities was developed during the Soviet period; as such, their emergence and growth was developed in a centralized way and was not based on market principles. The demand and supply of housing and other resources and services was rigid and highly regulated. The dominant approach was development based on economy of scale, narrow specialization of individual industrial cities, and extensive co-operation among cities and their metropolitan areas. The territory of the USSR was divided into economic macro-regions hosting a limited number of specialized industrial cities that would have self-sufficient industries and infrastructure (electricity, water, roads, etc.). With the fall of the Soviet Union and the introduction of market forces, it became evident that, from a spatial point of view, many of its cities had been developed in places where they should not have been. For example, many cities had no rural hinterland to rely on for daily food needs and therefore depended on the supply of subsidized goods. Further, many of the industrial cities in the Eastern Region were highly dependent on raw materials and subsidized energy provided by other Soviet Republics were not competitive internationally once borders were opened. Mono-functional cities, which depended economically on a single or a few industries, were particularly vulnerable to this. While the fall of the Soviet Union brought the opportunity to move towards a more efficient settlement system, policies implemented during the transition period re-enforced barriers for internal mobility within Ukraine. During that period, ownership of dwellings was transferred to the occupants with little or no cost, resulting in a high home-ownership rate—occupants owned 95 percent of households in 2012, according to a World Bank estimate16 . Ukraine’s internal migration and urbanization process and the reorganization of Ukraine’s urban system will be examined in the following sub-sections. Ukraine’s people do not always move to economic opportunity Migration to and between urban areas is an indication that people are looking for better labor opportunities, and is a sign of an efficient re-organization of human resources within a country. Achieving economic growth and improving living standards require connecting or bringing people from places that are lagging or declining to places with economic opportunities17 , an essential element to promote Ukraine’s development. The most notable characteristic of internal migration after the collapse of the Soviet Union is a decrease in the volume of movement. However, a caveat is necessary when comparing internal migration in the USSR and subsequent internal migration in Ukraine, especially in the first several years after independence. The termination of the obligatory practice of distributing higher educational institutions’ graduates across the USSR, as well as the broader economic troubles of the 1990s (unemployment, high housing prices, restriction of access to higher education due to high cost, increases in transport tariffs, etc.), led to a decrease in the number of internal migrants. In addition, there was a surge in external migration, mainly due to the relocation of people between the republics of the former Union, which was only recently classified as internal migration. After the mid-1990s, the country’s economic performance improved and internal migration increased slightly18 . A final caveat to consider about migration data is that official statistics might not show the entire picture of internal migration, as many people remained outside the radar of registration but moved through the country. Recent studies of internal migration in Ukraine reveal that few people are moving to seek new economic opportunities. A 2012 World Bank report on that theme shows that Ukraine migrants are not leaving areas with lagging labor opportunities 16 World Bank, In Search of Opportunities: How a More Mobile Workforce Can Propel Ukraine’s Prosperity, 2012, available at https:// openknowledge.worldbank.org/bitstream/handle/10986/12268/NonAsciiFileName0.pdf?sequence=1 17 The World Bank’s World Development Report 2009: Reshaping Economic Geography provides an extensive policy oriented discussion about the aspects that make urban conditions optimal for the increase of productivity. 18 European Commission and GVG, Social Impact of Emigration and Rural-Urban Migration in Central and Eastern Europe, Final Country Report: Ukraine, 2012, available at ec.europa.eu/social/BlobServlet?docId=8820langId=en CHAPTER 1 The urban system: Demographics and Economic Trends 18 Ukraine_2015_nov26.indd 18 2015-11-26 5:14 PM
  • 41.
    as fast asthey should19 , and that they are not necessarily going to regions with better job conditions. Instead, their movement seems to be catalyzed by low levels of social spending in their home regions20 . The study suggests that the internal migration rate is half of what might be expected from a country like Ukraine. In addition, an ILO study of migrants in 2013 found that those who are moving are predominantly male and young; although they make up only 22 percent of the population, migrants aged 15-29 years comprised over 50 percent of internal migrants that year21 . In Ukraine, migrants are predominantly from the age cohort of 15-29 years. The number of people who have higher education in Ukraine is relatively high and migration to the main education centers of Kyiv, Kharkiv, Lviv, Odessa, and Donetsk is common as well as to several dozen smaller centers. These young educated people tend to stay in the big centers as they are attracted by bigger labor market and better opportunities. Further, as there is little support infrastructure for entrepreneurs beyond the large cities, it is easier to work in these centers with the minimum set of support instruments. The 2010 Housing Market and Labor Mobility study describes the average renter of accommodation in Ukraine as someone in their 20-30s, with one or fewer children, and an average salary of about 1200 USD. By contrast, people with families and generational obligations are more static, and in even more so in inter-generational settings, where earners take care of not only children but also elderly relatives. Some of the main barriers to internal migration in Ukraine are: (i) the lack of access to credit and underdevelopment of the housing and mortgage market; (ii) the costs of moving to economically vibrant regions in the country; and (iii) the high transaction costs of moving. First, there are poor financial options and access to credit necessary to encourage internal labor migration. Well-functioning credit markets can help finance mobility and housing arrangements, but in Ukraine they are underdeveloped, leading to high out-of-pocket payments from households’ savings or borrowing from relatives, friends, or informal intermediaries to cover the costs of migration from one place to another22 . Second, there is a very limited rental market as well as significant price differentials across the regions of Ukraine, with considerably more expensive housing in the leading regions than in the lagging regions. This makes it difficult for people in lagging regions (e.g., Zaporizhzhya and Zakarpatska oblasts) to sell their houses and move to areas with improved job opportunities, but with higher housing costs23 . Lastly, while the propiska registration process (described in detail in Box 2) was reformed in 2004, it is still difficult to obtain residency for migrants in their new destination. Ukraine continues to urbanize despite its population decline The limited internal movement is reflected in a continued but more or less static “urbanization” of the population. In fact, despite its rapid population decline, Ukraine continues to slowly “urbanize.”24 As discussed in the demographics section, both urban and rural populations have decreased over the past two decades. However, population decline has been higher in rural areas, which has caused urbanization levels to continue to slowly increase (see Figure 14 below). We need to distinguish between the level of urbanization and the share of population living in the cities, since this last one is the passive number which depends on the whole number of population, which is the case for Ukraine. CHAPTER 1 The urban system: Demographics and Economic Trends 19 Based on the concept of efficient mobility of people for development. 20 In Search of Opportunities, 2012. 21 International Labour Organization, Report on the methodology, organization and results of a modular sample survey on labour migration in Ukraine, 2013. 22 Koettl, J., et. al., In Search of Opportunities? The Barriers to More Efficient Internal Labor Mobility in Ukraine, Institute for the Study of Labor, 2014. 23 As examples, leading regions include Kiev and Donetsk (before the conflict), while lagging regions include Zaporizhzhya and Uzhgorod. 19 Ukraine_2015_nov26.indd 19 2015-11-26 5:14 PM
  • 42.
    24 Usually, urbanizationis understood as growth in the urban population, which causes an increase in the urban/rural population ratio. In the case of declining population, like the case of Ukraine, urbanization can be understood as the increase of the urban/rural population ratio despite the decline of both urban and rural population—so long as the rural population is declining faster. CHAPTER 1 The urban system: Demographics and Economic Trends Figure 14 – Both urban and rural populations declined between 1989 and 2011; yet the country continues to urbanize Source: Ukraine Statistics Department However, there are some differences in urbanization trends among the regions over the past two decades (see Figure 16). The Eastern and Southern regions were already highly urbanized in 1989 – with 84 percent and 70 percent of their populations living in urban areas respectively. These regions maintained a more or less stable urbanization level over the 1989-2011 period as their urban populations declined at similar rates as their rural populations (See Figure 15). The Central and Western regions were the least urbanized in 1989 with 60 and 45 percent of their populations living in urban areas respectively. However, the Western region’s urbanization levels remained more or less stable, while the Central region continued to slowly urbanize reaching 67 percent urbanization by 2011 (by contrast, the Western region shows the lowest urbanization level of all regions in 2011 at 49 percent). This was possible because the Central region’s urban population remained more or less stable as its rural population continued to decline. Urban Population Urbanization Rural Population Population(millions) Urbanization% 50 40 30 20 10 80 70 60 50 1990 1995 2000 2005 2010 Urbanization trends in Ukraine 1989-2011 In 1989, 66 percent of Ukraine’s population lived in urban areas. Between 1989 and 2001, the rural population decreased from 17 million to 16 million (a 6 percent decline), while the urban population fell from 34 million to 33 million (a 4 percent decline). The interaction of these dynamics resulted in an increase of 1 percent in Ukraine’s urbanization to 67 percent in 2001. Between 2001 and 2011, the rural population further dropped to 14 million (a 10 percent decline), while the urban population itself fell further to 31 million (a 4 percent decline). As a result, in 2011 the urbanization level rose to 68 percent. On average, this shows a steady growth of urbanization levels of approximately 0.15 percent per year since 1989. 20 Ukraine_2015_nov26.indd 20 2015-11-26 5:14 PM
  • 43.
    CHAPTER 1 Theurban system: Demographics and Economic Trends Figure 15 – There are strong differences among urbanization levels across the regions Figure 16 – Population dynamics are heterogeneous across Ukraine’s regions. In all cases, however, population declines yield increased urbanization rates Source: Ukraine Statistics Department Source: Ukraine Statistics Department Population(millions) Urbanization% Western Eastern Central Southern 15 10 5 0 80 60 40 20 0 80 60 40 20 0 15 10 5 0 1990 19901995 19952000 20002005 20052010 2010 Urban Population Urbanization Rural Population Western Eastern Central Southern 0 -.5 -1 -1.5 70 50 70 50 0 -.5 -1 -1.5 Urbanizationrate(%) %change 2000 20002011 2011 Urban pop change Rural pop change Total pop change Urbanization Graphs by region 21 Ukraine_2015_nov26.indd 21 2015-11-26 5:14 PM
  • 44.
    CHAPTER 1 Theurban system: Demographics and Economic Trends A slowly evolving system of cities Ukraine has 458 cities25 that serve as the urban element of basis for an analysis of Ukraine’s settlement system. As previously mentioned, of these, Kyiv and Sevastopol until 2013, had the same administrative status as the other 24 Oblasts; 182 are cities of Oblast significance, which have the same autonomy as Raions; and 276 cities are subordinated to Raions. Figure 17 below presents the spatial distribution of Ukraine’s cities and their population in 2013. Ukraine is much more densely urban in the Eastern region, which has a significant number of cities concentrated near the Russian border (see Figure 17). By contrast, the density of cities is much lower in the Western region, which also has a large number of small towns (less than 10,000 inhabitants). This is partly a reflection of the lower levels of urbanization of the Western region as well as the high levels of urbanization found in the Eastern region (as discussed in the previous sub-section). The Southern region has a significant number of cities with population between 50,000 and 100,000 as well as fewer smaller cities. 25 Two additional cities, Chernobyl and Pripyat, are not considered as part of the urban system as they have been abandoned due to radiation contamination in the aftermath of the accident at the Chernobyl nuclear power station in 1986. Figure 17 – Distribution of cities across Ukraine Source: Ukraine Statistics Department City Population, 2013 Population Estimated, 2013 0 - 10,000 10,001 - 20,000 20,001 - 50,000 50,001 - 100,000 100,001 - 500,000 500,000 22 Ukraine_2015_nov26.indd 22 2015-11-26 5:14 PM
  • 45.
    CHAPTER 1 Theurban system: Demographics and Economic Trends While most Ukrainian cities have less than 20,000 inhabitants, the majority of the urban population26 lives in cities having more than 100,000 inhabitants (see Figure 18 and Figure 19). In fact, some 34 percent of the urban population is concentrated in just eight urban centers (Kyiv, Kharkiv, Odessa, Dnipropetrovsk, Donetsk, Zaporizhzhia, Lviv, and Kryvyi Rih). Moreover, if the population living in the functional urban area of these eight cities were counted, it would comprise an even larger percentage of Ukraine’s urban population (62 percent), as each of these urban centers is at the core of significant urban agglomerations. 26 For this analysis, the urban population is the population located in the 458 cities identified in the Ukrainian urban system. 27 TIn this case larger than what would be indicated by a Zipf law. See Gabaix, X. Zipf’s Laws for Cities: An Explanation, The Quarterly Journal of Economics, 1999. Figure 18 – Ukraine has a high percentage of small and mid-sized towns 2013 Figure 19 – Most of the urban population is concentrated in eight major cities 2013 Source: Ukraine Statistics Department Source: Ukraine Statistics Department The Western region has many small towns with less than 10,000 inhabitants (Figure 20), but most of the urban population lives in mid-sized cities. In the other three regions, major urban centers account for a larger amount of the urban population as they have a large number of mid-sized and large cities. Table 3 shows the five largest urban centers for each region. The Western and Central regions show a pattern where one city comprises a much larger percentage of the population than the next four largest of the region’s cities27 . A similar pattern is observed in the Eastern and Southern regions, but here the difference between the largest and the following cities is smaller. 2% 15% 35% 27% 12% 9% Small towns (10k) Mid-size towns (10k-20k) Large towns (20k-50k) Small cities (50k-100k) Mid-size cities (100k-500k) Major cities (500k) Small towns (10k) Mid-size towns (10k-20k) Large towns (20k-50k) Small cities (50k-100k) Mid-size cities (100k-500k) Major cities (500k) Percentage of cities in each category Population in each category 2% 8% 34% 13% 11% 32% 23 Ukraine_2015_nov26.indd 23 2015-11-26 5:14 PM
  • 46.
    Oblast City Population2013 Region Percentage of region’s population Lviv Lviv 730272 Western 16.0 Khmelnytskyi Khmelnytskyi 264988 Western 5.8 Chernivtsi Chernivtsi 258842 Western 5.6 Rivne Rivne 250333 Western 5.4 Ivano-Frankivsk Ivano-Frankivsk 226018 Western 4.9 Kharkiv Kharkiv 1451028 Eastern 20.6 Donetsk Donetsk 953217 Eastern 13.5 Donetsk Mariupol 461810 Eastern 6.5 Lugansk Lugansk 425848 Eastern 6.0 Donetsk Makiivka 353918 Eastern 5.0 Kyiv Kyiv 2757900 Central 34.0 Vinnytsia Vinnytsia 371698 Central 4.5 Poltava Poltava 296852 Central 3.6 Chernihiv Chernihiv 296089 Central 3.6 Cherkasy Cherkasy 285605 Central 3.5 Odessa Odessa 1014852 Southern 13.1 Dnipropetrovsk Dnipropetrovsk 997754 Southern 12.8 Zaporizhzhia Zaporizhzhia 770672 Southern 9.9 Dnipropetrovsk Kryvyj Rih 656478 Southern 8.4 Mykolaiv Mykolaiv 496188 Southern 6.4 CHAPTER 1 The urban system: Demographics and Economic Trends Table 3 – Five largest urban centers in each region by population in 2013 Source: Ukraine Statistics Department 24 Ukraine_2015_nov26.indd 24 2015-11-26 5:14 PM
  • 47.
    CHAPTER 1 Theurban system: Demographics and Economic Trends Figure 20 – The Western region has the greatest number of small towns. Also, its urban population lives mostly in mid-sized cities (100-500k) Source: Ukraine Statistics Department Small towns (10k) Mid-size towns (10k-20k) Large towns (20k-50k) Small cities (50k-100k) Mid-size cities (100k-500k) Major cities (500k) Small towns (10k) Mid-size towns (10k-20k) Large towns (20k-50k) Small cities (50k-100k) Mid-size cities (100k-500k) Major cities (500k) Percentage of cities in each category Percentage of population in each category 100% 90% 80% 70% 60% 50% 40% 30% 20% 10% 0% 100% 90% 80% 70% 60% 50% 40% 30% 20% 10% 0% Western Western Eastern Eastern Central Central Southern Southern Ukraine Ukraine 25 Ukraine_2015_nov26.indd 25 2015-11-26 5:14 PM
  • 48.
    Between 1989 and2001, Ukrainian cities in all size categories saw a significant decline in their population, on average 6.3 percent of their population (See Figure 21). Small cities – having a population between 50,000 and 100,000 in 1989, were the most affected category over the 1989 – 2001 period, losing on average 7.4 percent of their population. Over this period, mid- sized cities with populations of 100,000-500,000 inhabitants fared better, losing less population than any of the other categories. Over the subsequent 2001-2013 period, cities continued to lose population at more or less same rate, although the situation was worse for Smaller Cities. Also, over this period more Small Towns were shrinking and the category as a whole was losing population at a higher rate than the average across the urban system with 75 percent of small towns losing population. Mid-size towns also experienced greater declines than the urban system average. On average, Major Cities did better than Small Cities or Small Towns, but the situation was mixed when looking at individual cities. In fact, when limiting the analysis to administrative divisions, among the 15 largest cities only Kyiv, Sevastopol, and Vinnytsia grew over the last decade. Among large cities, Kyiv consolidated itself as the country’ growth center, and remains the main recipient of the cross-regional exchange of population. For Kyiv, the inflow of migrants provides enough of an increase in population to compensate for natural population decline. Population growth due to internal migration can also be observed in the largest industrial regions of Ukraine (Kharkiv and Dnipropetrovsk Oblasts)28 . Kyiv Oblast and the neighboring Chernihiv and Zhytomyr Oblasts are the main suppliers of labor migrants to Kyiv city. Odesa oblast, known for its opportunities in seasonal employment in both agriculture and recreational spheres, also attracts a significant number of internal labor migrants. Among other regions supplying labor migrants (beside Kyiv, Chernihiv, and Zhytomyr oblasts supplying labor migrants for the capital), Ivano-Frankivsk Oblast yields a significant number of migrants for work in Lviv and Kyiv29 . Relative to the population patterns observed in individual cities, agglomerations30 fared much better. The largest agglomeration, formed around Kyiv, has grown steadily since 1989, so that it is the largest urban center in Ukraine. It is also the fastest growing one, with total population growth of 7.2 percent between 2001 and 2013. Tables 4 and 5 contrast the performance of the 15 largest individual cities in Ukraine, where three registered growth, and the 15 largest urban agglomerations, where six had positive population growth in the last decade. Even more important, if we look at all the cities in the country, individual cities that showed positive population growth are, in a significant majority of cases, cities that are part of a larger agglomeration - either as centers themselves or as part of an agglomeration’s periphery. When ranked by order of population growth between 2001 and 2013 (see Table 6), eleven out of the fifteen fastest growing cities in the country were part of an agglomeration. 28 European Commission and GVG, Synthesis Report: Social Impact of Emigration and Rural-Urban Migration in Central and Eastern Europe, VT/2010/001, June 2012. 29 European Commission and GVG, Synthesis Report: Social Impact of Emigration and Rural-Urban Migration in Central and Eastern Europe, VT/2010/001, June 2012. 30 Agglomerations are defined using Night Lights data and are formed by cities that in 2013 had a merged Night Lights urban footprint. See Box 3 and the subsequent discussion in Section 4. CHAPTER 1 The urban system: Demographics and Economic Trends 26 Ukraine_2015_nov26.indd 26 2015-11-26 5:14 PM
  • 49.
    CHAPTER 1 Theurban system: Demographics and Economic Trends Figure 21 – All categories of cities in Ukraine are losing population Source: Ukraine Statistics Department Small towns (10k) Mid-size towns (10k-20k) Large towns (20k-50k) Small cities (50k-100k) Mid-size cities (100k-500k) Major cities (500k) Average loss over the cities Small towns (10k) Mid-size towns (10k-20k) Large towns (20k-50k) Small cities (50k-100k) Mid-size cities (100k-500k) Major cities (500k) 0.0 -1.0 -2.0 -3.0 -4.0 -5.0 -6.0 -7.0 -8.0 1989-2001 1989-2001 2001-2013 2001-2013 Average population growth (decline) Percentage of cities losing population 100% 90% 80% 70% 60% 50% 40% 30% 20% 10% 0% 27 Ukraine_2015_nov26.indd 27 2015-11-26 5:14 PM
  • 50.
    CHAPTER 1 Theurban system: Demographics and Economic Trends Agglomerations are groupings of individual cities that function as a single city due to the proximity of and interaction between their housing, labor and commercial markets. People might work in one city in the agglomeration and live in another one. These cities usually have separate geographic and political boundaries and had their markets initially separate as well, but they became agglomerated as the cities grew. Satellite night lights can be used to trace the evolution of urban ‘footprints,’ which may merge and form an agglomeration (see Section 4 below). In total, Ukraine has 23 agglomerations that are composed of 79 cities, approximately four cities per agglomeration. The figure below presents Kyiv’s agglomeration and the growth of its night light urban footprint between 1996 and 2010. Some of the cities separate from Kyiv in 1996 have grown to become a single urban footprint in 2010. Figure – Kyiv urban agglomeration (between 1996 and 2010) BOX 3 – DEFINITION OF AGGLOMERATION USING NIGHT LIGHTS SATELLITE IMAGING 01 2.5 25 75 100 Kilometers 1996 2010 Chernihiv 28 Ukraine_2015_nov26.indd 28 2015-11-26 5:14 PM
  • 51.
    CHAPTER 1 Theurban system: Demographics and Economic Trends City Rank 2013 Rank 1989 Population 1989 Population 2013 e Change 1989-2001 Change 2001-2013 Oblast Region Kyiv 1 1 2,572,212 2,757,900 -0.2 7.4 Kyiv Central Kharkiv 2 2 1,609,959 1,451,028 -8.6 -1.4 Kharkiv Eastern Odessa 3 4 1,115,371 1,014,852 -7.7 -1.4 Odessa Southern Dnipropetrovsk 4 3 1,215,941 997,754 -9.2 -9.6 Dnipropetrovsk Southern Donetsk 5 5 1,109,102 953,217 -8.4 -6.2 Donetsk Eastern Zaporizhzhia 6 6 883,909 770,672 -7.5 -5.8 Zaporizhzhia Southern Lviv 7 7 790,908 730,272 -7.3 -0.3 Lviv Western Kryvyj Rih 8 8 739,139 656,478 -7.2 -4.3 Dnipropetrovsk Southern Mykolaiv 9 9 522,343 496,188 -1.6 -3.5 Mykolaiv Southern Mariupol 10 10 518,933 461,810 -5.2 -6.2 Donetsk Eastern Lugansk 11 11 496,813 425,848 -6.8 -8.0 Lugansk Eastern Vinnytsia 12 13 374,304 371,698 -4.7 4.2 Vinnytsia Central Makiivka 13 12 430,201 353,918 -9.4 -9.2 Donetsk Eastern Sevastopol 14 14 356,123 342,580 -3.8 0.0 Sevastopol Southern Simpheropol 15 16 343,565 337,285 0.0 -1.9 Crimea Southern Table 4 – Ranking of Ukraine’s 15 largest cities by population Source: Ukraine Statistics Department 29 Ukraine_2015_nov26.indd 29 2015-11-26 5:14 PM
  • 52.
    Agglomeration Rank 2013 Rank 1989 Population 1989 Population 2013 Change 1989-2001 Change 2001-2013 Oblast Region # Cities Kyiv 11 2946438 3171833 0.5% 7.2% Kyiv Central 11 Kharkiv 2 2 1818712 1620927 -8.8% -2.2% Kharkiv Eastern 7 Donetsk 3 3 1783774 1506202 -8.9% -7.3% Donetsk Eastern 8 Dnipropetrovsk 4 4 1648499 1369202 -9.2% -8.5% Dnipropetrovsk Southern 4 Odessa 5 5 1170209 1074570 -7.4% -0.8% Odessa Southern 2 Lviv 6 6 821698 765901 -6.9% 0.2% Lviv Western 4 Alchevsk 7 8 479787 447975 -1.3% -5.4% Lugansk Eastern 3 Lugansk 8 7 504538 432483 -6.8% -8.0% Lugansk Eastern 2 Sevastopol 9 10 368565 354565 -4.2% 0.4% Sevastopol Southern 2 Gorlivka 10 9 479181 353497 -13.6% -14.6% Donetsk Eastern 3 Cherkasy 11 13 310702 303168 1.6% -3.9% Cherkasy Central 2 Kramatorsk 12 11 359593 297665 -8.4% -9.6% Donetsk Eastern 4 Sieverodonetsk 13 12 343124 281903 -9.8% -8.9% Lugansk Eastern 4 Rivne 14 14 255523 274902 7.0% 0.5% Rivne Western 2 Ivano-Frankivsk 15 15 223660 235515 2.0% 3.2% Ivano-Frankivsk Western 2 City Population 2001 Population 2013 Change 2001-2013 Oblast Region Belongs to an agglomeration Agglomeration Dubliany 8469 10240 20.9 % Lviv Western YES Lviv Vynnyky 13654 16278 19.2 % Lviv Western YES Lviv Vyshhorod 22933 26536 15.7 % Kyiv Central YES Kyiv Teplodar 8830 10204 15.6 % Odessa Southern NO Novyi Kalyniv 3582 4105 14.6 % Lviv Western NO Brovary 86839 98250 13.1 % Kyiv Central YES Kyiv Inkerman 10628 11985 12.8 % Sevastopol Southern YES Sevastopol Ukrainka 14163 15644 10.5 % Kyiv Central YES Kyiv Boryspil 53975 59545 10.3 % Kyiv Central YES Kyiv Illichivsk 54151 59718 10.3 % Odessa Southern YES Odessa Rudky 4942 5434 10.0 % Lviv Western NO Pidhorodne 17763 19498 9.8 % Dnipropetrovsk Southern YES Dnipropetrovsk Vyshneve 34465 37457 8.7 % Kyiv Central YES Kyiv Kyiv 2570000 2757900 7.3 % Kyiv Central YES Kyiv CHAPTER 1 The urban system: Demographics and Economic Trends Table 5 – Ranking of Ukraine’s largest urban agglomerations Source: Ukraine Statistics Department Source: Ukraine Statistics Department Table 6 – Ranking of the fastest growing cities in Ukraine 30 Ukraine_2015_nov26.indd 30 2015-11-26 5:14 PM
  • 53.
    Percent Change inPopulation, 2001-2013 Percent Change by city Declining more than national average (less than -6.3%) Declining less than national average (-6.3 to -5.7%) Declining less than urban average (-5.7 to 0%) Growing Cities CHAPTER 1 The urban system: Demographics and Economic Trends The largest cities and agglomerations are distributed differently across the country. Only one city in the Western region is ranked among the fifteen largest individual cities. However, five agglomerations among the fifteen largest are located in this region, as well as four of the fastest growing cities. This suggests that, despite having the lowest urbanization levels, the cities in this region are taking advantage of the economies generated by their agglomeration into large-scale urban regions. By contrast, the Eastern region has five cities among the largest fifteen individual cities, but has none of the fastest growing cities. Finally, the agglomeration patterns are much more concentrated in the Central region, led by Kyiv’s agglomeration which gathers 11 individual cities. Figure 22 below plots the location of Ukraine’s cities and agglomerations (agglomerations are labeled with the name of the main city in them) with colors assigned according to their population growth rate. Again, this graph shows a strongly declining Eastern region, despite the fact it contains a large number of agglomerations. The West, by contrast, shows a higher concentration of growing cities as well as cities that are at least declining less than the averages for urban population and overall national population. The significance of Kyiv’s agglomeration and its pattern of growth are also noticeable here. Figure 22 – Ukrainian cities with growing or declining population 2001-2013 Source: Ukraine Statistics Department 31 Ukraine_2015_nov26.indd 31 2015-11-26 5:14 PM
  • 54.
    Key messages andimplications for further policy and analytical work The current dynamics in Ukraine’s urban system remain highly influenced by its origins in the Soviet system. At the time, urban development was seen as a tool for the higher national objective of achieving socio-economic equality. This approach, however, had other consequences too. A rigid, centrally defined decision-making process led to situations where population was not always directed towards the most efficient cities. Many cities were developed based on industries that survived on demand by and subsidies from the central government. This system left many cities unprepared for the market economy system adopted following Ukraine’s independence. The consequences of Ukraine’s urban development policies implemented during the Soviet and transition period continue to affect the country and prevent its urban system from achieving its full potential. For example, extremely high home-ownership rates of the Soviet era limited the development of a rental market and, thereby, increased the relative cost of mobility. In addition, continued obstacles such as lack of access to finance and high transaction costs further threaten the benefits of potential efficiencies from internal migration. As a result Ukraine’s people are not always moving to economic opportunities. Urbanization in Ukraine continues to rise despite an overall decline in the urban population. This phenomenon is occurring because the country’s rural population is decreasing at an even faster rate than its urban population. Yet urbanization patterns are not homogeneous across the territory of Ukraine. The Eastern and Southern regions are highly urbanized, but have shown slower urbanization rates in the last two decades, while the historically rural Western region currently shows faster urbanization rates. Most cities in Ukraine are shrinking while urban agglomerations are concentrating the little urban growth currently witnessed in the country. Cities in all regions, especially smaller ones, have been losing population, mostly to the largest cities, and usually to those that have formed large urban centers, or agglomerations. The growth of agglomerations is indicative of a movement towards a more efficient urban system. Led by the Kyiv agglomeration, these city clusters hold the large majority of the cities that are actually growing in population (i.e., eleven out of fifteen fastest growing cities in the country belong to an agglomeration). This growth might be explained by the fact that these larger groups of cities can through their agglomeration produce efficiencies by sharing costs, increasing access to and the size of their markets, and strengthening productivity by enhancing interactions between citizens and firms. Going forward, Ukraine should reduce barriers to move internally. Low mobility of Ukraine’s internal population is an obstacle preventing the country from reaping the rewards of its urban potential. An improved mobility might further spur the growth of certain urban centers with emerging employment opportunities. However, increased mobility most likely will also deepen the decline of most Ukrainian cities, which would require policies to protect the less mobile and more vulnerable population that is left behind. Increasing population mobility will require eliminating or smoothening some of the obstacles to move including making the housing market more fluid and permeable (e.g. increase rental options, improve access to housing finance) and lowering the transaction costs of moving. In addition, as outlined in the World Development Report 200931 Governments should be neutral in regards to migration of unskilled labor, encouraging migration for economic reasons and discouraging migration in search of public services; and strongly supportive of internal migration of skilled labor. The later can be done through investment in services in peripheral areas to build portable human capital and increasing the flow of labor market information, among others, so migrants arrive better informed of employment opportunities. 31 World Bank (2009), Reshaping Economic Geography – World Development Report. CHAPTER 1 The urban system: Demographics and Economic Trends 32 Ukraine_2015_nov26.indd 32 2015-11-26 5:14 PM
  • 55.
    CHAPTER 1 Theurban system: Demographics and Economic Trends In addition, the country needs to put in place the right policies to better manage the population decline of most of its cities while catering to manage growth in large agglomerations. On the one hand, shrinking cities will need to adapt their infrastructure, the way their services are financed and delivered, and consolidate their footprint. The Central Government should in turn create the right mechanisms and incentives (e.g. financial transfers) so that cities focus on declining efficiently (e.g. agglomerating schools when needed). Given the extent of urban decline, the country should explore the need of establishing national level programs, such as technical assistance and funds for downsizing, that provide resources to better manage decline. There is also a need to increase awareness of the scale and type of urban decline as many cities continue to follow unrealistic population growth projections. On the other hand, growing centers need to focus on adapting infrastructure and services making sure that new-comers are well absorbed and integrated in the city; manage peri-urban growth to avoid sprawl, etc. In addition, the realignment of city boundaries or introduction of metropolitan governance mechanisms might be needed to achieve an effective coordination in agglomerations which span across administrative units. This is particularly important in the case of public transport. 33 Ukraine_2015_nov26.indd 33 2015-11-26 5:14 PM
  • 56.
    CHAPTER 1 Theurban system: Demographics and Economic Trends Trends in Ukraine’s economic performance The economic conditions and institutions that Ukraine inherited from its time as a Soviet republic strongly influenced the evolution of its economy in the decades following the Soviet Union’s collapse. As part of the Soviet Union, the country’s economy was centered on the production of intermediate goods that used raw materials and energy from other republics. The major sectors were steel production, oil processing, coal mining, and other chemical industries. Agricultural production was also important, with wheat, corn, and sugar beets as the main crops. Almost all factories were state-owned and were very large, leaving an industrial infrastructure that was not competitive and quite inflexible when the market system was introduced in the 1990s. In the late 1980s, state enterprises accounted for almost 100 percent of all industrial production in the regions of Soviet Ukraine33 . With the domestic and international changes in the Soviet Union from 1989, Ukraine’s economy went into deep recession until 1998. This was mainly driven by radical changes in political governance, a market that struggled to adapt to new competition, sub-optimal macro-economic conditions, and an agricultural sector that declined despite the support of subsidies. Ukraine had large manufacturing plants, but suddenly no sure source of raw materials and energy. In addition, the demand for military goods decreased. Among the transformations faced by the country’s economic institutions were more open borders and increased competition from international goods34 . However, liberalization was not uniform; Eastern Ukraine kept a larger share of state-owned enterprises, while most private enterprises were located in the Western Ukraine35 . At the same time, despite heavy government subsidies, agricultural output declined by 35 percent between 1990 and 1995. Collective cooperatives and state-owned farms, a legacy from the Soviet period, continued to dominate the sector; private ownership was allowed, but lack of capital, social attitudes, and the high cost of fuel discouraged it. These dynamics were exacerbated by a period of hyper-inflation during 1993-9436 . Since 1998 and until the recent conflict, Ukraine has experienced a steady increase in its total GDP (See Figure 23). In 1998, supported by the devaluation of the Hryvnya, Ukraine’s economy started to recover. This movement was led by growth in import-substituting (textiles and food) and export-oriented industries (metallurgy and chemicals). The recovery was interrupted in 2008, due to the effects of the Global Financial Crisis, but the halt lasted only one year37 , with GDP returning to growth until it was halted again by the recent conflict. III. Regional Economic Trends32 32 In providing a regional overview of the country, this document uses the description of four geographic regions developed by the Kiev International Institute of Sociology: East, Center, South, and West. 33 Ivan Katchanovski, Social Capital and Privatization in Regions of Ukraine, Paper prepared for Presentation at the Annual World Convention of the Association for the Study of the Nationalities, Columbia University, New York, April 5-7, 2001, available at http://individual.utoronto.ca/ ikatcha1/PrivatizationASN.pdf. 34 Vlad Mykhnenko, The Post-Communist State and Capitalism in Transition: Towards a Complementary Relationship, Paper for the Havighurst Centre 4th Annual Young Researchers Conference, ‘The Problems of the Post-Communist State’, The Havighurst Centre for Russian and Post- Soviet Studies, Miami University, Oxford, Ohio, USA, 5-6 November 2004, available at http://www.cas.miamioh.edu/havighurstcenter/papers/ Young%20Researchers%2004/Mykhenko.pdf 35 Social Capital and Privatization in Regions of Ukraine, 2001. 36 Andrey Androshchuk, “Transition Economies: A Look at Russia, Ukraine and Poland,” Honors College Theses, Paper 32, 2006, available at http://digitalcommons.pace.edu/honorscollege_theses/32. 37 The recovery was quicker than most expected; the World Bank forecasted a decrease between 9 to 15 percent in 2009 for Ukraine. It is important to note that most of the impact was in the area of foreign trade of goods and services, an area not reflected in the Gross Regional Product. This indicator is used to compare production levels at the regional or oblast level. 34 Ukraine_2015_nov26.indd 34 2015-11-26 5:14 PM
  • 57.
    CHAPTER 1 Theurban system: Demographics and Economic Trends Figure 23 – Real GDP decreased sharply after Ukraine’s departure from the Soviet Union (1991-1998) and experienced a slow recovery lasting until the recent conflict (1999-2012) Source: World Development Indicators, 2015. The World Bank GDP GDP per capita also increased steadily from 1998 until the Global Financial Crisis (See Figure 24) but this is partly due to the decline in population over the analyzed period. In fact, after a short and sharp drop in response to the Global Financial Crisis of 2008, the growth in GDP per capita accelerated to return to pre-Crisis levels in 2012. This steep growth rate in GDP per capita – steeper than the one observed in the overall growth in GDP - is partly due to the overall decline in the country’s population. However, given the demographic transition the country is experiencing (discussed in Section 1), the positive dynamics in GDP output per capita should be viewed with cautious optimism as the decline in population could reverse the trend in the medium and long term. A review of trends in poverty can be observed in Box 4. Figure 24 – GDP per capita grew steadily from 1998 until the global financial crisis 140 B 120 B 100 B 80 B 60 B 40 B 20 B 0 1988 1990 1992 1994 1996 1998 2000 2002 2004 2006 2008 2010 2012 Soviet Union Conflict Global Financial Crisis Recovery 4500 4000 3500 3000 2500 2000 1500 1000 500 0 160 140 120 100 80 60 40 20 0 1987 1989 1991 1993 1995 1997 1999 2001 2003 2005 2007 2009 2011 2013 GDP per capita (current US$) GDP (constant 2005 US$) billion Source: Ukraine Statistics Department 35 Ukraine_2015_nov26.indd 35 2015-11-26 5:14 PM
  • 58.
    Poverty rates inUkraine have decreased over the last couple of decades. This has been the result of higher GDP per capita growth, but also of policies to redistribute wealth among the population. In fact, between 2006 and 2011 around 75 percent of the poverty reduction was attributed to redistribution. However, inequality indices (Gini; Theil) have decreased only marginally in the last 10 years. Poverty headcount ratio: the proportion of a population that exists, or lives, below the ‘poverty line’. (% of population below the poverty line, vertical axis in this graph). In Ukraine, poverty is mainly a rural phenomenon (80 percent of the poor are in rural areas). The bottom 40 are more equally distributed between urban and rural areas. The decline in poverty in Ukraine, however, may be threatened in the near future by the impact of the recent conflict. CHAPTER 1 The urban system: Demographics and Economic Trends Note: Poor 2.5 urban/rural mean the percentage of people under 2.5 dollars/day poverty line. 2000 2001 2002 2003 2004 2005 2006 2007 2008 2009 2010 2011 2012 70 60 50 40 30 20 10 0 US$ 5.00 US$ 2.50 Projection Survey data Source: ECATSD using ECAPOV. Azevedo and Lomaia (2013) Poverty Headcount Ratio (including projections), 2000-2012 poor 2.50 ruralpoor 2.50 urban percentage urban Urbanizationrate Distributionofpooramong urbanandruralareas Tajikistan Kosovo Bosnia Lithuania KyrgyzRep. Moldova Latvia Estonia Bulgaria Georgia Hungary Albania Kazakhstan Romania Serbia SlovakRep. CzechRep. FYRMacedonia Poland Armenia Montenegro Turkey Ukraine Russia 100% 90% 80% 70% 60% 50% 40% 30% 20% 10% 0% 100% 90% 80% 70% 60% 50% 40% 30% 20% 10% 0% BOX 4 – POVERTY IN UKRAINE 36 Ukraine_2015_nov26.indd 36 2015-11-26 5:14 PM
  • 59.
    38 Information obtainedfrom Arias, Omar S., Carolina Sánchez-Páramo, María E. Dávalos, Indhira Santos, Erwin R. Tiongson, Carola Grun, Natasha de Andrade Falcão, Gady Saiovici, and Cesar A. Cancho, Back to Work: Growing with Jobs in Europe and Central Asia. Washington, DC: World Bank, 2014. Despite the steadily upward trend, Ukraine’s GDP remains significantly below pre-1989 levels. Ukraine’s GDP remains at 65 percent of its 1989 level, and its GDP per capita – standing at USD 6,596 (in 2005 PPP dollars) – is still about half of the Europe and Central Asia (ECA) region average as well as the lowest in Europe with the exception of Moldova. Ukraine has implemented policies and market-oriented reforms aimed at boosting investment, such as Special Economic Zones (See ANNEX 1 for further information on Special Economic Zones), a flat rate personal income tax, and a simplified taxation system for SMEs. However, the country still lags behind the scope and degree of reforms made in most other ECA countries. In particular, Ukraine lags behind peer countries in its transition from a centrally-planned economy to a market economy, as well as on its institutional and business environment reforms (See Figure 25 below). Note: The measurement scale of the indicator ranges from 1 to 4+, where 1 represents little or no change from a rigid centrally-planned economy and 4+ represents the standards of an industrialized market economy. The index covers reform efforts in several areas, including small-scale privatization efforts, enterprise restructuring, price liberalization, and trade and foreign exchange policy. CHAPTER 1 The urban system: Demographics and Economic Trends Figure 25 – EBRD Transition Index (2012) Source: World Bank, PCN For P148768: Ukraine: Skills For Employment And Productivity Estonia Hungary SlovakRep. Poland Latvia Lithuania Bulgaria Croatia Romania FYRMacedonia Slovenia Turkey Albania Georgia Armenia Mongolia KyrgyzRep. Russia Moldova Montenegro Ukraine Serbia Kazakhstan BosniaandHerzegovina Azerbaijan Tajikistan Uzbekistan Belarus Turkmenistan 4.5 4.0 3.5 3.0 2.5 2.0 1.5 1.0 0.5 0 37 Ukraine_2015_nov26.indd 37 2015-11-26 5:14 PM
  • 60.
    Ukraine’s slow structuralshift towards services Duringthedecadeleadinguptotheconflict,thenation’smajorindustrieswereconsistentlymining-related39 , industrial40 , oragricultural. Industrial production has maintained its importance in Ukraine, although its share of the economy has decreased since 2002, from 28 to 25 percent (see Figure 26). Mining, food processing, and machine-building are the dominant sub-sectors of industrial production in Ukraine, which together accounted for almost 60 percent of the total industrial gross value added (GVA) of the country.41 Among these, coal has played a crucial economic role, and as such has been at the center of several important economic policies designed to stimulate the mining industry (See Box 5 below). The agricultural sector also plays an important role in the country’s economic growth as well as its regional development as many small settlements are dependent on agricultural production and/or processing. However, in the 2002-2010 period it has slightly decreased from 14 to 12 percent of the total GVA of the country. In 2012, agriculture contributed nine percent of the Ukraine’s gross GVA and was a significant share of the country’s exports.42 Overall, Ukraine has become one of the top 10 exporters globally for several agricultural commodities such as wheat, corn, sunflower oil, and honey.43 Recently, the services sector has come to lead the country’s economy. The services sector now ranks first among economic sectors, having increased its share of the GVA from 42 to 45 percent from 2002 to 2010. If financial services were added, the services sector would have counted 51 percent of GVA in 2010. The financial services sector itself has become a very important player in the economy; its portion of GVA doubled over the 2002-2010 period from 3 to 6 percent (see Figure 26). Over the same period, the trade sector increased slightly from 12 to 13 percent of the total economy. 39 Coal and electric power, ferrous and nonferrous metals. 40 Machinery and transport equipment, chemicals, and food-processing, 41 Disaggregation into sub-sectors at the level of large-scale firms is possible using AMADEUS, a comprehensive, pan-European database containing financial information on over 11 million public and private companies in 41 European countries. AMADEUS contains data for Ukraine for the years 1997-2009, 42 State Statistics Service, Statistical Yearbook of Ukraine: 2012, 2013, 43 Food and Agriculture Organization of the United Nations (FAOSTAT), Website 2012 at http://faostat.fao.org/site/291/default.aspx, CHAPTER 1 The urban system: Demographics and Economic Trends Figure 26 – GVA shares: the service and finance sectors now lead Ukraine’s economy, but the industrial sector still occupies a prominent place Source: Ukraine Statistics Department 100% 90% 80% 70% 60% 50% 40% 30% 20% 10% 0% Ukraine 2002 Ukraine 2010 Finance Electricity, gas, water Community services, entertainment Health care Education Public administration Real estate, engineering, business services Transport and communications Hotels and restaurants Trade, repairs, personal items Construction Manufacturing Extractive industries Fishing Agriculture, hunting and forestry Finance Services Trade Industry Agriculture 38 Ukraine_2015_nov26.indd 38 2015-11-26 5:14 PM
  • 61.
    In 2013, Ukraineproduced 83.7 million tons of coal, ranking 11th in the world. Coal is mainly mined in the Donetsk and Lviv-Volyn basins. Donetsk Basin, located in Donetsk and Luhansk oblasts (in Eastern Ukraine), is the largest in Ukraine with 92 percent of Ukraine’s coal reserves. The coal industry was traditionally one of the main industries of Ukraine; however, the fall of the Soviet Union, the collapse of domestic demand, and the recession affecting heavy industry caused the coal industry to crash in the first half of the 1990s. Beyond the macro-economic factors, the industry suffered from inefficiency, low productivity, huge debts, corruption, and outmoded equipment that the country could not afford to improve. In addition, the industry was beset by labor strikes due to unpaid wages and hazardous working conditions. Between 1990 and 1995, coal output decreased by nearly 50 percent to less than 70 million tons/year. The productivity of Ukrainian coal miners – about 600 thousand workers were employed directly in coal extraction in 1995 – was low. Coal exports almost totally halted in 1995, while imported coal and other fuels captured a large share of the Ukrainian market as a result of high domestic coal prices maintained by the government, inefficient and delayed delivery, and poor coal quality. In addition, as mining companies – especially in mono-functional towns – continued to provide a wide range of public services to local communities, including pre-school education, health care, housing, recreation, these costs further reduced the competitiveness of Ukrainian coal mines. A first wave of restructuring measures was carried out during 1996-2000 that focused on closing uneconomic coal mines with the target of 20 mines per year; by 2001, 90 mines had been closed and privatizations of many others had been undertaken. In 2001, a second wave of measures was adopted which reversed the previous policies target, and focused rather on supporting the privatization of profitable mines and using subsidies to increase productivity of others. Consequently, during this period 39 mines were modernized and the largest number of mine privatizations took place. Under the current Ukrainian Energy Strategy, revised in 2012, coal remains one of Ukraine’s pre-eminent sources of energy while also maintaining its strategic role as Ukraine’s main safeguard against excessive reliance on energy imports. Currently the power generation sector consumes about 25 to 30 million tons of coal annually, almost half of all processed coal production. The Ukrainian Energy Strategy anticipates a significant increase of coal-fired generation going forward, with power sector coal needs more than doubling by 2030. As approved by the Cabinet of Ministers, the Energy Strategy of Ukraine proposes three stages of reform and development through 2030: (i) Coal industry reform period with completion of the privatization of state enterprises, introduction of public-private partnerships, and closing of the most unprofitable mines (2011- 2015); (ii) Modernization of mines by private investors (2015-2020); and (iii) Stable growth of the coal industry (2020-2030). In 2012, there were 143 mines in Ukraine. State subsidies for the coal sector in 2013 amounted to 13.3 billion UAH (approx. 1.7 billion USD), which is comparable to the entire defense budget of the country. Coal industry has been dramatically affected by the current conflict, since three-quarters of all coal mines are located on the controlled territories of Donetsk and Luhansk oblasts. Coal production decreased by 20% in 2014 and by 60% in February 2015 relative to February 2014. No coal subsidies are stipulated in 2015 budget. Sources: Institute for Economic Research and Policy Consulting, “Ukraine’s Industrial Sector: Analysis and Latest Trends,” February 2014. Viachaslau Herasimovich, “Ukrainian Coal Mining Sector Review,” CASE Ukraine, September 21, 2008. World Bank, “Ukraine - Coal industry restructuring sector report,” 1996 CHAPTER 1 The urban system: Demographics and Economic Trends BOX 5 – THE RISE AND FALL OF UKRAINE’S COAL INDUSTRY FIGURE: COAL BASINS IN UKRAINE (2013) Source: Eurocoal Website 39 Ukraine_2015_nov26.indd 39 2015-11-26 5:14 PM
  • 62.
    The economy’s shiftfrom heavy industry and mining to services has also been accompanied by a decrease in the role of agriculture. From 2002-2010, the contribution of agricultural production to the economy decreased from 14 to 12 percent, with declines in grains, sugar beets, sunflower seeds, vegetables, beef, and milk. This decline might reflect the impact of the overall shift of the population and economic activities from rural to urban areas (as discussed in Section 2), and from less to more productive sectors. However, with the recent decline of the ferrous and energy sectors, agribusiness’ share in output as well as exports has increased again. The structural transformation can also be observed in the shift in the employment distribution from industry and agriculture to services. According to the Background Paper for the World Development Report 2013: Ukraine Case Study: Jobs and Demographic Change, 2012. Compared to 2000s, for example, the share of total employment in agriculture fell from 21.6 percent to 15.3 percent in 2013, while the share employed in services (in the private sector) rose from 25.4 percent to 34.5 in 2010 (latest data available). Ahead of agriculture but a distant second place to the services sector, the industrial sector currently provides 17 percent of employment. The public sector as a whole represents the remaining 20 percent of employment44 , with public administration jobs making up six percent of the total. However, employment has by and large not moved to the high-productivity sectors in Ukraine (Figure 27).While a significant number of workers have left the agricultural sector since the early 2000s – a sector with below-average labor productivity – they have not always moved to higher-productivity sectors. Instead, many workers have gone into construction (which rose from 4.4 percent to 4.6 percent of total employment), transportation (from 6.7 to 6.8 percent) and retail – the three sectors with the lowest overall labor productivity. Finance, a high-productivity sector, has strongly increased its participation in the GVA as shown in Figure 26. However, despite the doubling of its share of employment (from 0.8 percent to 1.6 percent), the number of employees in finance remains low compared to traditional sectors. Although other highly-productive sectors such as healthcare have expanded in recent years, they also remain a relatively small portion of overall employment. CHAPTER 1 The urban system: Demographics and Economic Trends Figure 27 – The change in the share of employment by sector between 2001 and 2008 in percentage points against sectoral productivity in 2001. The economy’s average productivity rate is provided for comparison Source: World Bank, PCN for P148768: Ukraine: skills for employment and productivity, based on ILO and UN data 45 . Note: The trend line is depicted in green. 44 Kupets, Olga, et.al, Background Paper for the World Development Report 2013: Ukraine Case Study: Jobs and Demographic Change, 2012, 2.2. Description of the labor market situation, available at http://siteresources.worldbank.org/EXTNWDR2013/ Resources/8258024-1320950747192/8260293-1320956712276/8261091-1348683883703/WDR2013_bp_Jobs_And_Demographic_Change.pdf. 45 See McMillan and Rodrik (2011) for a methodological discussion on measuring structural transformation Agric. Admin. Hotels Housing Service Retail Constr. Finance Fishing Manufact. Electr. Educ. Mining Transp. Health 1.0 0.5 0 -0.5 -1.0 -1.5 -0.1 -0.05 0.050 Laborproductivity,2001 Changing employment, 2001-2008Less workers More workers HighLow 40 Ukraine_2015_nov26.indd 40 2015-11-26 5:14 PM
  • 63.
    Among transition economies,Ukraine has the lowest level of labor productivity. In 2011, GDP per person employed was USD 10,098 in Ukraine (Figure 29)46 . This rate is lower than the rate in most countries of the former Soviet Union, including Moldova, the Russian Federation, Armenia, and Belarus. In addition to this low baseline level, productivity growth has been slow over the years, albeit accelerating in the years before the Global Financial Crisis in 2008 (see Figure 28). The reasons for this slow growth in labor productivity are multiple, but a major impediment is the rigidity of the labor market. Currently, there is limited mobility for labor migration within the country as well as significant disparity between the growing demand for high-skilled service workers in the service sector and the limited number of high-skilled workers.47 46 Measured in constant 1990 purchasing power parity (PPP) prices. 47 Arias, O.S., C. Sanchez-Paramo, M.E. Davalos, I. Santos, E.R. Tiongson, C. Gruen, N. de Andrade Falcao, G. Saiovici, and C.A. Cancho, Back to Work: Growing with Jobs in Europe and Central Asia, Washington, DC: World Bank, 2014. CHAPTER 1 The urban system: Demographics and Economic Trends Figure 28 – GDP per person employed in countries of the former Soviet Union 2001 (1990 PPP) Figure 29 – Trend of GDP per person employed in Ukraine (based on 1990 PPP) Source: World Development Indicators Source: World Development Indicators 2015, The World Bank 35000 30000 25000 20000 15000 10000 5000 0 Ukraine Moldova Uzbekistan Georgia Russian Fed. Armenia Belarus GDPperpersonemployed(1990PPP) 14000 12000 10000 8000 6000 4000 2000 0 1989 1990 1991 1992 1993 1994 1995 1996 1997 1998 1999 2000 2001 2002 2003 2004 2005 2006 2007 2008 2009 2010 2011 2012 GDP per person employed (constant 1990 PPP $) 41 Ukraine_2015_nov26.indd 41 2015-11-26 5:14 PM
  • 64.
    Remittances are increasinglyimportant to the Ukrainian economy As a consequence of increased migration outflows (discussed in Section 1), remittances have become a growing element of the economy. According to World Bank data, remittance inflows to Ukraine increased from USD 829 million to USD 5,607 million between 2006 and 2010 (Figure 30) – a factor of almost seven48 . In 2013, the National Bank of Ukraine reported that the amount of remittances transferred to Ukraine was USD 8.5 billion, representing 4.7 percent of Ukraine’s GDP for that year49 . However, the actual amount of remittances may be twice the size of the reported number50 , given that many Ukrainians opt for unofficial means for transfers. It is estimated that nearly 60 percent of overall remittances are not transferred through the banking system. In fact, in 2010, official remittances were nearly equivalent to the amount of Foreign Direct Investment (FDI). In addition, they represent an important source of foreign currency for Ukraine, with 4.67 and 4.43 billion received in 2007 and 2010 in US Dollars, respectively. Consequently, personal remittances have become a large part of the balance of payments of the country and helped ameliorate the trade deficit that widened considerably during 2005-2008. The growth of the deficit was caused by higher prices in imported oil and gas, growth in domestic demand for goods exceeding growth of exports, and the Global Financial Crisis. In the short run, remittances are being used fundamentally for domestic consumption. Remittances are an increasingly important source of extra income for migrants’ families51 . A recent study shows that almost all of remittances are used for living expenses (73 percent) and consumer goods (26 percent), whilst only 3.3 percent is used for setting up a business. Anecdotic evidence suggests that remittances are often being sunk into real estate investments. However, while in the short term remittances can stimulate the local economy through consumption, over the longer term they are best used by nations to enhance investments (i.e. human capital) and thus boost productivity, which is especially needed in Ukraine given the current demographic trends of population decline and aging. Over half of all remittance-receiving households in Ukraine are concentrated in the Western region. This region is followed by the Eastern region, where 20 percent of households receive remittances. The Central and Southern regions have much lower shares. 56 percent of remittances come from countries in the EU, with Poland and the Czech Republic as the largest contributors; 40 percent from Russia; and the remaining four percent from a variety of countries. Most remittances flow to middle class and lower middle class households52 and to urban areas53 . 48 O. Kupets, The Development and the Side Effects of Remittances in the CIS Countries: the Case of Ukraine, CARIM-East Research Report 2012/02, European University Institute Robert Schuman Center for Advanced Studies, 2012, available at http://www.carim-east.eu/media/ CARIM-East-2012-02.pdf. 49 National Bank of Ukraine; see http://www.bank.gov.ua/doccatalog/document?id=80651. 50 Fedorak, Z., “Nashi sered chuzyh (Ours Among the Aliens),” Economic News, 2007 (in Ukrainian). 51 International Organization for Migration, Migration in Ukraine: Facts Figures, September 2011, available at https://www.iom.int/jahia/ webdav/shared/shared/mainsite/activities/countries/docs/Ukraine/Migration-in-Ukraine-Facts-and-Figures.pdf. 52 Modular Survey on Labor Migration in Ukraine, 2012, International Labour Organization 53 Kupets, O., The Development and the Side Effects of Remittances in the CIS Countries: The Case of Ukraine, 2012 CHAPTER 1 The urban system: Demographics and Economic Trends 42 Ukraine_2015_nov26.indd 42 2015-11-26 5:14 PM
  • 65.
    CHAPTER 1 Theurban system: Demographics and Economic Trends Figure 30 – Remittances to Ukraine by expatriates, 2001-2013 Source: Authors’ analysis based on World Development Indicators Data, The World Bank 10000 8000 6000 4000 2000 0 6 5 4 3 2 1 0 2001 2002 2003 2004 2005 2006 2007 2008 2009 2010 2011 2012 2013 Remittances (Million US$) Remittances (% of GDP) MillionUS$ %ofGDPA diverse set of economic regions There are important differences in the economic structures of the regions of Ukraine. As previously mentioned, the Eastern region is a traditionally industrial area, while the Central region is the country’s leader in the financial, trade, and services sectors. The Southern region is also an important industrial center, while the Western region, as it is less urbanized, has the greatest concentration of agricultural activities in the country (See Figure 31). The evolution of the economic sectors has been different across regions, with the financial sector growing with particular strength in the Central region. In the Central region, the financial sector’s share rose from 4 to 8 percent from 2002 to 2010, surpassing the share of the industrial sector, which lost three percentage points. The services sector, which is heavily concentrated in Kyiv, occupied approximately 50 percent of the central region’s economic activity. The Southern region also registered a notable increase in financial services’ share of the economy, rising from 2 to 4 percent. If financial services are included with other service industries shares, the service sector accounted for 48 percent of the Southern region’s economy, followed by the industrial sector, which decreased from 33 to 31 percent from 2002 to 2010. 43 Ukraine_2015_nov26.indd 43 2015-11-26 5:14 PM
  • 66.
    CHAPTER 1 Theurban system: Demographics and Economic Trends Source: Ukraine Statistics Department Figure 31 – GVA shares: Eastern and Southern regions remain more industrial, the Central region is predominent in trade, services and financial sector 100% 90% 80% 70% 60% 50% 40% 30% 20% 10% 0% Western2002 Western2010 Eastern2002 Eastern2010 Central2002 Central2010 Southern2002 Southern2010 Finance Electricity, gas, water Community services, entertainment Health care Education Public administration Real estate, engineering, business services Transport and communications Hotels and restaurants Trade, repairs, personal items Construction Manufacturing Extractive industries Fishing Agriculture, hunting and forestry The Eastern region also saw a significant shift towards the financial sector, although industrial activities remain secondary only to services; meanwhile, the Western region also increased its share of production in the financial and service sectors. Industry’s share of the Eastern region’s economy fell drastically from 38 to 20 percent over the 2002-2010 period. The decrease was mostly due to displacement caused by the rise of the financial sector. In the Eastern region, the financial sector’s participation more than tripled, from 2.5 to almost 6 percent. In the Western region, the agricultural sector decreased five percentage points from 2002-2010; however, the trade sector grew nearly that amount (3 percentage points) over the period. 44 Ukraine_2015_nov26.indd 44 2015-11-26 5:14 PM
  • 67.
    CHAPTER 1 Theurban system: Demographics and Economic Trends Overall,industrialactivitycontinuestobehighlyconcentratedinafewoblasts. The clear leader is Donetsk Oblast, which accounts for 21 percent of Ukraine’s total industrial output, followed by Dnipropetrovsk with 16 percent. Thus, these two oblasts account for some 36 percent of Ukraine’s industrial production. Adding Luhansk (8 percent), Zaporizhia (5 percent), and Kharkiv (5 percent) oblasts, all of which are located in the Eastern region, increases the share to almost 55 percent. Donetsk and Luhansk oblasts are home to major elements of the metallurgical, chemical, power, and heavy engineering industries. These two oblasts are the industrial heartland of Ukraine, and were estimated to host about 900 large-scale industrial plants before the conflict, including 140 collieries, 40 metallurgical plants, and seven thermal power stations, as well as 177 operations involving hazardous chemicals, including 113 operations using radioactive materials. A more disaggregated analysis of sectoral employment supports the conclusions previously discussed and sheds light on some important trends. Box 6 presents the methodology used and Table 7 presents a summarized version of the results. The first four columns (“Growth 2002-2010”) of the table present the results from a comparison of the regions’ location quotients in 2000 and 2010 for each sector (see explanation of the term in Box 6. An upward-pointing arrow indicates that the quotient has grown, i.e., the sector has increased in importance in that region. The following four columns (“Importance 2010”) show whether the quotient in 2010 was above or below 1. A plus mark (+) represents a value that is higher than 1, while a minus mark (-) represents a value lower than 1. Quotients above 1 indicate that the sector’s share of employment in the region is greater than the sector’s share of employment at the national level. Location quotients are used to determine the relative importance of each sector in different regions. The location quotient determines whether the fraction of people employed in a sector is larger or smaller relative to the national average. If we define 𝜑s rt to be the share of the total workers in region r at time t who work in sector s, and define 𝜑s t to be the share of the total national employment at time t that is due to employment in sector s, we can write the location quotient for sector s , region r, and time t, LQs rt as: LQs rt = This location quotient reveals the extent to which the share of an industry’s employment in a given location is larger or smaller than that sector’s share of overall national employment. For example, if manufacturing employs 40 percent of the country’s workforce and a location quotient for manufacturing is 1.1, then manufacturing employment in that location is 44 percent of that location’s workforce. In general, if LQs rt 1, then the sector s is over-represented in terms of employment relative to the country’s employment in that sector. The opposite happens if LQs rt 1. 𝜑s rt 𝜑s t BOX 6 – LOCATION QUOTIENT ESTIMATES OF SECTOR EMPLOYMENT IN THE REGIONS 45 Ukraine_2015_nov26.indd 45 2015-11-26 5:14 PM
  • 68.
    Figure 32 toFigure 35 below show the three dimensions highlighted by the location quotient derived for employment activity in each region: change, importance in each region, and size of the market. The vertical axis shows the location quotient in 2010, the horizontal axis shows the location quotient change in percentage between 2000 and 2010, and the relative sizes of the bubbles in the plot represent the number of workers in that sector in the region. Agriculture is still very important in the Western region, although services have been increasing. The sector still plays a leading role in employment in the Western region, at nearly 25 percent, and a location quotient larger than 1 (1.33). Furthermore, Figure 32 shows that services, such as public administration, health, and education, are increasingly important. Finance, one of the leading sectors in other regions, remains lagging in terms of the employment it generates, despite the growth in output by this sector (Figure 31). Sector Growth 2000-2010 Importance 2010 Western Eastern Central Southern Western Eastern Central Southern Agriculture, hunting and fishing, forestry ➪ ➪ ➪ ➪ + - - - Industry ➪ ➪ ➪ ➪ - + - + Construction ➪ ➪ ➪ ➪ + + - - Trades; repair of motor vehicles, household goods and personal uses; hotels and restaurants ➪ ➪ ➪ ➪ - + - + Transport, storage, and communication ➪ ➪ ➪ ➪ - + + + Finance ➪ ➪ ➪ ➪ - - + - Real Estate ➪ ➪ ➪ ➪ - - + - Public Administration ➪ ➪ ➪ ➪ - - + - Education ➪ ➪ ➪ ➪ + - + - Health care ➪ ➪ ➪ ➪ + - + - Other community and personal services; activities in the field of culture and sports ➪ ➪ ➪ ➪ + - - + CHAPTER 1 The urban system: Demographics and Economic Trends Table 7 – Growth of sector employment in regions and relation of that sector employment against the sector’s employment nationally using location quotients Source: Ukraine Statistics Department 46 Ukraine_2015_nov26.indd 46 2015-11-26 5:14 PM
  • 69.
    CHAPTER 1 Theurban system: Demographics and Economic Trends Figure 32 – Sectoral employment in the Western region by location quotient Figure 33 – Sectoral employment in the Central region by location quotient Source: Ukraine Statistics Department Source: Ukraine Statistics Department Location Quotient percentage change 2010-2000 Location Quotient percentage change 2010-2000 -0.16 -0.15 -0.10 -0.05 0 0.05 0.10 0.15 0.20 0.25 Finance Finance Industry Industry Construction Agriculture Agriculture Transport Transport Trade and services Trade and services Education Education Health Health Other Public admin Public admin Real Estate Real Estate -0.11 -0.06 -0.01 0.04 0.09 0.14 LocationQuotient2010LocationQuotient2010 1.40 1.30 1.20 1.10 1.00 0.90 0.80 0.70 0.60 0.50 1.55 1.45 1.35 1.25 1.15 1.05 0.95 0.85 0.75 Construction Other 47 Ukraine_2015_nov26.indd 47 2015-11-26 5:14 PM
  • 70.
    CHAPTER 1 Theurban system: Demographics and Economic Trends As shown in Figure 33 the Central region is strongly focused on high skill services, while employment in more traditional sectors like industry and other services has stayed fairly stable and at levels similar to the country’s average. Finance and public administration show a strong growth in their quotients, although, as in other regions, there are few people employed in these sectors. The presence of a strong finance sector, as well as other high output sectors like health, is to be expected as this region hosts Kiev, Ukraine’s capital and largest city, and one of the few cities growing in the country. Possibly as a consequence of new migrants, employment in construction is more important here in relative terms than in the rest of the country. However, it has been decreasing in the region over time. Finally, despite a large number of people employed in agriculture, the relative importance of this sector is low, and it too has been decreasing over time. The industrial sector remains predominant in the Eastern region (Figure 34); however, other high skill sectors, such as trades and services, have not grown much in relative terms despite being the second largest sector in terms of employment. This region has slowly evolved, but the industrial sector remains at the core of its economic activity. For instance, the coal industry, despite having gone through severe crises, still makes up a large portion of the production portfolio of the region (see Box 5 above). As the most urbanized region in the country (see Section 2: Urbanization and the Urban System above), it is not surprising that trade and services, as well as construction, occupy an important place in employment. Yet trades and services have not been growing, while construction and agriculture have seen increases. Similarly, high skill sectors, like public administration and finance, have been decreasing and occupy low levels of importance relative to the rest of the country. The industrial sector also plays a key role in the Southern region (Figure 35), as does the trades and services. The Trades and Services sector is gaining in importance, particularly in the area of tourism services. Manufacturing and manufacturing-related activities like transportation and storage, water supply, and management are also playing an increasing role. Growth in this region is the most concentrated of all the regions as only two main sectors are growing in importance according to the location quotients. Other high skill sectors, like finance and public administration, remain small and are decreasing. This may be an indication that the region’s economy has been having difficulties in its evolution into a services-oriented economy. Figure 34 – Sectoral employment in the Eastern region by location quotient Source: Ukraine Statistics Department Location Quotient percentage change 2010-2000 -0.15 Finance Industry Construction Agriculture Transport Trade and services Education Health Other Public admin Real Estate -0.10 -0.05 0 0.05 0.10 0.15 LocationQuotient2010 1.50 1.40 1.30 1.20 1.10 1.00 0.90 0.80 0.70 0.60 0.50 48 Ukraine_2015_nov26.indd 48 2015-11-26 5:14 PM
  • 71.
    CHAPTER 1 Theurban system: Demographics and Economic Trends Figure 35 – Sectoral employment in the Southern region by location quotient Source: Ukraine Statistics Department Location Quotient percentage change 2010-2000 -0.15 Finance Industry Construction Agriculture Transport Trade and services Education Health Other Public admin Real Estate -0.10 -0.05 0 0.05 0.10 0.15 LocationQuotient2010 1.15 1.10 1.05 1.00 0.95 0.90 0.85 Key messages and implications for further policy and analytical work Overall, Ukraine presents some indicators (GDP, GDP per capita, and poverty) that show steady progress over the last decade. However, continued progress in these areas is highly uncertain due to (i) the observed, negative population trends; (ii) the current conflict; and (iii) the slow progress that Ukraine has made, in terms of institutional adaptation and reforms, in moving toward a market-oriented system. It is not uncommon that a declining population initially has a positive impact on economic indicators, but its effect on economic performance over the long run is uncertain. The higher GDP per capita that is observed following population decline is generally linked to the fact that Capital is durable. Such economies may experience an increase in their capital per worker ratio, which may render each inhabitant marginally more productive. Additionally, decreasing population causes an initial shortage of labor, increasing relative demand for it, and potentially resulting in a reduced unemployment rate as well as higher wages. These dynamics have been observed in countries that have experienced sharp population decline such as Japan54 . The negative effects of population decline appear later, and are generally visible in the decline of demand for consumption. The effects over time of diminished demand as well as expectations of further population decline reduce incentives for investment and affect GDP growth negatively55 . 54 OECD, “Regional factors: Population and GDP per capita,” in OECD Regions at a Glance 2009, OECD Publishing, 2009, available at http:// dx.doi.org/10.1787/reg_glance-2009-26-en. 55 Markus Brückner and Hannes Schwandt, Income and Population Growth: Discussion Paper No. 7422, Bonn: Institute for the Study of Labor, May 2013, available at http://ftp.iza.org/dp7422.pdf. 49 Ukraine_2015_nov26.indd 49 2015-11-26 5:14 PM
  • 72.
    56 World BankGroup, Doing Business 2015: Going Beyond Efficiency, available at http://www.doingbusiness.org/data/exploreeconomies/ ukraine/. Only Kiev is considered. 57 Fajnzylber, P., and J. Humberto Lopez, eds., Remittances and Development: Lessons from Latin America, Washington, DC: The World Bank, 2008, available at http://siteresources.worldbank.org/INTLAC/Resources/Remittances_and_Development_Report.pdf Additionally, fixed costs in the provision of services also become more burdensome as they are shared among fewer people. Overall, given the demographic trends, the observed increase in GDP per capita in Ukraine should be viewed with cautious optimism; if appropriate measures are not adopted, the increase might not continue over the mid-term or longer term. The current conflict can bring a halt in the steady progress achieved in economic and poverty indicators over the last decade. From destruction of capital to institutional destabilization, the effects of the current conflict could cause lasting damage to economic activity. Furthermore, the conflict pushes people from unsafe areas, causing large costs to households and disrupting economic activity. Unless these movements somehow allocate households to more productive areas that are also well-prepared to receive them, it is very likely that the costs for these displaced households will be high and the adaptation process will be long. Another red flag is the slow adaptation of Ukraine’s firms and institutions to a market economy system. Compared to other countries in the region, Ukraine lags behind in its transition from a centrally-planned economy to a market economy, as well as on its institutional and business environment reforms (for instance, in measures of the ease of doing business, Ukraine ranks 96th worldwide and 22nd in the ECA region56 ). The EBRD transition index finds Ukraine doing poorly in several areas, including small-scale privatization efforts, enterprise restructuring, price liberalization, and trade and foreign exchange policy. Unless changes are made in these spheres, continued progress will be threatened. In terms of structural transformation of the economy, Ukraine has moved slowly from an industrial enterprise-centered economy to a services-centered economy, with a finance sector at the forefront of this change. Services have grown significantly in a number of areas, including retail, property, and information and communications technology (ICT). However, progress has been slow and has not occurred uniformly across the regions. Industry remains very important in the Southern and Eastern regions, while the Western region has seen a slow increase in the importance of services as the agriculture sector’s dominance wanes. Finance’s share of national Gross Value Added (GVA) has nearly doubled, but its share of the labor market is still minor and should not be expected to replace jobs in traditional sector. Overall services grew 40 percent from 2002-2010. Ukraine will need to increase the skills of its labor force to take advantage of this growing economic sector. Information-based sectors could have a wider employment potential in the country. International migration has been an important phenomenon that has affected not only population but also economic dynamics. Resources provided by remittances are large in magnitude, but their effects appear most likely beneficial only in the short term. Remittances provide short-term benefit by alleviating income problems of local consumers. However, data indicate that they are mainly used for consumption and not for long-term investments in human capital or entrepreneurship activities. Additionally, they can have medium- and long-term negative consequences, such as exchange rate appreciation and resultant negative effects on exports; linking the local economy to negative global shocks; and in some cases, hysteresis57 , as some people may forego work in favor of relying on remittances and lose their labor skills over time. As discussed in the previous sections, going forward, the country should aim at increasing labor mobility and accelerate institutional and business environment reforms. Facilitating increased labor mobility could further increase the gains from rising productive sectors (finance, information and communication technologies, education, and medicine). This will be especially beneficial if it is focused on facilitating population movements from low productivity rural sectors to high productivity urban sectors, or from low productivity to high productivity urban areas. CHAPTER 1 The urban system: Demographics and Economic TrendsCHAPTER 1 The urban system: Demographics and Economic Trends 50 Ukraine_2015_nov26.indd 50 2015-11-26 5:14 PM
  • 73.
    The roles ofcities in economic growth Cities, under the right conditions, can be true engines of economic growth. Cities provide a common space for collaborations and interaction for both firms and workers, providing an essential stage for agglomeration economies to occur through better sharing, matching and learning mechanisms58 . Agglomeration economies refer to the benefits of locating close together; this applies to both firms and workers. As firms cluster together, they broaden the market for their suppliers. With more buyers, suppliers’ average cost of production goes down and this leads to a drop in prices as well. Sharing increases profits through this lowering of costs as well as through allowing suppliers to provide highly-specialized goods59 . Another dynamic of larger market scale brought by agglomeration is an increase of the matching probability between demand and supply. For example, workers more easily find suitable jobs and firms more easily find the supplies they need. Finally, as both firms and workers aggregate in cities, they learn from each other more efficiently simply by their proximity and interactions. This learning channel yields increased productivity, especially in sectors like modern industry and services, in which high skills and innovation are more important. The learning mechanism not only affects actors in the same industry or sector (localization economies)60 , but also spurs innovation across sectors and between workers with different skills (urbanization economies). Also, spatial concentration of activities is conductive to the spillover of knowledge and innovations across industries and sectors of the economy. These benefits can spread to the country as a whole if cities are positioned to take advantage of a regional network, or, if they engage with global system of cities61 , and they can offer a gateway to the global economy for the entire national economy. Concentrations of offices of global companies, financial market institutions, large-scale infrastructure, and world-class education and cultural institutions enable cities to attract global partners and global markets and potentially bring benefits to their metropolitan areas, broader region, and the entire country. The positive impact of agglomeration economies on economic growth may be undercut by congestion costs such as traffic congestion and air pollution, which, if growth is not properly managed, can increase as cities become larger and denser. However, with sustainable management, agglomeration economies exceed congestion costs, and the overall net effect is an increase in productivity. To achieve increased productivity, the right mix of good governance, a beneficial business climate, and an efficient provision of public goods, usually in the form of public services and infrastructure62 , is necessary. Understanding the evolution of a country’s system of cities, as well as their role in economic growth, is fundamental for sound policy formulation. This section will explore the role of cities in Ukraine through two dimensions: first, by looking at the aggregate contribution of the urban sector to Ukraine’s economy, second, by making a city-level assessment of the demographic, economic, and spatial evolution of Ukrainian cities over the past two decades. For the first assessment, 58 Duranton, et. al., provide a review of the formal treatment of these ideas in urban economics (Duranton, G., and D. Puga, “Micro-Foundations of Urban Agglomeration Economies,” in Henderson, J. Vernon, and Jacque Thisse, eds., Handbook of Urban and Regional Economies, Vol. 4, Amsterdam: North-Holland, 2004). These ideas have been widely studied since their initial articulation by Marshall (Marshall, A., Principles of Economics, London: Mac-Millan, 1890). 59 World Development Report 2009: Reshaping Economic Geography. (2009). 60 Jacobs, J., The Economy of Cities, New York: Vintage, 1970, and McCann, P., Urban and Regional Economics, Oxford, U.K.: Oxford University Press, 2001. 61 For example, per the Globalization and World Cities Research Network Kyiv is classified as a Beta world city.. 62 This not only ensures taking full advantage of agglomeration, but also that benefits of rapid urbanization are more widely shared. Kuncoro, Ari, “Spatial Agglomeration, Site Productivity and Local Governance: Indonesian Experience from 1980 to 2003,” In Yukon Huang and Alessandro Magnoli Bocchi, eds., Reshaping Economic Geography in East Asia, Washington, DC: World Bank, (EAP Companion Volume to the WDR 2009), forthcoming. IV. Cities of Ukraine: Engines Of Economic Growth CHAPTER 1 The urban system: Demographics and Economic Trends 51 Ukraine_2015_nov26.indd 51 2015-11-26 5:14 PM
  • 74.
    Urban economic activityin Ukraine In Ukraine, the predominant share of economic activity is concentrated in urban areas, significantly exceeding the share of rural areas. Figure 36 shows how urban production in Ukraine is much higher than rural production measured by GVA over the period 2002-2010. Regional differences can also be observed. The Central region has the highest production for both rural and urban areas64 . This region, in which Kyiv plays a leading role, has the greatest urban GVA in the country65 , followed by the Southern and Eastern regions, respectively. As expected, the Western region ranks last in terms of urban production. The ranking is similar for rural GVA, except for the period 2002 to 2004, where the rural production in the Eastern region was higher than in the Southern region. Urban sectors are much more productive than rural sectors. As discussed in Section 1, Ukraine’s population has decreased overall, but the decline has been sharper in rural areas than in urban areas. This pattern, together with internal migration to large urban areas, has increased the share of the population that resides in cities. If agglomeration economies discussed above were not present (or were offset by congestion costs), labor productivity measured in GVA ratios for urban and rural sectors would closely follow urban-rural population ratios as shown in Figure 37. However, urban production grew, relative to rural production, at a much faster rate than urbanization during the period 2002-2010. different aspects of urban and rural economic activity will be contrasted using both aggregated regional data and firm- level data. For the second, night light (NLs) data will be used to track trends in economic activity at the city level, both spatially (i.e., the evolution of the night lights footprint and light intensity) and through time by drawing on demographic data analyzed in Section 2. The use of NLs as a proxy for economic activity is based on empirical evidence that they are correlated with economic activity (Henderson, et. al., 2009). On this basis, two city typologies are developed to assess how cities evolved in economic, demographic, and spatial terms over the past two decades. The first city typology compares Ukraine’s cities against a benchmark that defines urban as those cities emitting NLs of intensities higher than urban threshold, which in the case of Ukraine is 19.563 . This analysis identifies settlements that grew enough in light intensity over the period to be considered to have met the urban threshold. Others, by contrast, are shrinking to the point that they are no longer considered urban by the standard of NLs. The second typology focuses on settlements that met this urban threshold over two periods of time. This typology analyzes cities across two dimensions: changes in urban footprint (defined by NLs), and changes in light intensity. Finally, these two typologies are triangulated with geographic and demographic data to further illuminate the evolution of the urban system in Ukraine and its main challenges. 63 For Ukraine, this threshold was determined to be 20.94 DN. Intensity of night-time light here is measured on a “Digital Number” (or DN) scale This threshold has been selected by calibrating the lights data against higher resolution land use cover maps for the region – in particular, the European Space Agency’s GlobCover 2009 map and the MODIS Collection 5 Land Cover Type map. See the SAR Urbanization Flagship for a discussion of the data. It is important to note that this differs from the product that forms the basis of Henderson et al.’s research (See Measuring Economic Growth from Outer Space, American Economic Review ,102), as well as that used by most other researchers, in that it does not suffer from the saturation problem. 64 For rural production, this is due mainly to climate conditions and a larger concentration of the most fertile black soils, especially compared to the Eastern and Southern regions. 65 Gross Value Added (GVA) data by sector, as reported by the State Statistics Service of Ukraine, is used to measure urban production for the years 2002-2010. The sectors can be divided into those that are typically urban and those that are typically rural according to the following classifications: Agriculture, Hunting, and Forestry, and Fishing are elements of rural production, and Manufacturing, Construction, Trades, Repairs, Personal Products, Hotels and Restaurants, Mining, Transport and Communications, Real Estate, Engineering, Business Services, Public Administration, Education, Health Care, Community Services, Entertainment, Electricity, Gas, Water, and Finance are elements of urban production. These groupings are a simplification of the urban and rural divide, which is more complex. For example, the legal residence of businesses may be located in cities, where they report their employment and overall economic production, although their main economic activity occurs in rural areas. The city of Kyiv is emblematic of this; as a region, it is one of the largest exporters of agrarian products in Ukraine and hosts the headquarters of most of the large agro-holdings groups. See for example the case study for the grain sector in The EBRD’s Experience with Policy Dialogue in Ukraine (2014). CHAPTER 1 The urban system: Demographics and Economic Trends 52 Ukraine_2015_nov26.indd 52 2015-11-26 5:14 PM
  • 75.
    In fact, urbanproduction was between four and five times higher than rural production in Ukraine. This ratio has increased steadily in the last decade, except for a mild decline between 2007 and 2009. By contrast, the dotted lines below, representing the ratio between urban and rural population in each of the regions, shows that urban population is about twice the size of the rural population and its increase has been much less steep. CHAPTER 1 The urban system: Demographics and Economic Trends Figure 36 – Ukraine’s urban GVA (upper graph) is much greater than its rural GVA (lower)* *The scale of the y-axis differs between graphs for purposes of illustration Source: Ukraine Statistics Department Western Eastern Central Southern Ukraine 2002 2004 2006 2008 2010 Reallocalcurrency(000smillion) 250 200 150 100 50 0 Urban GVA Rural GVA 2002 2004 2006 2008 2010 Reallocalcurrency(000smillion) 50 40 30 20 10 53 Ukraine_2015_nov26.indd 53 2015-11-26 5:14 PM
  • 76.
    Figure 37 alsoshows that the impact of urban areas in production differed significantly between regions during 2002- 2010, with the Central region showing the highest ratio of urban to rural production and the Western showing the lowest. Production in the Central region was predominantly urban relative to the other regions. In 2008, for instance, the region’s urban production was almost eight times as great as its rural production. Urban population was nearly twice that of rural population in this region, but was significantly lower than the ratio of production and much more stable than other regions. By contrast, the Western region had the lowest urban production relative to its rural production in the period. Still, even in this relatively more rural region, urban production was not only more important than rural (note the line above is 1), but the ratio of urban to rural production was also higher than the urban to rural population ratio. This dynamic was found in all regions, except for the Eastern region. The Eastern region had the highest urban to rural population rates – higher even than the urban to rural GVA ratios – suggesting that urban productivity in this region was lower than in the other regions. Firm-level data66 shows how the largest cities in Ukraine acted as magnets for growth, continuing to attract workers and firms. Table 8 shows the cities67 with the greatest concentration of firms. The first noticeable pattern is that the largest cities held the largest number of firms. This happened not only because they offered the largest markets, but also because of the location and urbanization economies mentioned earlier. The table also shows that the ranking of cities in terms of the number of firms they host is quite stable; among the largest 15 cities in 2000, all but one ranked in the top 15 locations in 2008. This is consistent with the idea of agglomeration economies, as the largest cities provided a better economic environment for firms. There are several Western cities, such as Ivano-Frankivsk, that ranked much higher in the number of firms than their population ranking would suggest. This would suggest that these cities might have possessed characteristics that made them attractive for firms to locate there68 . This trend could be due to the convenient location for new firms of the Western region in terms of its proximity to the large market of Western Europe. By contrast, the opposite reasoning could be applied to those cities whose rank in number of firms was lower than their population ranking; in relative terms, they may have been less attractive for firms than their population would suggest. 66 Firm-level data was obtained from AMADEUS, a large-scale, firm-level survey. AMADEUS is a comprehensive, pan-European database containing financial information on over 11 million public and private companies in 41 European countries. There is data for a representative sample of firms in Ukraine for the years 1997-2009 in an unbalanced panel. 67 These correspond to individual cities and not to agglomerations. 68 In particular, Ivano-Frankisk presented one of the most intense growth rates, 122 percent over the period, which suggests that economic activity was very robust and that firms located there were of significant size. Similarly, Lviv presented exceptional growth of nearly 90 percent. Figure 37 – Urban-rural GVA ratios are much greater than urban-rural population ratios, indicating much higher productivity in the urban sector Source: Ukraine Statistics Department Urban and Rural Production vs Urban and Rural Population 2010 Ukraine 2002 Southern 2010 Southern 2002 Central 2010 Central 2002 Eastern 2010 Eastern 2002 Western 2010 Western2002 Ukraine 7 6 5 4 3 2 1 0 Urban GVA/Rural GVA Urban Population/Rural Population CHAPTER 1 The urban system: Demographics and Economic Trends 54 Ukraine_2015_nov26.indd 54 2015-11-26 5:14 PM
  • 77.
    Region CITY Population (2013 estimated) Population Ranking (2013) FirmRanking in 2000 Firm Ranking in 2008 Central Kyiv 2,757,900 1 1 1 Eastern Kharkiv 1,451,028 2 2 2 Western Lviv 730,272 7 3 6 Eastern Donetsk 953,217 5 4 5 Southern Odesa 1,014,852 3 5 4 Southern Dnipropetrovsk 997,754 4 6 3 Southern Zaporizhzhya 770,672 6 7 7 Southern Mikolaiv 496,188 9 8 9 Southern Simferopol 337,285 15 9 8 Eastern Lugansk 425,848 11 10 10 Central Vinnitsya 371,698 12 11 13 Southern Kriviy Rig 656,478 8 12 12 Western Ivano-Frankivsk 226,018 28 13 17 Southern Kherson 299,052 16 14 14 Central Poltava 296,852 17 15 11 Western Rivne 250,333 25 16 23 Central Sumi 269,177 21 17 15 Western Chernivtsi 258,842 23 18 26 Western Chmelnitskiy 264,988 22 19 22 Eastern Mariupol 461,810 10 20 21 CHAPTER 1 The urban system: Demographics and Economic Trends Table 8 – 20 cities with the highest number of firms in 2000 and 2008 Source: AMADEUS data This firm-level survey also suggests that economies of scale, urbanization economies, and agglomeration economies play important roles in the economic performance of firms in cities in Ukraine. Location economies, although weaker, are also supported by the data. The upper left panel of Figure 38 shows a positive relationship between the productivity of firms and the number of employees in the firm. This is a sign of (internal) economies of scale, which arise from the ability of larger firms and plants to better exploit fixed costs69 . Urbanization economies arise from the dynamics of a large number of different industries and firms located in the same place. The upper right panel of Figure 38 suggests that there is 69 According to the World Development Report 2009, internal economies of scale come mainly from technological factors as well as pecuniary (being able to purchase inputs at discount values for example). 55 Ukraine_2015_nov26.indd 55 2015-11-26 5:14 PM
  • 78.
    indeed a positiverelationship between the number of firms in a city and a firm’s profits per employee70 . Urbanization economies highlight the importance of the sharing mechanism and how knowledge generated in one industry goes beyond it to improve the performance of firms in other industries as well. The lower right panel shows the relationship between the average profit per employee of firms and their average industry size71 . The relationship is weaker than the previous ones, but still positive, suggesting the presence of localization economies, which arise from a high number of firms in the same industry. Finally, the lower left panel shows a positive relationship between the population density of the city and firms’ average profit per employee. This is a sign of overall agglomeration economies mentioned previously. These agglomeration economies most likely come from a combination of the analyzed localization economies, urbanization economies, and internal economies of scale. These effects have been assessed in the economics literature as potentially important determinants of development72 . 70 Profits per employee reported throughout Figure 39 are city-wide averages at the firm level. 71 AMADEUS calculates industry size using both the total number of employees and the size of firms assets in the same industry at the national level. This is an approximation to a measurement of localization economies, which would optimally show the size of the industry in a single location. Due to data limitations, we have only industry size at the national level. 72 Bazoglu, Nefise. 2008. Cities in Transition: Demographics and the Development of Cities. Philadelphia: Pennsylvania State University, and Ciccone, Antonio, and Robert E. Hall. 1996. “Productivity and the Density of Economic Activity.” American Economic Review 86 (1): 54–70. 73 The figures used are derived from averages at the city level using the 50 cities with the largest number of observations, as these provide the least statistical ‘noise’ and greatest reliability Figure 38 – The performance of firms based on firm, city, and industry characteristics73 Source: Data from AMADEUS on Ukraine firms from 2000-2008 Economies of Scale (2000-2008) Urbanization Economies (2000-2008) Agglomeration Economies Location Economies 50 40 30 20 10 0 -10 -20 0 0 0 10 1000 1000 30000 40000 50000 60000 20 2000 2000 30 3000 3000 40 4000 4000 50 5000 5000 60 6000 6000 70 7000 7000 8000 80 50 40 30 20 10 0 -10 -20 50 40 30 20 10 0 -10 -20 55 45 35 25 15 5 -5 Averageprofitperemployee(000s) Profitperemployee(000s) Profitperemployee(000s) Industry size Number of firms in city Population density Firm number of employees Profitperemployee(000s) CHAPTER 1 The urban system: Demographics and Economic Trends 56 Ukraine_2015_nov26.indd 56 2015-11-26 5:14 PM
  • 79.
    CHAPTER 1 Theurban system: Demographics and Economic Trends Analysis of dynamics of economic growth using night lights data Urban production has played a fundamental role in the recent economic growth of Ukraine, but from aggregate data it is difficult to assess how particular cities have performed. No country has been able to achieve prosperity without both strong urbanization and strong urban economic growth. In Ukraine, this process has not been uniform, and much economic activity has usually been concentrated in a small number of cities. However, measuring economic activities at the city level in Ukraine has been challenging, as city level economic activity data has rarely been available. Along with demographic indicators, this section will use the empirical regularity that there is a strong correlation between emitted night lights and the economic activity of an urban location in order to illustrate trends about economic production by Ukrainian cities (and their night lights footprint)74 . This is especially useful since no official city-level GDP data is available for all cities. Using a subset of 31 cities for which the McKinsey Global Institute reports estimated GDP, the positive correlation between GDP and night lights for the city is evident (Figure 39). Annex III provides more details on the utility of using this methodology in the Ukrainian context, while Annex IV presents an additional growth robustness analysis with variations based on the urban threshold. Night lights data possess useful analytical characteristics related to their availability, their granularity, and the fact that they provide information on brightness and location dimensions. The night lights (NLs) data used covers the 1996-2010 period and is based on spatial observations of Ukrainian cities and the lights they emitted at night. Light is determined to be urban when it goes beyond a brightness threshold, and this is used to determine urban footprints. 74 Henderson, et al. (2012) (Measuring Economic Growth from Outer Space, American Economic Review, 102) develops a theoretical model that suggests an optimal way to combine night lights data and available GDP data. It is based on the idea that both pieces of information can exhibit measurement error, but that there is no reason to assume these errors will be correlated with each other. Henderson, et al. (2011) applies this to a sample of 170 countries, while Henderson, et al., (2012) (A Bright Idea for Measuring Economic Growth, American Economic Review: Papers Proceedings, 101) further develops the approach by providing additional examples of how night lights readings react to documented economic and social phenomena, and suggests a model that focuses on night lights density. Based on this, Henderson, et al. argues that the night lights data can be used to proxy GDP growth in settings where GDP data is either of poor quality or entirely unavailable. This approach has been recently expanded upon in several other papers that confirm the positive relationship between observed night lights and economic activity (See Alder, 2013; Baum-Snow and Turner, 2012; Baum-Snow, Brandt, Henderson, Turner and Zhang, 2013; Pinkovskiy, 2013; and Storeygard, 2013). Figure 39 – There is a strong positive correlation between urban GDP and night lights Source: McKinsey Global Institute (city GDP data) and author’s calculations. 57 Ukraine_2015_nov26.indd 57 2015-11-26 5:14 PM
  • 80.
    ! ! ! RivneKovel' Poltava Kherson Cherkasy Zhytomyra Ternopil' Chernihiv Chernivtsi Simferopol' Khmel'nyts'kyz Ivano-frankivs'k 0 125 250375 500 Kilometers Kharkiv ROMANIA RUSSIAN FEDERATION BELARUS POLAND MOLDOVA HUNGARY Sumy Kyiv Odesa L'viv RivneKovel' Poltava Kherson Donets'k Luhans'k Cherkasy Uzhhorod Vinnytsya Zhytomyra Ternopil' Mykolayiv Chernihiv Kirovohrad Chernivtsi Simferopol' Zaporiyhzhya Khmel'nyts'kyz Dnipropetrovs'k Ivano-frankivs'k Figure 40 – Night lights and urban footprints in Ukraine 1996 and 2010 Source: McKinsey Global Institute (city GDP data) and author’s calculations. ! ! ! ! ! ! ! ! ! ! ! ! ! ! ! ! ! ! ! ! ! ! ! ! ! Kyiv L'viv RivneKovel' Poltava Kharkiv Kherson Donets'k Cherkasy Uzhhorod Vinnytsya Zhytomyra Ternopil' Mykolayiv Chernihiv Kirovohrad Chernivtsi Simferopol' Zaporiyhzhya Khmel'nyts'kyz Dnipropetrovs'k Ivano-frankivs'k 0 125 250 375 500 Kilometers Kharkiv ROMANIA RUSSIAN FEDERATION BELARUS POLAND MOLDOVA HUNGARY Sumy Kyiv Odesa L'viv RivneKovel' Poltava Kherson Donets'k Luhans'k Cherkasy Uzhhorod Vinnytsya Zhytomyra Ternopil' Mykolayiv Chernihiv Kirovohrad Chernivtsi Simferopol' Zaporiyhzhya Khmel'nyts'kyz Dnipropetrovs'k Ivano-frankivs'k Urban Footprint 1996 CHAPTER 1 The urban system: Demographics and Economic Trends 58 Ukraine_2015_nov26.indd 58 2015-11-26 5:14 PM
  • 81.
    CHAPTER 1 Theurban system: Demographics and Economic Trends NLs measurements are available at a very fine scale in two dimensions: light intensity and location of that intensity. As a consequence, they are very useful in analyzing the evolution of economic activity over time and space. Additionally, as indicated in Section 2, as individual cities in close proximity grow towards each other to constitute an agglomeration, their NLs footprints can likewise merge and reflect that agglomeration. NLs analysis treats agglomerations as a single city or urban entity. In 2010 Ukraine had 23 agglomerations based on the NLs definition. Visual analysis of NLs urban footprints at the national level provides insights about the location of major urban centers and their dynamics over time. Figure 40 shows the urban footprints detected by NLs in 1996 and 2000 in Ukraine. Three patterns can be observed: (i) a strong concentration of the urban centers in the East of the country; (ii) the growing and expanding footprint of the Kyiv agglomeration; and (iii) a growth in the number of urban areas – measured by NLs – in the West and a decline in the East. This tracks with the demographic analysis presented in Section 2 showing a sharp population decline of cities located in the Eastern region and a population increase in the concentration of cities around Kyiv and in the Western Region. A visual representation of compound growth of NLs suggests an important shift from the Eastern and Southern Regions towards the Western and Central Regions.75 Figure 41 shows the percentage growth of night lights in the Ukrainian territory between 1996 and 2010. This shift of lights from East to West might have multiple causes. First, as discussed in Sections 1 and 2, two decades ago, the East of the country presented high urbanization levels (more than 70 percent), as well as a concentration of most of the country’s industry. By contrast, the West presented lower urbanization levels (around 50 percent) and remained a predominantly rural region. These characteristics, especially in the West, have been changing. Both the Western and the Central region have had Ukraine’s greatest urbanization rates. This does not mean that they are currently more urbanized than the Eastern and Southern regions in absolute terms; rather, while starting at lower urbanization levels, their rates of urbanization have been greater. Second, the rural population has migrated its economic activity from rural to urban at greater rates in the Western and Central regions too (see Section 3). As a result, the relative growth in urban production has been much greater, which could explain, at least partially, the striking change observed in Figure 41. Another important aspect of this observed shift is the heterogeneous relationship found between night lights levels and economic activity across regions. The second column of Table 4 of Annex III shows that, when elasticity is allowed to vary across regions76 , it is significantly different between them. This shows that, all else being equal, the region where a city is located affects the relationship of NLs to economic activity (i.e., how much light a city emits per unit of economic activity). For example, a city in a region with a higher NLs GVA elasticity will exhibit higher growth in GVA for a given growth in NLs compared to a city in a region with lower NLs GVA elasticity. The regional differences in NLs and GVA elasticity can be explained by differences in sector composition, population and production density, and policies related to energy. Regional differences also show up when considering only urban economic activity and lights. The elasticity between NLs and economic activity was largest for the Eastern and Southern regions77 , i.e., for similar growth in NLs levels, economic activity was higher in the East and South. The opposite was the case for the West and Central regions; for these regions, an additional unit of light yielded fewer units of economic activity. This explains statistically why the higher compound growth in lights in these two regions (see Figure 41) was not necessarily accompanied by higher growth in economic activity. As discussed previously, one economic reason for this heterogeneity is likely due to the differences in the initial distribution of sectors (the East being initially much more urban and industrial while Central region being more service-oriented). Observing the evolution of economic activity at the oblast level also sheds some light on how the sector and urban population distribution shifts might have affected the NLs trend from East to West observed in Figure 42 (left panel). This figure shows that the urban production, as measured in GVA, is still concentrated largely in the oblasts of the Eastern region. However, over the period 2002-2010, growth is clearly evident in the oblasts of the Western and Central 75 Notice that in Figure 42 each pixel shows compound percentage growth relative to an initial condition, rather than absolute growth or absolute levels. 59 Ukraine_2015_nov26.indd 59 2015-11-26 5:14 PM
  • 82.
    regions (Figure 42right panel). At the same time, urbanization rates showed steady growth since 1989 in the Central and Western regions (See Figure 43). Urban production as a measure of GVA is often higher than rural production. Thus, urbanization may bring an increase in production. Again, despite the fact that oblasts showing higher labor productivity are concentrated in the Eastern part of the country(Figure 42, left panel), as captured by real GVA per worker, Central and Western regions have shown the greatest increases (Figure 44, right panel). Overall, these data suggest that the East to West trend observed in Figure 44 is mainly dynamic (corresponds to changes over time), and that these dynamics might be driven by an increasingly important urban sector in the West and Central regions. Still, the West has quite a ways to go before it reaches the East’s levels of production and urbanization. 76 Bickenbach, et. al. (2013) (Night Lights and Regional GDP, Kiel Institute for the World Economy Working Papers) uses data on Brazil, India, United States and some countries in Western Europe to show that the relationship between economic activity and night lights is not unchanging when looking at sub-national or regional units. 77 Comparisons between regions are made with respect to an omitted category, in this case the Southern region. Figure 41 – Compound growth/decline in NLs in Ukraine between 1996 and 2010 Compound Growth Rate, 1996-2010 CHAPTER 1 The urban system: Demographics and Economic Trends 60 Ukraine_2015_nov26.indd 60 2015-11-26 5:14 PM
  • 83.
    CHAPTER 1 Theurban system: Demographics and Economic Trends Figure 42 – Urban GVA production at the oblast level Figure 43 – Urbanization shows steady growth mainly in the Central and Western regions Figure 44 – Real GVA growth per worker shows strongest increase in the Western and Central region 61 Luts’kLuts’k Luts’kLuts’k Luts’kLuts’k 0.80 0.81 - 1.00 1.01 - 1.20 1.21 - 1.40 1.41 Real GVA weighted by mean Real GVA perWorker, by Oblast, 2010 30 31 - 40 41 - 50 51 - 60 61 Percent change GVA Real GVA perWorker Growth, 2002-2010 0.15 0.16 - 0.30 0.31 - 0.45 0.46 - 0.50 0.50 Urbanization Rate Urbanization Rates by Oblast, 2000-2011 0.15 0.16 - 0.30 0.31 - 0.45 0.46 - 0.50 0.50 Urbanization Rate Urbanization Rates by Oblast, 1989-2000 0.40 0.41 - 0.60 0.61 - 0.80 0.81 - 1.00 1.00 Real GVA weighted by mean Real Urban GVA by Oblast, 2010 16-18 19-32 33-43 44-60 61-75 Percent Change GVA Real Urban GVA Growth, 2002-2010 Ukraine_2015_nov26.indd 61 2015-11-26 5:14 PM
  • 84.
    First typology ofUkrainian cities using NLs: found, appear, disappear, and missed cities A first typology of cities was created by matching urban footprints – based on NLs data – and the official location of Ukraine’s 458 cities using data for 1996 and 2010. Of those settlements defined as cities by the Ukrainian government, most produce enough light to go beyond the urban threshold (discussed in Footnote 17 above). Others, however, due to their relative low scale of economic activity, did not pass this threshold in the two years analyzed. Based on this threshold, a first typology of cities was created which classified all 458 cities into one of four categories: Found, Appear, Disappear, or Missed (refer to BOX 7 below for detailed definitions). Two caveats are necessary concerning conclusions reached from this typology classification. First, the analysis is made using night lights as a proxy for economic activity, although the night lights data is not used to forecast individual, city-level GDP78 . Annex III shows that night lights data and economic activity have a strong relationship, but the correlation is not exact. As such, additional demographic and economic city- level indicators, such as firm-level data, are used to complement the analysis. Second, the elasticity between night lights and economic activity is estimated to be different between the regions (also discussed in Annex III). As a consequence, conclusions drawn from comparisons of cities in different regions based solely on night lights data are less reliable than comparisons for a single city across time. 78 Forecasting GDP for specific cities can be problematic because the methods used to derive the urban boundaries for individual cities ignore the problem of “overglow” (which causes light from a city to appear to bleed out beyond the boundary itself). This problem is a potential source of measurement error, which can become exacerbated the more fine the spatial resolution employed to obtain night lights data to derive GDP growth estimates. Found cities are settlements that produced NLs in both 1996 and 2010 that go beyond the urban threshold; as a consequence, they are considered cities in both periods. We can calculate a series of indicators for these Found cities that allow us to get a better sense of the spatial and total evolution of their economic activity over time. 254 (55%) of Ukraine’s 458 cities were classified in this category; their average population was 93,445 in 2013. Appear cities are settlements, which at the first date (1996) did not meet the “city” threshold by NLs standards, but had done so when measured in 2010. They were 50 such cities in 2013. Conversely, Disappear cities are settlements, which in 1996 were classified as cities by NLs standards, but by 2010, no longer fit the standard. 37 (8%) of the cities were classified in this category. Missed cities are settlements which did not meet the threshold for classification as cities by NLs standards in 1996 or 2010. 116 (25%) cities were in this category. These cities may be growing or declining in terms of economic activity, but do not produce enough light to be considered an urban area. The average population of these Missed cities was 18,000 in 2013, which indicates that this category comprises many small towns (small towns refers to settlements with less than 10,000 inhabitants. See Section 2 for these definitions). According to these criteria, 55 percent of Ukrainian cities were classified as Found, 11 percent were Appear, 8 percent were Disappear, and 25 percent were Missed. Missed cities are small – with populations ranging from 1,000 to 31,196 – which suggests that the NLs basis for the typology’s “city” standards is valid and that these are not important economic centers (See Figure 45 and Figure 46). By comparison, Found cities have an average population of 97,663, which suggests that NLs data indeed represents the urban settlements in the country. BOX 7 – A FIRST TYPOLOGY OF UKRAINE’S CITIES CHAPTER 1 The urban system: Demographics and Economic Trends 62 Ukraine_2015_nov26.indd 62 2015-11-26 5:14 PM
  • 85.
    Missed cities arespread across all regions, but the Eastern region held the lowest number. Most of the Missed cities are located in Lviv and Odessa. Some examples of Missed cities are: Bilozerske (Donetsk) in the Eastern region, Nosivka (Cernihiv) in the Central region, Rozhyshche (Volyn) in the Western region, and Nova Odesa (Mykolaiv) in the Southern region. The Eastern region has the highest number of Disappear cities (45 percent of all Disappear cities), followed by the Central and Southern regions with 27 and 24 percent, respectively (See Figure 47 and Figure 48). Some oblasts have been hit harder by the decline of cities than others. Luhansk Oblast alone has 24 percent of all Disappear cities, Donetsk has 19 percent, and Zaporizhia 11 percent. Some examples of Disappear cities are: Zymohiria (Luhansk) in the Eastern region, Ochakiv (Mykolaiv) in the Southern region, Khyriv (Lviv) in the Western region, and Dovbysh in the Central region. The Western region dominates in terms of Appear cities, having 31 of Ukraine’s 50 such cities (60 percent) based on NLs standards in 2010. The Central region has the next highest amount, with 17 Appear cities. In the Western region, the cities are concentrated in a few oblasts—10 cities in Lviv oblast alone, six in Ivano-Frankivsk, and five in Chernivtsy. Some examples of Appear cities are: Gorokhiv (Volyn) and Novoselytsia (Chernivtsy) in the Western region, and Biliaivka (Odessa) in the Southern region. CHAPTER 1 The urban system: Demographics and Economic Trends Figure 45 – Distribution of found, appear, disappear, and missed cities by population in 2013 Figure 46 – Distribution of missed cities by population in 2013 Source: Ukraine Statistics Department Data Source: Ukraine Statistics Department Distribution of missed cities across city sizes 100% 90% 80% 70% 60% 50% 40% 30% 20% 10% 0% Small Towns (10k) Mid-size Towns (10k-20k) Large Towns (20k-50k) Small Cities (50k-100k) Mid-size Cities (100k-500k) Major Cities (500k) Found Appear Disappear Missed Small Towns (10k) 40% Mid-size Towns (10k-20k) 52% Others (20k) 8% 63 Ukraine_2015_nov26.indd 63 2015-11-26 5:14 PM
  • 86.
    Figure 47 –Distribution of found, appear, disappear, and missed cities by geographic location (2013) Figure 48 – Distribution of found, appear, disappear, and missed cities (2013) Source: Ukraine Statistics Department Source: Ukraine Statistics Department Found Appear Disappear Missed Found Appear Disappear Missed Eastern Southern Central Western Total 100% 90% 80% 70% 60% 50% 40% 30% 20% 10% 0% Cernihiv Cernivcy Charkiv Cherkasy Crimea Dnipropetrovsk Donetsk Ivano-Frankivsk Kherson Khmelnytskyi Kiev Kirovohrad Luhansk Lviv Mykolaiv Odessa Poltava Rivne Sevastopol Sumy Ternopil Vinnytsia Volhynia Zakarpattia Zaporizhia Zhytomyr KievCity 100% 90% 80% 70% 60% 50% 40% 30% 20% 10% 0% CHAPTER 1 The urban system: Demographics and Economic Trends 64 Ukraine_2015_nov26.indd 64 2015-11-26 5:14 PM
  • 87.
    CHAPTER 1 Theurban system: Demographics and Economic Trends 79 A third dimension is determined by “extensive growth,” which measures the growth of lights in the periphery. It is calculated by establishing the periphery as the portion of the urban footprint that exists in the second period but did not exist in the first, and then comparing the amount of light emitted by this periphery in both periods. This interpretation, however, is a little less intuitive for the case of shrinking cities, in which the periphery is disappearing as the city shrinks. An analysis employing this fourth dimension can be found in Annex VI. 80 Two years of NLs are required to do this analysis, so cities classified as Disappear, Missed, and Appear are excluded from it. 81 This type only includes two cities: Donetsk and Zaporizhia. Thus, the section abstains from drawing strong conclusions about this type since they would only be based upon two observations. Second typology of Ukrainian cities using NLs: identifying growing and declining cities A second city typology classified cities across two dimensions – change in their NLs urban footprint and change in their NLs intensity – as a proxy of economic activity.79 NLs data was used to assess whether economic activity was increasing or decreasing, as well as to determine whether a city’s footprint was growing or shrinking in area. These two dimensions make the analysis using NLs unique and were the basis for a second typology of cities. For this typology, a city’s “baseline” footprint and light intensity was compared to that of a following analyzed year. In this case the comparison was made between 1996 (T0) to 2010 (T1)80 . The typologies were built as described in BOX 8, and cities were classified according to the following types: Type 1 cities (in BLUE) are cities presenting a thriving urban core (growing light intensity) and growing urban footprint. Type 2 cities (in GREEN) are cities presenting a dimming urban core (declining light intensity) and shrinking urban footprint. Type 3 cities (in BLACK) are cities presenting a dimming urban core and expanding urban footprint. Type 4 cities (in RED) are cities presenting a thriving urban core and shrinking urban footprint81 . The second typology was calculated by looking at the combination of light intensity change and urban footprint area change for each city, as explained below, between 1996 and 2010: - Urban footprint area change corresponds to the change in area of what is considered the urban footprint by NLs standards in T0 against what is considered the area of urban footprint in T1. Area Change is estimated as (B – A) / A. - Intensity change refers to the change in brightness in the urban core (footprint in T0) between these two years. Intensive change is estimated as Y – A. BOX 8 – A SECOND TYPOLOGY OF UKRAINE’S CITIES 65 CITY FOOTPRINT (1996 - 2010) T0NTL A Z T0footprint T1footprint The columns represent the summed nighttime lights values for the identified footprint T1NTL Y B Ukraine_2015_nov26.indd 65 2015-11-26 5:14 PM
  • 88.
    There is astrong positive correlation between area growth and intensive growth, which is exactly what the second typology intends to capture (See Figure 49). A strong correlation means that in most cases when economic activity increased in the city’s core, cities also tended to grow in area or that when economic activity decreased in the city’s core, cities also tended to shrink in area. The first case, corresponding to Type 1 cities, are cities that are both growing in area and in the amount of lights emitted by their cores. Again, this implies a thriving core and a spillover effect that leads to a growing periphery. The second case, corresponding to Type 2 cities, are those which have a core with dimming NLs intensity and a shrinking urban NLs footprint. For Type 2 cities, not only are NLs values in the city’s core declining, but their area is also shrinking; i.e., in 2010 some of the urban footprint no longer has NLs above the urban threshold. The positive correlation is not observed in Type 3 cities, which present a decrease in NLs activity in the core of the city, but an expansion of this activity in the new surrounding areas. This is a sign of sprawl, but also of a growing importance of areas that previously were considered urban by NLs standards. Finally, Type 4 cities show a densification of its economic activity, represented by a thriving core, in terms of night lights, but a shrinking NLs footprint. Table 9 presents summary statistics for each city type. Annex V presents the full list of Ukrainian cities classified according to this typology. Type 1 cities – with a thriving core and expanding urban footprint – are on average larger, declining less in population terms, and more productive than other types. They have on average 176,300 inhabitants and although – on average – they are still experiencing demographic decline, their decline is the lowest compared to the other types. They present also the highest levels of economic activity per capita, as measured by night lights divided by the city population, suggesting that these cities are most productive. Once more, recall that night lights are used to determine typologies, but that they also portray economic activity to some extent. In addition, these cities have a higher average total economic growth (585 percent), captured by night lights data than the rest suggesting that these cities are the true growth engines in the country. However, the simultaneous growth of the urban footprint with the observed demographic decline suggests that these cities are sprawling82 . Examples of Type 1 cities are: Odessa, Lutsk, Kyiv, Kharkiv, and Lviv. Around 22 percent of cities in Ukraine fall under this type. 82 Sprawling is a hypothesis based on the growth of the urban footprint despite population decline. However, the NLs footprints do not correspond to the city’s boundaries and therefore population data might not correspond to the population living inside the urban footprint defined through NLs. Figure 49 – Changes in NLs urban footprint vs. changes in NLs intensity in the urban core CHAPTER 1 The urban system: Demographics and Economic Trends 66 Periphery expansion and intensive growth. Ukraine 1996-2010 percentage intensive growth percentageareagrowth Type 1Type 3 Type 2 Type 4 Ukraine_2015_nov26.indd 66 2015-11-26 5:14 PM
  • 89.
    CHAPTER 1 Theurban system: Demographics and Economic Trends 83 Only one city, Donetsk, located in the oblast of the same name, is not in this typology as it presents a negative area change and a positive intensity growth. 84 This type only includes two cities: Donetsk and Zaporizhia. Thus, the section abstains from drawing strong conclusions about this type since they would only be based upon two observations. Type 2 cities are, on the contrary, declining in all aspects – with decreasing economic activity - as captured by night lights in both the core and the periphery – a shrinking urban footprint, and declining population. These cities are smaller than thriving Type 1 cities; their average population is 54,000 inhabitants. In addition to experiencing a decline in economic activity, these cities present a sharp decline in population – with 0.54 percent annual decline on average – and have lowers levels of productivity than thriving Type 1 cities measured by NLs per capita. Examples of a Type 2 city are: Dnipropetrovsk, Hirnyk, and Kramatorsk. The majority of cities in Ukraine (53 percent) fall under this type. Growing area Shrinking area + Intensity growth Type 1: Thriving core, expanding area Type 4: Thriving core, shrinking area44 Mean (Std dev) Mean (Std dev) Population 2013 (000s) 176.3 (411.1) 861 (129) Average annual population growth (1989-2013) -0.20 % (.477) -0.59% (0.041) Total NLs value (000s of NLs units) in 2010. 13.49 (37.01) 69.11 (44.80) NLs per capita (000s of NLs units) (2010) 0.065 (.062) 0.077 (0.048) NLs growth (% Growth of NLs units) (1996-2010) 321% (4.36) Examples: Odessa, Lutsk, Kyiv, Kharkiv, Lviv 142.6% (1.23) Examples: Donetsk, Zaporizhia - Intensity growth Type 3: Dimming core, expanding area Type 2: Dimming core, shrinking area Mean (Std dev) Mean (Std dev) Population 2013 (000s) 49.1 (80.4) 54.0 (115.3) Average annual population growth (1989-2013) -0.56% (.584) -0.57% (.541) Total NLs value (000s of NLs units) in 2010. 2.62 (5.89) 2.72 (8.68) NLs per capita (000s of NLs units) (2010) 0.032 (.069) 0.043 (.102) NLs growth (% Growth of NLs units) (1996-2010) 142% (.056) Examples: Mykolaiv, Sumy, Kirovohrad -15400% (314) Examples: Dnipropetrovsk, Hirnyk, Kramatorsk. Table 9 – Typology of cities based on NLs observations between 1996 and 2010: selected statistics 67 Ukraine_2015_nov26.indd 67 2015-11-26 5:14 PM
  • 90.
    Type 3 cities,which represent a dimming core and an expanding NLs footprint, have experienced the fastest population decline and present the lowest levels of productivity. These cities show a 0.63 percent annual population decline on average (while numerically close, the statistical impact of this rate is significantly lower than that observed in cities of Type 2). The growth of the urban footprint accompanied by the observed demographic decline suggests that these cities are sprawling. Examples are Mykolaiv, Sumy, and Kirovohrad. Approximately 24 percent of cities in Ukraine fall under this type. There are only two cities in the final category of Type 4 cities: Donetsk and Zaporizhia. These cities are historically large cities that have recently seen their footprint shrink. At the same time, economic activity, as captured by night lights data, has increased in the core. This suggests a densification of economic activity. Despite showing declining population, this densification could induce agglomeration economies that further improve their economic performance. There are important demographic and economic differences captured by this second typology. Table 9 shows the averages of indicators for each city type. The differences suggest that the combination of night light intensity and growth that determine this second typology may also correspond to its population and economic dynamics. Figure 50 shows that the distribution of city sizes is different between types. Type 1 cities are overall larger, while Type 2 has the largest share of small towns. The dynamics among the types also vary. Figure 51 shows that Type 1 cities have more cities with positive growth, while many Type 2 and Type 3 cities are declining in population more than even the national average. 85 Type 4 is excluded as it has only two cities, Donetsk and Zaporizhia. However, both are major cities. Figure 50 – The distribution of city sizes varies across types in the second typology; type 1 cities are overall larger85 Type of city according to size 1. Thriving core, expanding area 3. Dimming core, expanding area2. Dimming core, shrinking area Small Towns (10k) Mid-size Towns (10k-20k) Large Towns (20k-50k) Small Cities (50k-100k) Mid-size Cities (100k-500k) Major Cities (500k) 100% 90% 80% 70% 60% 50% 40% 30% 20% 10% 0% CHAPTER 1 The urban system: Demographics and Economic Trends 68 Ukraine_2015_nov26.indd 68 2015-11-26 5:14 PM
  • 91.
    CHAPTER 1 Theurban system: Demographics and Economic Trends 86 Type 4 is excluded as it has only two cities, Donetsk and Zaporizhia. Both are in the growth category of declining but less than national average. 87 Recall that growth in night lights intensity tends to also reflect growth in intensity of economic activity in the city. The characteristics used to identify this second typology also have a strong relationship to population dynamics. Figure 52 shows that almost all Type 2 cities are experiencing negative population growth as well as negative area growth. The other two types are split between negative and positive population growth, meaning that some cities continue to expand in area despite their population decline. Similarly, Figure 52 shows that cities of Type 2 show overall negative growth in intensity87 and negative growth in population. The other two types are split between positive and negative population growths. Figure 52 and Figure 53 show that a classification based on NLs groups cities into meaningful clusters in the sense that they also share some demographic characteristics. Overall, the shrinking footprints imply a loss of population. However, in some cases there could be population loss despite increases in area (in Types 1 and 2), which suggests a sort of sprawling; this dynamic affects a fairly large number of cities. Similarly, although a minority, some cities show population growth accompanied by a decline in economic activity in the core as measured by reduced intensity growth, as well as some cities that present population decline with a significant increase in the light emitted at the core (mainly cities of Type 1). In the later, shrinking does not seem to come at the expense of economic growth. One possible explanation for this is that the city was oversized and is moving towards a new population equilibrium (lower population) that is linked to lower congestion costs which in turn lead to an increased productivity. Figure 51 – The distribution of cities by economic growth varies across types in the second typology; type 1 cities have more cities with positive growth86 1. Thriving core, expanding area 3. Dimming core, expanding area2. Dimming core, shrinking area 100% 90% 80% 70% 60% 50% 40% 30% 20% 10% 0% Declining more than national average Declining but less than urban average Declining but less than national average Positive growth Type of city according to growth category 69 Ukraine_2015_nov26.indd 69 2015-11-26 5:14 PM
  • 92.
    Figure 52 –The distribution of cities by economic growth varies across types in the second typology; type 1 cities have more cities with positive growth Periphery expansion and population growth 1996-2010 CHAPTER 1 The urban system: Demographics and Economic Trends 70 Annual percentage population growth Annualpercentageareagrowth Figure 53 – Intensity of night lights has a strong relationship to population dynamics Intensive growth and population growth Annual percentage intensive growth 1996-2010 Annualpercentagepopulationgrowth Ukraine_2015_nov26.indd 70 2015-11-26 5:14 PM
  • 93.
    Agglomerations: important enginesof growth Agglomerations – groupings of individual cities that function as a single city due to the proximity of and interaction between their housing, labor, and commercial markets and whose NLs footprints merge – are considered as one urban entity under the NLs analysis. In total, Ukraine has 23 agglomerations that are composed of 79 cities, an average of four cities per agglomeration. The figure below presents Kyiv’s agglomeration and the growth of its NL urban footprint from 1996 until 2010. As can be seen, some cities that were separate cities surrounding Kyiv in 1996 merged to produce a single urban footprint by 2010. Table 10 below presents the full list of Ukraine’s agglomerations and their respective population totals. CHAPTER 1 The urban system: Demographics and Economic Trends Figure 54 – The distribution of types of cities varies by region;the western region has the majority of thriving (type 1) cities88 As expected, the second city typology also reveals differences in the distribution of city types across regions (Figure 54). While 76 percent of the Western region’s cities are thriving (Type 1), only 7 percent of Eastern region cities can be classified as such. In contrast, 81 percent of the Eastern region’s cities are in the Type 2 category. The southern region also has many cities in that category, and has the least Type 3 cities. The Central region has the largest share of Type 3 cities, where economic activity is declining in the core but growth is occurring in the urban footprint. 88 Type 4 has only two cities, Donetsk and Zaporizhia. Donetsk is in the Eastern region, while Zaporizhia is in the Southern region. Figure 55 – Kyiv’s agglomeration 1996-2010 Type by region 1. Thriving core, expanding area 3. Dimming core, expanding area 4. Thriving core, shrinking area 2. Dimming core, shrinking area Western Eastern Central Southern 100% 90% 80% 70% 60% 50% 40% 30% 20% 10% 0% 01 2.5 25 75 100 Kilometers 1996 2010 Chernihiv 71 Ukraine_2015_nov26.indd 71 2015-11-26 5:14 PM
  • 94.
    Main City OblastCities in Agglomeration Population of agglomeration 2013e Kyiv Kyiv 9 3171830 Kharkiv Charkiv 6 1620930 Donetsk Donetsk 8 1506200 Odessa Odessa 2 1074570 Dnipropetrovsk Dnipropetrovsk 2 1017250 Lviv Lviv 4 765901 Luhansk Luhansk 2 432483 Sevastopol Sevastopol 2 354565 Horlivka Donetsk 1 353497 Dniprodzerzhynsk Dnipropetrovsk 2 351950 Cherkasy Cherkasy 2 303168 Kramatorsk Donetsk 4 297665 Sieverodonetsk Luhansk 4 281903 Rivne Rivne 2 274902 Ivano-Frankivsk Ivano-Frankivsk 1 235515 Lutsk Volhynia 2 234147 Drohobych Lviv 4 162527 Alchevsk Luhansk 3 144807 Stakhanov Luhansk 3 139474 Krasnoarmiysk Donetsk 3 125239 Krasnodon Luhansk 2 65344 Nova Kakhovka Kherson 2 58853 Debaltseve Donetsk 2 38126 CHAPTER 1 The urban system: Demographics and Economic Trends Table 10 – Ukraine’s agglomerations: merged NL urban footprints (2013) 72 Ukraine_2015_nov26.indd 72 2015-11-26 5:14 PM
  • 95.
    89 Type 4has only two cities, Donetsk and Zaporizhia. Donetsk is part of an agglomeration (it is also its main city); Zaporizhia is an individual city. CHAPTER 1 The urban system: Demographics and Economic Trends Agglomerations are particularly important engines of growth. 43 percent of Ukraine’s agglomerations experienced positive economic growth according to NLs data compared to only 22 percent of individual cities. Total production (as measured by total NLs in the urban footprint) of agglomerations was 14 times higher - on average – than that of individual cities. Part of this is of course due to their relative greater scale. However, labor productivity (measured by NLs per capita) is also much higher on average (17 percent higher in agglomerations than in individual cities) with a significant difference between the means; and spatial productivity (measured by NLS by km2) is also higher (100 percent higher in agglomerations relative to individual cities). All of these differences are statistically significant. Additionally, almost all urban economic growth – as measured by total NLs – is concentrated in the growing agglomerations, suggesting they are the true engines of growth in the country. Kyiv, Kharkiv, Donetsk, and Lviv are the fastest growing agglomerations of NLs; Dniprodzerzhynsk, Dnipropetrovsk, and Kramatorsk are the fastest declining. There is also a close correlation between agglomerations and types of cities (See Figure 56). 40 percent of agglomerations are Type 1, as opposed to 22 percent of individual cities. By contrast, cities are more likely to be classified as Type 3, i.e., dimming and expanding, if they are individual cities: nine percent of agglomerations are Type 3, while 24 percent of individual cities are. Type 2 cities are a little more evenly distributed (50 percent of agglomerations and 53 percent of individual cities). Of the two cities categorized as Type 4, Donetsk is an agglomeration. Consequently, in this case, the analysis utilizing night lights data strongly supports the conclusions made in Section 2 that agglomerations are the country’s centers of growth. Figure 56 – Distribution of agglomerations and individual cities by city type; agglomerations are disproportionately thriving (type 1)89 Type of city for individual cities and cities that belong to an agglomeration Agglomeration Single city 1. Thriving core, expanding area 3. Dimming core, expanding area 4. Thriving core, shrinking area 2. Dimming core, shrinking area 100% 90% 80% 70% 60% 50% 40% 30% 20% 10% 0% 73 Ukraine_2015_nov26.indd 73 2015-11-26 5:14 PM
  • 96.
    CHAPTER 1 Theurban system: Demographics and Economic Trends Built-up areas Built-up areas are another spatial measure of economic growth of great importance. These areas indicate the presence of population and corresponding economic activity, although the dynamics of built-up areas may not follow these others. For example, since built residences and infrastructure is durable, it can remain even after population has declined. Similarly, policies that support building could increase the observed built-up area, while the same area sees its economic activity move away. Ukraine has shown a large increase in built-up areas despite its population decline. The Global Human Settlement Layer, developed by the GLOB-HS and E-URBAN teams, provides accurate measurements of built-up areas. Based on this data, Table 11 shows information on built-up areas for the 40 countries with the highest increases over the last 40 years. Ukraine ranks 5th , with 76,202 square kilometers added to the built-up area foundation. This is striking, given that during the same period the country experienced negative population growth; in fact, Ukraine and Romania are the only two countries in this ranking that registered negative population growth. As a consequence, Ukraine presents the highest rate of built-up area per person. Some of the policies that motivated the building of homes during the Soviet era have been previously discussed in Section 2, but the growth of these built-up areas in Ukraine continued after independence. This is demonstrated by the fact that Ukraine occupies 4th in the world in producing new built-up areas over the last 15 years (See Figure 57) Figure 57 – Ukraine is 4th in absolute number of new built-up areas over the last 15 years 50,100,000,000 45.100.000.000 40.100.000.000 35.100.000.000 30.100.000.000 25.100.000.000 20.100.000.000 15.100.000.000 10.100.000.000 5.100.000.000 100.000.000 China UnitedStates India Russia Ukraine Indonesia Germany Japan Brasil France Turkey Mexico Italy Poland Nigeria Vietnam SouthAfrica Spain UnitedKingdom Thailand Pakistan Iran Canada Burma Uzbekistan Philippines Algeria Argentina Iraq Egypt Ethiopia Bangladesh DRCongo Morocco Columbia Korea,South Sudan Uganda Tanzania Kenya Afghanistan Peru built-up 2000-2014 New built-up areas 2000-2014 Source: Global Human Settlements Layer – European Commission 74 Ukraine_2015_nov26.indd 74 2015-11-26 5:14 PM
  • 97.
    CHAPTER 1 Theurban system: Demographics and Economic Trends Table 11 – Top global increment of built-up last 40 years 90 Monitoring of Execution of the Master Scheme of Territorial Development of Ukraine (Law). This striking growth in construction could represent a response to the lifting of long-standing limitations on construction as well as a strong focus of household investments in the real estate sector. Current economic trends (Figure 58) do not seem to justify the strong growth in built-up areas, suggesting that this growth is happening as a consequence of institutional changes and current policies. Several characteristics of the Ukrainian housing market are relevant here. First, the many restrictions on construction that existed during the Soviet era prevented Ukrainians from having access to a wider array of housing choices. Despite high urbanization levels, many families still shared residences at the beginning of the 1990s. Construction followed the elimination of many of these restrictions, which included limitations on the size of structures built in rural areas, on construction of new urban residential units outside of the cooperative system, and on construction of commercial buildings. Second, the influx of remittances provided a new source of capital to finance new housing projects to meet public demand. Finally, with a local financial sector that does not provide abundant investment opportunities, real estate has been the main sector of investment or households in Ukraine. This reality further motivated residential and commercial construction.90 Country GHSL built-up areas (sq km) WB population (millions of persons) BU surface per capita (m2 /person) 1975 1990 2000 2014 2014-1975 1975 1990 2000 2013 2013- 1975 1975 1990 2000 2004 United States 66,522 93,653 128,794 171,857 105,335 215.97 249.62 282.16 316.13 100.16 308.0 375.2 456.5 543.6 China 33,580 47,251 66,370 109,782 76,202 916.40 1135.19 1262.65 1357.38 440.99 36.6 41.6 52.6 80.9 India 10,176 14,051 19,285 39,898 29,722 622.23 868.89 1042.26 1252.14 629.91 16.4 16.2 18.5 31.9 Russian Federation 21,139 29,997 40,147 50,479 29,340 134.20 148.29 146.60 143.50 9.30 157.5 202.3 273.9 351.8 Ukraine 12,018 16,367 22,937 33,239 21,222 48.76 51.89 49.18 45.49 -3.27 246.5 315.4 466.4 730.7 Germany 11,875 16,423 21,983 28,633 16,758 78.67 79.43 82.21 80.62 1.95 150.9 206.8 267.4 355.2 Brazil 16,797 19,950 27,572 33,159 16,362 108.22 149.65 174.50 200.36 92.14 155.2 133.3 158.0 165.5 Indonesia 11,532 14,078 18,789 27,218 15,686 129.21 178.63 208.94 249.87 120.66 89.3 78.8 89.9 108.9 France 8,245 11,714 15,894 21,256 13,020 54.03 58.41 60.91 66.03 12.00 152.6 200.5 260.9 322.1 Japan 9,335 12,483 16,294 22,106 12,771 111.94 123.54 126.87 127.34 15.40 83.4 101.0 128.4 173.6 Mexico 6,343 9,350 13,295 18,047 11,704 61.71 86.08 103.87 122.33 60.62 102.8 108.6 128.0 147.5 Italy 5,826 8,333 11,568 15,533 9,707 55.44 56.72 56.94 59.83 4.39 105.1 146.9 203.2 259.6 Turkey 4,250 6,155 8,831 13,540 9,290 39.19 53.99 63.17 74.93 35.75 108.5 114.0 139.8 180.7 Canada 6,756 9,522 13,146 15,317 8,560 23.21 27.79 30.77 35.16 11.95 291.1 342.6 427.2 435.6 Australia 6,306 8,882 12,257 14,605 8,299 13.89 17.07 19.15 23.13 9.24 453.9 520.5 639.9 631.4 Romania 4,265 5,762 8,093 12,559 8,293 21.29 23.20 22.44 19.96 -1.33 200.3 248.3 360.6 629.1 United Kingdom 6,648 8,864 11,436 13,813 7,165 56.23 57.25 58.89 64.10 7.87 118.2 154.8 194.2 215.5 Poland 3,740 5,516 7,740 10,743 7,004 34.02 38.11 38.26 38.53 4.52 109.9 144.7 202.3 278.8 South Africa 3,321 4,819 6,457 8,969 5,648 24.73 35.20 44.00 52.98 28.25 134.3 136.9 146.8 169.3 Spain 2,902 4,059 5,661 7,972 5,071 35.53 38.85 40.26 46.65 11.12 81.7 104.5 140.6 170.9 Nigeria 1,893 2,769 3,830 6,615 4,723 63.57 95.62 122.88 173.62 110.05 29.8 29.0 31.2 38.1 Argentina 3,471 4,849 6,532 7,885 4,414 26.07 32.62 36.90 41.45 15.38 133.1 148.6 177.0 190.2 Source: Global Human Settlements Layer – European Commission 75 Ukraine_2015_nov26.indd 75 2015-11-26 5:14 PM
  • 98.
    CHAPTER 1 Theurban system: Demographics and Economic Trends Figure 58 – Prosperity is not pushing the massive addition of built-up areas in Ukraine Key messages and implications for further policy and analytical work Ukrainian cities are important engines of economic growth. Not only is urban sector production much greater than rural production in absolute terms, it is also much more productive per capita. Agglomeration economies have yielded higher productivity as cities offer settings for firms and workers to take advantage of sharing, matching, and learning mechanisms. Firm-level data showed that larger cities attracted more firms and cities with higher population density hosted more productive firms. Nightlights (NLs) patterns exhibited by cities are also quite different across Ukraine’s regions, with a noticeable shift of NLs growth from East to West. Urban footprints captured by NLs are growing rapidly in the West while they are either declining or growing significantly slower in the East. One possible explanation is the stronger growth of the urban sector in the West (Western and Central regions) relative to 1996 levels. The East (Eastern and Southern regions), while starting at a higher level of urbanization, has further urbanized more slowly, resulting in a slower growth of NLs. Similar dynamics show up in the first city typology91 of NLs urban footprints and city location dynamics. Built-up vs. GDP pro capita 60,000 50.000 40.000 30.000 20.000 10.000 0 0 100 200 300 400 500 600 700 800 Built-up surface pro capita (GHSL 2014) GDPprocapita(WB2013) Source: Global Human Settlements Layer – European Commission 76 Ukraine_2015_nov26.indd 76 2015-11-26 5:14 PM
  • 99.
    CHAPTER 1 Theurban system: Demographics and Economic Trends The Eastern region has the highest number of Disappearing cities, followed by the Central and Southern regions. By contrast, the Western region had the most Appearing cities, followed by the Central region. Cities that increase in brightness and expand in footprint are on average performing better in other indicators (i.e., population decline, total economic activity and productivity). These cities (Type 1) have significantly lower declines in population and higher concentrations of economic activity as measured by light emissions per capita as well as rate of growth. The majority of the largest cities of the country are Type 1. Among the cities whose core is declining in night lights, results are mixed. Those with expanding footprints (Type 3) seem to be growing more rapidly in economic terms. However, they are also losing population more rapidly than those cities that have a dimming core and whose footprint is shrinking (Type 2). Only two cities comprise Type 4. These are large cities that, despite losing population, present growing economic activity. Built-up areas in Ukraine have grown significantly, at a pace that does not seem to correspond to economic or demographic indicators. Despite its decline in population, Ukraine ranked 4th globally - in terms of growth of built-up area - over the past 15 years. Consequently, it presents the highest rate of new built-area per person. These trends are most likely a result of long-suppressed housing demand that motivated construction upon the lifting of Soviet-era construction limitations, as well as a result of a strong focus of household investments in the real estate sector. Finally, agglomerations are particularly important engines of economic growth in the country. Agglomerations constitute a majority of the few urban centers that are actually growing in population in Ukraine. In addition, according to NLs measurements, agglomerations are more productive in both per capita and per km2 terms. There are also close correlations between agglomerations types of cities (for example, all major cities are in the Found category), and more agglomerations are thriving and growing (Type 1 in the second city typology). Going forward Ukraine should recognize the role of urban areas in economic growth and make sure that they count with the right tools to reach their full potential. To achieve increased productivity in urban centers, the right mix of good governance, a beneficial business climate, and an efficient provision of public goods, usually in the form of public services and infrastructure is necessary so that agglomeration economies are fostered and congestion costs reduced. In urban areas experiencing population growth, cities will to focus on adapting infrastructure and services making sure that new- comers are well absorbed and integrated in the city; manage peri-urban growth to avoid sprawl, etc. In addition, the realignment of city boundaries or introduction of metropolitan governance mechanisms might be needed to achieve an effective coordination of agglomerations which span across administrative units. This is particularly important in the case of public transport. The country also needs to put in place the right policies to better manage urban population decline. As observed in this section an important number of cities – despite declining in population – continue to grow economically. This means that in these areas, shrinking is not necessarily coming at the expense of economic growth. While this might be a reflection of a temporal increase in productivity due to an increase in the capital per worker ratio - as observed at the national level – it might also be linked to a decline of congestion costs associated with the city moving towards a new population equilibrium. In these cases, city administrators should aim at managing population decline in an efficient and harmonious way making the best out of it (e.g. turning brownfields into public space, optimizing public transportation). 91 The first typology of cities is defined based on whether cities emit enough light to be considered urban areas in the initial and subsequent years analyzed. The second typology based on the growth of the light emitted in the core of the city and whether the city’s NLs footprint grew or shrank. 77 Ukraine_2015_nov26.indd 77 2015-11-26 5:14 PM
  • 100.
  • 101.
    79 CHAPTER 2 Cities andthe Inter-Governmental Fiscal System Ukraine_2015_nov26.indd 79 2015-11-26 5:14 PM
  • 102.
    Key Highlights andImplications for Further Policy and Analytical Work Ukraine is undergoing a major reform of its inter-governmental fiscal system. Until 2014, the majority of fiscal revenues were not raised by city governments but came from retained shares of national taxes and transfers. The allocation of these transfers was largely based on the existing network of service facilities and staffing as opposed to the demand for services. The system of intergovernmental transfers has led to wide disparities across city types in per capita levels of expenditures per function. The highest per capita expenditures were observed in cities with declining core and periphery, and the lowest – in growing cities with expanding footprint. Such financial disincentives, combined with legal constraints on local government’s discretion in downsizing the network of facilities and their staff, impeded fiscal adjustments necessitated by Ukraine’s demographic and economic changes. In December 2014, the Budget Code was significantly changed. As a result, the new equalization system will factor in per capita revenue levels and thus significantly decrease the disincentive that focuses on infrastructure need. Such re-design of the transfer mechanism would likely realign resources among local governments, channeling more resources to large and growing cities. Derivation-based sharing of revenues although partially mitigated with a new basic grant, will likely exacerbate the impact on shrinking cities. It will, however, improve the efficiency of spending. These changes are expected to improve fiscal autonomy and to better align public services with the need of local communities. Going forward, in addition to operationalizing the new Budget Code, Ukraine’s policy makers may rethink the structure of functional sub-national expenditure in view of changing demographics. So far, expenditures for education have been steadily increasing despite the rapidly aging population placing increasing demands on the health system. By earmarking new subventions separately for education and health, the new system can further entrench under-utilized social infrastructure. More generally, the focus of reforms in the short-term could be on increasing the yield of user fees and property taxes as a way to make cities assume their responsibility to collect own revenue. In the medium term, some of these taxes could be reassigned from national to the subnational level as a way to increase horizontal accountability of local officials to their residents as well as fiscal responsibility. Finally, addressing the fiscal fragmentation and amalgamating the bottom tier should remain a priority for the government as a way to improve fiscal efficiency in service provision. CHAPTER 2 Cities and the Inter-Governmental Fiscal System 80 Ukraine_2015_nov26.indd 80 2015-11-26 5:14 PM
  • 103.
    17 I. The Inter-GovernmentalSystem Ukraine is a unitary state with three tiers of sub-national government as presented in the introduction section of this study. Its current territorial division suffers from excessive fragmentation at the bottom tier. This is common in other post-Soviet countries, where local self-government was established in pursuit of greater democracy and local control rather than efficiency of public services. Given that local authorities bear responsibility for major social services, such as education and health care, the average locality’s size of 1,400 residents at the lowest administrative level of government is too small to achieve the minimum efficient scale of provision93 . Addressing the fiscal fragmentation issue has been attempted in several administrative-territorial reform proposals aimed at amalgamating the bottom-tier municipalities in order to increase their average size and reduce disparities in population size. However, none of those reforms has been fully implemented. The recently-adopted Law on Voluntary Amalgamation of Territorial Units, which is accompanied by new Budget Code provisions, is the first sound step towards re-starting such reforms, but it still has to be implemented. About 70 percent of the national population resides in urban areas. This share is higher than the 50 percent average of the world’s middle-income countries, but on par with the 70-percent average in Europe and Central Asia94 . Of the total urban population, 27.5 million reside in cities while the remaining 3.8 million reside in town-lets. (The distinction between a city and a town-let designation is not entirely determined by population size as there are five town-lets with population over 15,000 people while at the same time almost a quarter of cities have populations under 10,000). 92 Figures that do not include a source in this Chapter were developed by World Bank staff working on the report. 93 World Bank. 2008. Ukraine - Improving Intergovernmental Fiscal Relations and Public Health and Education Expenditure Policy: Selected Issues. Washington, DC: World Bank. 94 World Bank. 2014. World Development Indicators. Washington, DC: World Bank. CHAPTER 2 Cities and the Inter-Governmental Fiscal System Figure 59 – Sub-national governments account for almost half of public expenditures92 46% 45% 44% 43% 42% 41% 40% 240 230 220 210 200 190 180 2009 2010 2011 2012 2013 Subnational public expenditures in constant 2013 prices, bln. UAH(rs) SNG share in GG expenditures 81 Ukraine_2015_nov26.indd 81 2015-11-26 5:14 PM
  • 104.
    All local governmentscombined (at all three tiers covering both rural and urban settlements) account for almost half of total national public expenditures and are responsible for the majority of public expenditures on essential social services (see Figure 59 above). In particular, in 2013 sub-national governments accounted for 80 percent of public expenditures in health and 70 percent of public expenditures in education in 2013. In fact, the three social sectors (education, health care, and social welfare) accounted for over 80 percent of sub-national expenditures (See Figure 60 below). While showing some fluctuation from year to year, on average total sub-national expenditures have increased in real terms by 12 percent over 2009-2012. This is roughly proportional to Ukraine’s GDP growth. 95 Id. World Bank. 2008. 96 Ibid. Given the sub-optimal size of local governments, it is not surprising that other studies have found under-utilized social infrastructure in Ukraine. Ukraine has one of the lowest student/teacher ratios in the world, combined with a low teaching load per teacher95 . Similarly, more health care inputs (hospitals, beds, doctors, nurses, and non-medical staff) per 10,000 residents are used in Ukraine than in in the new EU member states and the EU countries in general; this dynamic is further aggravated by an inflated average length of stay in public health care facilities96 . In addition to the fragmented territorial structure, the efficiency of service delivery is further undermined by demographic changes combined with legal constraints on local governments’ discretion in closing health facilities and schools or firing personnel. Despite Ukraine’s aging population, the structure of sub-national expenditure has not shifted from education to health care. In fact, sub- national expenditures on education have been steadily increasing from 4.5 percent of GDP in 2009 to 5 percent of GDP in 2013 (see Figure 61 above). Sub-national governments have little authority to increase their revenues. The limited revenue rate- setting discretion that they have only applies to the short list of their own sources of local revenues, which accounts for only 10 percent of sub-national budgets. Over 80 percent of sub-national revenues come from retained shares of national taxes and other transfers (see Figure 62 below). While the sub-national revenues from all property taxes combined are on par with other countries in the region (0.78% of GDP in 2012), most funds for sub-national expenditure come from the national taxes on land and vehicles over which local governments have no rate-setting or collection authority. By contrast, taxation of structures (the only local property tax) generated less than 0.01% of GDP in both 2012 and 2013. The low level of revenue autonomy at the sub-national level allows sub-national governments to avoid deprives the system of an appropriate level of accountability and fiscal responsibility for subnational governments. The heavy dependence on shared tax revenues and all other transfers from the national budget (see Figure 61) has stood at above 80 percent CHAPTER 2 Cities and the Inter-Governmental Fiscal System Figure 60 – Sub-national expenditures are dominated by the three social sectors 82 100% 80% 60% 40% 20% 0% 18% 16% 14% 12% 10% 8% 6% 4% 2% 0% Other Health CareSocial Welfare EducationHousing and Utilities %ofGDP %oftotalexpenditures 2009 2009 2010 2010 2011 2011 2012 2012 2013 2013 Ukraine_2015_nov26.indd 82 2015-11-26 5:14 PM
  • 105.
    of total localrevenues over the last five years. Even the City of Kyiv, the wealthiest local government, receives almost a quarter of its revenues in the form of grants from the national budget and another 40 percent from national taxes collected in its territory. It is not surprising to see that the steady increase in the total volume of grants over the years coincided with increasing expenditures on education despite a decline in school-age population. For other countries, Figure 63 below reveals high transfer dependence in countries where sub-national governments play a larger role in the provision of health care and education. Given that Ukraine’s local governments play a larger share in the provision of social services, such as general education and health care, than most other countries in the region, such high transfer dependence is unavoidable. CHAPTER 2 Cities and the Inter-Governmental Fiscal System Figure 61 – Composition of sub-national revenues, 2005-2012 Figure 62 – Decentralization of social services is associated with transfer dependence Note: Transfer dependence is measured by the share of total sub-national revenues accounted for by all kinds of transfers, including sharing of revenues from national taxes obtained at the source. In the case of Ukraine, transfers include all sub-national revenues except those from local taxes and non-tax sources. 83 Grants OtherTaxes PIT Taxes on goods and services Property Taxes Non-Tax 20% 15% 10% 5% 0% 2005 2006 2007 2008 2009 2010 2011 2012 %ofGDP 0.50 0.75 0.55 0.80 0.60 0.85 0.65 0.90 0.70 0.95 0.1 0.50 0.75 0.55 0.80 0.60 0.85 0.65 0.90 0.70 0.95 0.1 0.00 0.000.20 0.200.40 0.400.60 0.600.80 0.801.00 1.00 Grantdependence Education Decentralization Healthcare Decentralization Ukraine_2015_nov26.indd 83 2015-11-26 5:14 PM
  • 106.
    To reinforce incentivesfor fiscally responsible behavior under such high transfer dependence, local government financing of its spending decisions—at least at the margin—becomes critical.97 Additional spending should require raising additional tax revenue (rather than seeking higher transfers from the central government). A key problem with transfers is that the local governments receiving them are likely to perceive the additional funds as having a zero marginal cost to them in political and economic terms. In contrast, the use of local revenues is likely to make local governments face the real economic as well as political costs of obtaining and expending additional public funds, thus increasing fiscal responsibility and political accountability of local officials. In addition, financing local government expenditures via transfers can reduce the predictability of funds and therefore the ability of local governments to plan and budget; this is especially the case when the transfers are determined on an ad hoc basis, as in the case of additional grants described later in this chapter. The Budget Code of Ukraine was significantly changed in December 2014. According to the explanatory notes accompanying the legislative amendments, one of the main objectives was to implement a new model of inter-governmental relations and strengthen the financial basis of local government. Thus, the amendments include a number of provisions to bring public services closer to their users, improve fiscal autonomy of local governments, and strengthen their local governments’ financial independence. Recent amendments to the Budget Code call for earmarked subventions to fund education and health care while revising the formula for equalization grants covering the remaining functions of sub-national governments.98 Among other provisions, the amendments established a legal framework for financing amalgamated sub-national units. However, most of the amendments concerned the revenue side, reducing the share of revenues from the Personal Income Tax, and natural resource royalties previously decreed for sub-national budgets. Inter-Governmental Structure In Ukraine, the right to self-government is articulated in terms of “territorial communities,” which do not have to coincide with the statistical definition of a settlement or administrative division. Local self-governance has been guaranteed beginning with the 1996 Constitution (Article 140) and the subsequent Law on Local Self-Governance in Ukraine adopted in 1997. Even in the case of cities, a unit of local self-government can include a bigger city and several other adjacent settlements. In terms of fiscal analysis, however, Ukraine’s governance features cities from all three tiers of sub-national government with different assignments of revenue sources and expenditure responsibilities. Thus, many subventions from the national budget are allocated only to the sub-oblast cities, which are mandated to fulfill the social entitlements for which these monies are earmarked. Equalization grants from the national budget only extend to the sub-oblast level, while for sub-district cities the equalization grants are allocated by their respective districts. As inter-governmental revenues – constituting the bulk of city revenues – are passed on to the 275 sub-district cities (out of a total of 458 cities reviewed in this study) by their respective districts, the analysis of patterns in city finances has to be placed within the context of Ukraine’s overall system of inter-governmental relations. In addition to the flow of inter-governmental revenues, the administrative status of a city also appears to be related to its demographic characteristics. There appears to be a close relationship between the 2001-13 annual percentage population decline and the administrative type of cities: the highest annual percentage population decline of 1.27% is observed in the bottom-tier cities and a lower rate of 0.47% is observed at the intermediate tier, while top-tier cities 97 Thus revenue autonomy does not require that local governments control (i.e., determine bases and rates for) all their revenue sources. It would be sufficient if they could substantially increase or decrease rates for a few taxes accounting for a meaningful share of their revenues, while the rest continued to come from a predictable and stable sharing of national tax revenues. However, there would be little revenue autonomy achieved if any additional revenue from higher local taxes was almost entirely offset with reduction in grants from the central government. 98 Adopted by the Parliament on December 28, 2014 and January 15, 2015. CHAPTER 2 Cities and the Inter-Governmental Fiscal System 84 Ukraine_2015_nov26.indd 84 2015-11-26 5:14 PM
  • 107.
    experienced a positivegrowth of population over the same time period. In addition to higher rates of population decline, bottom-tier cities are characterized by having the smallest populations among the tiers as of 1989: more than half fell into the category of mid-size towns (10-20,000 residents), with the rest of bottom-tier cities equally split between the small town category (under 10,000 residents) and the large town category (between 20-50,000 residents). Therefore, the excessive territorial fragmentation of sub-national government is not entirely a rural problem, but might also lead to sub-optimal efficiencies in service provision in the bottom-tier cities. Ukraine’s previous system of inter-governmental fiscal relations was shaped by the adoption of the Budget Code in 2001. At that time, the main political impetus for change was the discontent and political pressure exercised by local governments in response to the poor management and alleged abuses by regional governments during the years of transition prior to the reform. Among other provisions, the 2001 Budget Code made distinctions between delegated and own responsibilities and provided different “revenue baskets” from revenue-sharing to ensure that enough funding was present to finance the delegated responsibilities. Nevertheless, the Budget Code allowed sub-national governments to spend any revenues from the delegated basket in any sector they wished as long as higher priority was given to the core (“protected”) economic items. As part of the reforms initiated with the adoption of the 2001 Budget Code, the non-transparent discretionary system of inter-governmental revenues was supposed to be replaced with a formula-driven equalization system. The major changes brought by the Budget Code included re-assignment of expenditure responsibilities among different levels of government; long-term assignment of revenues from national taxes to local budgets; formula-based calculation of equalization transfers; clear and transparent structure for the earmarked transfers; and delineation of conditions and limits on local borrowing. The equalization grant determination was expected to be based on objective, neutral criteria applying a uniform formula across the country to assess the revenue capacity and expenditure needs of sub-national units. That system still employed negative transfers for rich jurisdictions while increasing objectivity in the sub-national budget process and increasing budget predictability for local governments. However, the predictability of the formula-driven system was compromised by a dozen new allocation factors that had been added to the formula over the years. Furthermore, the ad hoc nature of these changes entrenched inefficiencies by basing financing on characteristics of networks of local facilities and their staffing levels, thus implicitly financing the existing network of service facilities and staffing as opposed to funding an objectively-determined demand for services. The recent amendments to the Budget Code attempt to move away from financing existing infrastructure. The new system of grants entirely disregards expenditure needs in the allocation of general-purpose grants, which are now called “basic grants” instead of “equalization grants” in the past. The new general-purpose grants only aim to equalize disparities in the revenues from the national PIT and CIT taxes that are decreed for local budgets on a derivation basis. The recent amendments also encourage voluntary amalgamation of bottom-tier jurisdictions. A mechanism has been developed in the Budget Code amendments for moving amalgamated communities into direct inter-governmental fiscal relations with the national government, and granting them powers equivalent to those of sub-oblast-significant cities. Similar to previous arrangements with national government provided for oblasts, sub-oblast cities and raions, it will establish such direct inter-governmental fiscal relations also for amalgamated communities. The Government of Ukraine declared that such changes represent a starting point for a transition from a three-tier to a two-tier system of local self-government. CHAPTER 2 Cities and the Inter-Governmental Fiscal System 85 Ukraine_2015_nov26.indd 85 2015-11-26 5:14 PM
  • 108.
    Functional Responsibilities In theassignment of functional responsibilities to local governments, a distinction is made between so-called “own functions” versus “delegated or obligatory functions.” Obligatory functions are mandatory for all local government units at the given level (see Table 12 below). “Own functions” include “hard” municipal services, such as local roads and transport infrastructure, municipal transit, solid waste management, housing, and utilities. While the Law on Local Self-Government does not differentiate functional responsibilities among types of cities, the Budget Code delegates responsibilities in an asymmetric way with a larger portion being delegated to the higher-tier cities (see Annex VII). While the average city size of 60,000 residents makes it viable for an average city to provide major social services, including education and health care, almost a quarter of cities have fewer than 10,000 residents, which may be too small to achieve the minimum efficient scale of provision.99 This is somewhat mitigated with the asymmetric delegation of expenditure responsibilities in the Budget Code (see Annex VII). Thus major social services – including education, health care, and social welfare – are mostly delegated to the top- and intermediate-tier cities, while bottom-tier cities are only responsible for pre-school education and cultural/recreational centers. However, even among the intermediate-tier cities there are four that have fewer than 10,000 inhabitants, indicating size alone isn’t determinative of responsibilities. There are legal constraints on local government discretion in closing or rationalization of social infrastructure. Thus, Article 26 of the Local Self-Government Law requires a local referendum to close a pre-school institution. Reportedly, local governments are also bound by physical norms, such as staffing levels and other inputs mandated on the basis of facility characteristics100 . For example, the number of doctors is mandated based on the existing number of beds in health facilities, or non-teaching staff based on the number of square meters of a school. Under current law, these physical norms for decision-making have to be applied to the existing oversized and underutilized network of service facilities, rather than have such decisions based on the actual demand for services. Recent amendments to the Budget Code assigned some additional expenditure responsibilities to sub-national governments. Expenditures for certain activities in social and cultural sectors were shifted to the oblast and local levels. Previously such responsibilities (and related facilities) were all funded from the State budget. Furthermore, now sub- national governments have to finance construction and maintenance of roads from the local budget; prior to 2015, they drew from the national Road Fund. 99 A large number of empirical studies that have sought findings regarding economies of scale for local government services show that most economies of scale are exhausted for local governments with populations over 10,000 residents. Economies of scale means the average cost decreases as the volume of service provision increases; for example, per-student costs of education are lower in municipalities with more students. 100 Id. World Bank. 2008. CHAPTER 2 Cities and the Inter-Governmental Fiscal System 86 Ukraine_2015_nov26.indd 86 2015-11-26 5:14 PM
  • 109.
    Function Own ResponsibilitiesDelegated Responsibilities General public services Self-administration powers; municipal archives None Defense, public order and safety Civic defense; municipal police Residence registration; emergency response; permits for demonstrations and recreational events; administrative courts; civil registration Economic affairs Land use management; urban planning; construction and maintenance of local public roads; transit fares, routes and schedules; public parking; markets and fairs; licensing of outdoor advertising Price control; consumer protection; investment promotion; identification of non-residential properties; enforcement of building and land codes; land titles Environmental protection Licensing the use of natural resources of local significance; preservation; solid waste management; local programs of environmental protection Re-forestation; enforcement of waste management laws Housing and communal services Utility rates; public housing; water supply and sewage systems; residential fuel supply; upkeep of public spaces and landscaping; upkeep of cemeteries Free housing for entitled individuals Health Maintenance of municipal institutions Subsidized medicine and supplies Recreation, culture, and religion Maintenance of municipal institutions Preservation of cultural and historical heritage Education Provision of general education; school transport; maintenance of municipal institutions Free textbooks Social welfare Targeted assistance for disabled; municipal welfare programs; housing assistance for disabled, veterans and other entitled individuals; burial of indigent persons Child protection; municipal and regional programs of labor protection and employment; long-term care CHAPTER 2 Cities and the Inter-Governmental Fiscal System Table 12 – Functional responsibilities Source: Law of Ukraine on local self-government (no. 280/97-vr, articles 25-41) 87 Ukraine_2015_nov26.indd 87 2015-11-26 5:14 PM
  • 110.
    II. Revenue Sources Localgovernment revenue sources fall into three main categories: (i) Own-source revenues (including property taxes and other local taxes, charges and fees); (ii) Shared revenues (e.g., PIT, excises, environmental tax, land fees, license fees, royalties for common natural resources)101 ; and (iii) Vertical transfers from higher-level governments (from the central, oblast and raion governments to cities). Similar to consolidated sub-national revenues, over 80 percent of city revenues come from retained shares of national taxes and other transfers (Figure 63). On average, less than 10 percent of total city revenues come from own sources, such as local taxes and non-tax charges. As can be expected from the asymmetrical allocation of revenues sources, there are clear differences in the composition of revenues among cities at different tiers of government (Figure 63). In 2013, cities at higher tiers of government were less dependent on explicit grants while relying more on non-tax revenues and locally retained shares of national taxes. This is likely to be a reflection of the arrangements for derivation-based sharing of revenues from national taxes, which had a larger share of tax collections (e.g., PIT) allocated to the budgets of higher-tier governments. Since, until 2015, equalization grants were filling the gap between projected revenues and expenditures of cities, higher revenues from shared taxes in higher-tier cities were associated with smaller allocations of equalization grants. One has to note that in per capita terms bottom-tier cities received almost four times more in explicit grants than the intermediate-tier cities while having more than half of the amount of revenues from other sources. As will be later corroborated in the analyses of expenditures, this is likely to be related to the sub-optimal scale of service provision at the bottom tier. For the most part, there were no major differences in revenue composition observed among the night light categories of cities102 (Figure 64). This not surprising as each night light category includes cities from both bottom and intermediate tiers of government (the two top-tier cities belong to sub-type A: Growing light intensity in expanding periphery). 101 Under derivation-based sharing, national government taxes are collected by the national tax authorities and then partially (or in some cases, fully) allocated to the budget of the local government in whose territory collection takes place. As it is a form of inter-governmental transfer, derivation-based sharing of revenues from national taxes is discussed in the corresponding section below. 102 The night light categories used for this Chapter are the six categories presented in the Annex VI. Extensive growth. CHAPTER 2 Cities and the Inter-Governmental Fiscal System Figure 63 – Type of city revenues and % of total provided by different tiers of government, 2013 88 Special funds 100% 90% 80% 70% 60% 50% 40% 30% 20% 10% 0% Top Intermediate Bottom UAHpercapita Non tax revenues %oftotalrevenues 100% 90% 80% 70% 60% 50% 40% 30% 20% 10% 0% Top Intermediate Bottom Transfers Shared Taxes OtherTaxes Taxes on natural resources Local taxes and duties Taxes on personal property 573 2,334 8,100 Ukraine_2015_nov26.indd 88 2015-11-26 5:14 PM
  • 111.
    17 However, bottom-tier citiesare more likely to be among the Missed Disappear and Appear categories and thus have no type assigned in the second night light typology. This explains a higher dependency on explicit grants for cities with no type, given that such transfer dependency was common for bottom-tier cities. For the same reason, in the sub-type F (thriving core, shrinking footprint), explicit grants accounted for a smaller share of revenues than shared tax revenues as both cities comprising this sub-type belong to the intermediate tier, and were thus less dependent on transfers103 . However, this pattern cannot explain the lower transfer dependence in sub-type D cities (growing light intensity in shrinking footprint), even though it has the highest proportion of the bottom-tier cities (70 percent). The low amount of transfer dependency in sub-type D is due to one of the lowest per capita allocations of explicit grants, rather than higher revenues raised locally. Note that sub-types B (Declining in all aspects) and E (Growing light intensity in an expanding periphery) received among the highest amounts of grants per capita despite also having average levels of locally-derived revenues. As we will see later, this translated into the highest per capita expenditures on social services among categories of cities. 103 As type 4, coinciding with sub-type F, is comprised of just two major cities (Donetsk and Zaporizhia), we do not attempt to find any generalized patterns for this type/sub-type of cities. As with the administrative tiers of cities, the patterns in revenue composition show a similar relationship to city population size (Figure 65 below). Larger cities tend to depend less on explicit grants while relying more on non-tax revenues and locally-retained shares of national taxes. Again this appears to be driven more by differences in per capita amounts of explicit grants rather than per capita yield of locally-derived revenues (own-source and shared at source). In per capita terms, small towns received over ten times more in explicit grants than major cities, while the difference in locally-derived revenues was less than two-fold. CHAPTER 2 Cities and the Inter-Governmental Fiscal System Figure 64 – Composition of city revenues by night light type as % of total, 2013 Notes: : These figures only include transfers received by the city proper, but not its subdivisions. A: Growing light intensity in expanding periphery; B: Declining in all aspects; C: Dimming periphery; D: Growing light intensity in shrinking footprint; E: Declining economic activities in the core, growing area with stronger peripheries; F: Thriving core, shrinking footprint. 89 A B C D E F Notype 100% 90% 80% 70% 60% 50% 40% 30% 20% 10% 0% Special funds UAHpercapita Non tax revenues 9,000 8,000 7,000 6,000 5,000 4,000 3,000 2,000 1,000 0 Transfers Shared Taxes OtherTaxes Taxes on natural resources Local taxes and duties Taxes on personal property A B C D E F Notype 4,1361,176 5,4571,166 4,5041,092 2,7601,027 5,7531,249 8521,738 7,194978 Ukraine_2015_nov26.indd 89 2015-11-26 5:14 PM
  • 112.
    Furthermore, the relationshipbetween transfer dependence and population size does not seem to stem from population decline (Figure 66 below). While the per capita yield of locally-derived revenues was inversely related to population decline, this dynamic did not hold for the per capita amount of grants. The amount of grants decreased with population decline up to the national average rate, possibly reflecting the use of a smaller client population size in the determination of expenditure needs in the equalization grant formula. However, for cities with population declining at a rate above the national average, more resources were allocated in grants per capita than for cities with population declining more than the urban average but less than the national average. The greater allocation of grants per capita to cities with population declining more than the national average might have been due to adjustments for under-utilized social infrastructure in the calculation of expenditures needs. CHAPTER 2 Cities and the Inter-Governmental Fiscal System Figure 65 – Composition of city revenues by population size as % of total, 2013 Figure 66 – Composition of city revenues as % of total relative to population decline, 2013 90 Transfers Shared Taxes OtherTaxes Taxes on natural resources Local taxes and duties Special funds Taxes on personal property Non tax revenues 14,000 12,000 10,000 8,000 6,000 4,000 2,000 0 UAHpercapita Special funds Non-tax revenues Local taxes and duties Taxes on personal property Taxes on natural resources Othertaxes Shared taxes Transfers Smalltowns MidsizetownsLargetownsSmallcities MidsizecitiesMajorcities 70% 60% 50% 40% 30% 20% 10% 0% %oftotalrevenues 100% 90% 80% 70% 60% 50% 40% 30% 20% 10% 0% 9,000 8,000 7,000 6,000 5,000 4,000 3,000 2,000 1,000 0 PositivegrowthDecliningbutlessthan urbanaverage Decliningbutlessthan nationalaverageDecliningm orethan nationalaverage %oftotalrevenues UHApercapita Special funds Non tax revenuesTransfers Shared Taxes OtherTaxes Taxes on natural resources Local taxes and duties Taxes on personal property Smalltowns MidsizetownsLargetownsSmallcities MidsizecitiesMajorcities PositivegrowthDecliningbutlessthan urbanaverage Decliningbutlessthan nationalaverage Decliningm orethan nationalaverage 11,246 7,341 3,826 2,619 5,794 863 6,683 5,796 4,647 5,544 Ukraine_2015_nov26.indd 90 2015-11-26 5:14 PM
  • 113.
    Own Sources ofRevenues Until 2015, the Tax Code authorized just five revenue instruments for own sources of local government revenues (Table 13). Recent amendments abolished one of the five revenue instruments (the fee for the certain business activities), while extending the coverage of the local property tax to include land and movable property. For the items on the list of authorized local revenue instruments, local authorities have some discretion in setting the rates subject to nation-wide ceilings or floors. However, the tax base is defined in national legislation and the actual administration of these revenue instruments is carried out by the national revenue authority. Further, with respect to the portion of the revenues from the national land tax that is shared with local budgets, sub-national governments can offer tax exemptions and other kinds of preferential tax treatment and hardship relief. With respect to non-agricultural land plots with no appraised value, local councils are to set land tax rates in UAH per square meter differentiated by location with a ceiling of three times the base rate prescribed for the respective locality in the Tax Code. Tax name Who can introduce Who defines the base Who sets the rate Tax on real estate other than land Mandated by national legislation National legislation (total area of a residential property) For each type of property and ownership, national legislation sets the rate ceiling in % of the minimum wage per 1 sq. meter of tax base while local councils can adopt a reduced rate for apartments under 240 sq. m. and houses under 500 sq. m. Single tax Mandated by national legislation National legislation (duration of business activity in months or in business income) For businesses with fewer than 10 employees and less than 1mln UAH in income, local councils set the rate within the range set by national legislation (10-20% of minimum wage per month); for larger businesses, rates are set by national legislation as % of business income Fee for certain business activities Mandated by national legislation National legislation (days of business activity) Local councils within the range set by national legislation for each type of activity (% of minimum wage per day) Fee for parking of vehicles Local councils National legislation (area of public parking spots) Local councils within the range set by national legislation (0.03 to 0.15% of minimum wage per 1 sq. meter per day) Tourist tax Local councils National legislation (value of accommodation services rendered) Local councils within the range set by national legislation (0.5 to 1%) CHAPTER 2 Cities and the Inter-Governmental Fiscal System Table 13 – Own sources of local government revenues Source: Tax Code Note: To index for inflation, tax rates are set not in nominal amounts, but as a fraction of the minimum wage, which is periodically adjusted by the national government. 91 Ukraine_2015_nov26.indd 91 2015-11-26 5:14 PM
  • 114.
    104 These relativecontributions of businesses vis-a-vis residents in the total revenues from local taxes might look different in 2015, after property taxes on land and vehicles have been moved from the list of national taxes to the list of local taxes. When the vehicle tax was still a national tax in 2013, ninety percent of its revenues came from individual car owners while the rest came from corporate entities. Similarly, two thirds of the land tax revenues came from individual owners and only one third came from corporate entities. 105 The more nuanced approach to the typology reveals that high per capita amount of revenues from the Tourist Tax found for type 2 is actually driven by sub-type B (declining in all aspects). Until 2015, business taxes were the most utilized of all own revenue instruments available to local governments in Ukraine.104 By far the largest per capita yield was recorded for the Single Tax, which is paid by small business in lieu of the income tax and other national taxes. The next most utilized own source of local revenues were fees for certain business activities (essentially a business license with an element of imputed income taxation). The least utilized revenue instrument was the property tax on structures, on average generating only 28 kopiyok (cents) per person. For any category of cities, the Single Tax accounted for more than 80 percent of own tax revenues. Revenue source % of own tax revenues Average Minimum Maximum Coef. of variation Tax on real estate, other than land 0.3% 0.28 0.00 9.59 2.78 Single Tax 90.9% 97.57 0.00 420.52 1.04 Fee for certain business activities 7.2% 9.12 0.00 82.63 1.35 Fee for parking of vehicles 1.1% 0.78 0.00 11.96 2.89 Tourist Tax 0.6% 1.05 0.00 61.85 5.90 CHAPTER 2 Cities and the Inter-Governmental Fiscal System Table 14 – Utilization of local revenue instruments by cities as % of UAH per capita, 2013 Figure 67 – Utilization of local revenue instruments by cities, UAH per capita, 2013 There is a strong relationship between the night light topology and the utilization of own sources of revenues. Cities that are thriving in all respects (type 1 or sub-type A) generated at least 50 percent more revenue than the average per capita revenue from each own revenue instrument except for the Tourist Tax105 (Figure 67). This is particularly true for parking fees. Similarly, the Found and Appear night light typologies have higher per capita revenues from own taxes than Missed and Disappear cities. A possible explanation might be the creation of small businesses – part of the positive relationship between night lights and economic activity previously discussed in Section 4. 92 Type 1 Type 2 Type 3 Type 4 No type 150 100 50 0 Single tax Business patents UAHpercapita UAHpercapita Real estate tax Parking fees Tourist tax 0 0.5 1 1.5 2 Ukraine_2015_nov26.indd 92 2015-11-26 5:14 PM
  • 115.
    CHAPTER 2 Citiesand the Inter-Governmental Fiscal System There is also a noticeable association between population decline and the yield of local taxes (Figure 68). Cities with higher population decline appear to raise less revenue per capita from own taxes relative to the yield of national taxes shared with local governments. Figure 68 – Utilization of local revenue instruments by city night light typology, UAH per capita, 2013 There is only a weak association between population size and per capita revenues from own taxes, but which does not hold at all for the Tourist Tax (Figure 69). Major cities have particularly high per capita revenues from parking fees and the Single Tax. Figure 69 – Utilization of local revenue instruments by city population size, in UAH per capita, 2013 Before the revamping of the list of local tax handles with the introduction of the 2011 Tax Code, per capita revenue had been steadily declining capita terms (Figure 70). This might be explained in part by the economic crisis. The decline in per capita revenues had been larger in cities with declining population. Abolishment of a plethora of unproductive local taxes with the 2011 Tax Code coincided with a dramatic increase in per capita revenues. Cities that had experienced a larger revenue loss before 2011 also saw larger revenue increase in the years after. Throughout this up-and-down cycle, there is a noticeable association between the rate of population decline and the levels of local tax collection (Figure 71). 93 Single tax Business patents 200 100 0 UAHpercapita Declining but less than urban averagePositive growth Declining but less than national average 4 2 0 UAHpercapita Real estate tax Parking fees Tourist tax UAHpercapita 250 200 100 50 0 150 Small towns Small cities Mid size cities Major citiesMid size towns Large towns Single tax Business patents UAHpercapita Real estate tax Parking fees Tourist tax 0 1 2 3 4 Ukraine_2015_nov26.indd 93 2015-11-26 5:14 PM
  • 116.
    CHAPTER 2 Citiesand the Inter-Governmental Fiscal System Figure 70 – Per capita revenue from own taxes and the night light typology of sub-oblast cities, in UAH, 2013 Figure 71 – Per capita revenue from own taxes and population decline of sub-oblast cities, in UAH, 2013 Note: Due to lack of data, bottom tier cities are not included. A: Growing light intensity in expanding periphery; B: Declining in all aspects; C: Dimming periphery; D: Growing light intensity in shrinking footprint; E: Declining economic activities in the core, growing area with stronger peripheries; F: Thriving core, shrinking footprint. Note: Due to lack of data, bottom tier cities are not included. 94 2006 2007 2008 2009 2010 2011 2012 2013 A B C D E F No type 250 100 150 200 50 0 UAHpercapita Positive growth Declining but less than urban average Declining but less than national average Declining more than national average UAHpercapita 250 100 150 200 50 0 2006 2007 2008 2009 2010 2011 2012 2013 Ukraine_2015_nov26.indd 94 2015-11-26 5:14 PM
  • 117.
    CHAPTER 2 Citiesand the Inter-Governmental Fiscal System Shared Tax Revenue and Other Transfers Local governments are assigned a share of revenues from national taxes (e.g., PIT) on a derivation basis. That is, these revenues are (partially) shared with the locality where they are collected. In addition to the PIT revenues, until 2015 top-tier local governments also received 50% of the revenue from royalties on forests, water, and mineral resources of national significance (except oil and gas), and 100% revenue from other common natural resources (including land) and excise taxes. The 2015 amendments to the Budget Code changed sharing rates for many of these taxes. In addition, the national property taxes on land and vehicles, the revenues from which had been previously allocated to local budgets, now have become entirely local taxes. Under this derivation-based sharing, national government taxes are collected by the national tax authorities. Then they are partially (or fully in the case of the land tax) allocated to the budget of the local government in whose territory collection takes place. This revenue-sharing occurs based on uniform sharing rates (so that all lower-level government jurisdictions receive the same share of revenues collected within their jurisdiction as in the case of excise tax revenues) or based on a differentiated sharing rate structure in which different jurisdictions receive a different percentage of the shared revenue source, as in the case of PIT. Until the recent amendments to the Budget Code, the rates of derivation-based sharing of revenue from the national PIT were as following106 : Up to year 2014, the City of Kyiv received 50% of the PIT revenue collected in its territory (40% stating in 2015), (i) Up to year 2014, The City of Sevastopol received 100% of the PIT revenue collected in its territory, (ii) 75% of the PIT revenue was allocated to the budget of the districts and sub-oblast cities where collection takes place (60% starting in 2015), (iii) 25% of the PIT revenue was allocated to the budget of the bottom-tier jurisdiction where collection takes place (ending in 2015). The derivation-based sharing of revenues from national taxes is complemented by explicit grants from the national government to oblasts and districts and from there passed on to constituent cities and rural municipalities. As can be seen from Figure 61 above, grants from the central budget to sub-national levels have been steadily increasing from a 5.95 percent share of GDP in 2007 to 8.53 percent in 2012 and then slightly reversing to 7.70 percent of GDP in 2013. This non-transparent discretionary process was replaced with a formula-driven equalization system for local government finances as part of substantial reforms initiated with the adoption of the Budget Code in 2001. The major changes brought by the Budget Code included reassignment of expenditure responsibilities among different levels of government; long- term assignment of shares from national tax revenues to local governments at the point of collection; formula-based calculation of the equalization grants; clear and transparent structure of the earmarked transfers; and the articulation of the conditions and limits on local borrowing. As a result, the formulation of local government budgets started being based on more objective, neutral criteria using a uniform formula across the country to compute revenue capacity and expenditure needs. The legal basis for the present system of inter-governmental transfers is provided by the Budget Code (Article 96). Before changes in 2015, the 2001 Budget Code envisioned four types of transfers: equalization grants, (i) subventions, (ii) additional grants, (iii) other funds transferred to the state budget and local budgets from other local budgets (mutual settlements). 106 The sharing rates are mostly an outcome of political bargaining. Thus, the recent reduction of Kyiv City’s share in the PIT revenues from 50 to 40 percent was initially proposed as 20 percent. 95 Ukraine_2015_nov26.indd 95 2015-11-26 5:14 PM
  • 118.
    CHAPTER 2 Citiesand the Inter-Governmental Fiscal System Equalization grants aim to cover the gap between assessed expenditure needs and “potential” revenue from own and shared taxes. Until the recent amendments to the 2001 Budget Code, the total pool of equalization transfer funds had been comprised of negative transfers from rich jurisdictions and topped up with annual appropriations from the national budget. Thus, the overall size of the available pool of funds had been arbitrary and non-fixed. Currently, some of these central government grants are passed by districts to sub-district municipalities. The additional equalization transfers are allocated among regions based on specific features of depressed and mountainous areas, and areas with low population levels and the network of public institutions. Thus, no less than three-quarters of additional equalization grants has to be passed on by oblasts to the sub-oblast units. Subventions are used to transfer funds to be used by the recipient government for the purpose – and in the manner – specified by the grantor. They are mostly used to fund social entitlements delegated to sub-national authorities for fulfillment. Subventions can also be used to fund other earmarked uses such as public investment projects. Additional grants are unplanned transfers allocated in the course of the fiscal year. They can be used to compensate local governments for revenue losses resulting from changes to national government policies, such as tax preferences. They are also used as a mechanism to share with local governments any over-collection of revenues from national taxes. Other funds (mutual settlements) can be transferred between different governments in exchange for mutually-agreed public services provided by the recipient of the transfer. For example, one local government can provide services to the residents of other local governments. In 2013, less than half of overall transfers came through equalization grants, which offered local governments both predictability and discretion in allocating these resources according to local priorities (Figure 72). The rest came through subventions, which were earmarked for specific uses, mostly to fulfill social entitlements. Figure 72 – Composition of inter-governmental transfers to cities by type, 2013 Note: A: Growing light intensity in expanding periphery; B: Declining in all aspects; C: Dimming periphery; D: Growing light intensity in shrinking footprint; E: Declining economic activities in the core, growing area with stronger peripheries; F: Thriving core, shrinking footprint. Additional grants Mutual settlements Subventions Equalization grants 100% 90% 80% 70% 60% 50% 40% 30% 20% 10% 0% No type A B C D E F 96 Ukraine_2015_nov26.indd 96 2015-11-26 5:14 PM
  • 119.
    CHAPTER 2 Citiesand the Inter-Governmental Fiscal System In terms of the composition of inter-governmental revenues, there are no major differences observed among the night light types of cities (other than a higher share of subventions in total transfers received by sub-types D and E). The high transfer-dependency previously found for the no-type cities appears to be due to larger allocations of equalization grants. Similarly, small allocations of equalization grants appear to be behind the lower transfer-dependency exhibited by sub- types F and D. Cities with larger population declines were associated with a smaller share of subventions, but a larger share of additional equalization grants. This is not surprising given that the 2001 Budget Code required oblast governments to take into account “specific features of depressed and mountainous areas, and areas with low population levels and a widespread network of government-funded institutions” (Article 97). As the additional grants were more discretionary and ad hoc, this suggests softer budget constraints for cities with larger population decline. Thus, larger allocations of grants per capita to cities with population declining more than the national average were more likely to be related to under-utilized social infrastructure than to a greater presence of a population entitled to social benefits – which would be funded with subventions from the central government. Figure 73 – Composition of inter-governmental transfers to cities by population trend, 2013 97 Additional grants Mutual settlements Subventions Equalization grants 100% 90% 80% 70% 60% 50% 40% 30% 20% 10% 0% Positivegrowth Decliningbutless thanurbanaverage Decliningbutless thannationalaverage Decliningmorethan nationalaverage Ukraine_2015_nov26.indd 97 2015-11-26 5:14 PM
  • 120.
    CHAPTER 2 Citiesand the Inter-Governmental Fiscal System Figure 74 – Composition of inter-governmental transfers to cities by population size, 2013 Conceptually, the amount of equalization grants from the national budget to local government budgets (which in reality were originally derived from local government contributions to the equalization pool) was calculated as the difference between estimated expenditure need of the given local government and the forecasted (by a uniform formula) amount of revenues to be collected in the respective territory. The expenditure need for each local government was equal to the product of three items: a) the basic expenditure norm (per capita, or per student, etc.); b) the population or the number of students, etc. in the locality; and c) a set of coefficients that worked to adjust the expenditure need up or down for special needs and/ or differential costs of service provision. Among other things, the adjustment coefficients were based on the target ratio of the number of employees of local self-government bodies in relation to the population level (Budget Code, Article 98). The dozens of new adjustment factors that had been added to the formula over the years are believed to have undermined the formula’s predictability while also entrenching inefficiencies. This is because the subsequent adjustments tie financing to facility network characteristics and staffing levels; thus, they implicitly finance the existing network of service facilities and staffing as opposed to funding an objective demand for services107 . 107 Id. World Bank. 2008 Larger cities received a larger share of inter-governmental grants in the form of subventions and additional grants while their share of equalization grants was smaller (Figure 74). This reduced allocation of equalization grants to major cities might reflect both higher yield of locally-derived revenues and smaller estimates of expenditure needs due to better utilized infrastructure. At the same time, larger per capita allocations of additional grants to bigger cities might reflect their better bargaining power before the central government. 98 Additional grants Mutual settlements Subventions Equalization grants 100% 90% 80% 70% 60% 50% 40% 30% 20% 10% 0% Small towns Mid size towns Large towns Small cities Mid size cities Major cities Ukraine_2015_nov26.indd 98 2015-11-26 5:14 PM
  • 121.
    In addition toallocating equalization grants for oblast and sub-oblast units, the national government also set minimum per capita (per client) norms to be used by district governments in allocating equalization grants among constituent units. The allocation of intra-district equalization transfers had to be approved by the respective oblast government; if the district budget was not adopted on time, the allocation of intra-district equalization grants was to be decided by the oblast government. In 2015, the system of equalization grants was substantially revamped. According to the explanatory note accompanying amendments to the Budget Code, the new equalization grants (now called “basic grant”) will be of a compensatory nature and aim at bridging disparities in revenue capacity of local governments related to derivation-based sharing of the personal income tax and corporate income tax. A new equalization system will be based on the per capita level of revenues. By contrast, the previous system was based on the gap between per capita expenditure needs and revenue projections. Now, if the local yield of the shared tax exceeds the national average by 10 percent or more, half of this surplus revenue is withdrawn into the State budget (a negative grant). In the opposite case of a below-average yield of the shared tax, the State will only compensate 80% of the shortfall. Local revenues from other sources are not subject to equalization and shall remain at the complete disposal of local budgets. Since education and healthcare expenditure needs are no longer covered by the equalization grants, a new system of earmarked subventions will be implemented, also based on a formula approach (to be established by the Cabinet of Ministers of Ukraine) At the same time, the amendments to the Budget Code mandate that the purpose of the funds from these new subventions will be for long-term programs and projects. In addition, funds remaining at the end of the fiscal year will no longer be withdrawn into the State budget, but can be used for renewal of the material and technological base of relevant institutions. This dramatic departure from the previous system is expected by the Government, among other goals, to help improve the efficiency of using budgeted funds since local governments will no longer try to expend subvention resources “at any price” at the end of the year without regard for whether an expenditure is an efficient one. CHAPTER 2 Cities and the Inter-Governmental Fiscal System 99 Ukraine_2015_nov26.indd 99 2015-11-26 5:14 PM
  • 122.
    III. Analysis ofExpenditures While cities account for over 60 percent of total national population, in 2013 they accounted for 57 percent of sub- national expenditures on education and 46 percent of sub-national expenditures on health care, but 77 percent of sub-national expenditures on housing and utilities. This suggests that in per capita terms, cities spend on health care less than two-thirds of the amount spent on these services provided to the population outside of cities. Similar to the consolidated sub-national expenditures shown in Figure 61, in 2013 the three social sectors (education, health care, and social welfare) accounted for over 80 percent of city expenditures (Figure 75 below). In terms of functional composition of city expenditures, there are no major differences among night light types. The only exception is sub-type F (thriving core, shrinking footprint), where a smaller share is allocated to the three social services while a larger share is allocated to Housing and Utilities and other non-social services, in particular Economic Affairs. However, there are wide disparities across city sub-types in per capita levels of expenditures on each function. The highest per capita expenditures are observed in sub-types B (Declining in all aspects) and E (Growing light intensity in expanding periphery). These high per capita expenditures in sub-types B and E are driven by the three social services, in particular social protection. The lowest per capita expenditures are observed in sub-types D (growing light intensity in shrinking footprint) and F (Thriving core, shrinking footprint). As indicated above, the greatest amount of inter-governmental grants were allocated to sub-types B and E, while the least amount was allocated to sub-types D and F. Thus, the disparities among city categories appear, if not directly caused, then accommodated with the allocation of inter-governmental grants. One possible explanation is the use of the public sector as an employer of last resort in declining cities. At the same time, it appears that a shrinking footprint in the presence of some economic growth is associated with smaller amounts of per capita expenditures and grants. CHAPTER 2 Cities and the Inter-Governmental Fiscal System Figure 75 – Functional composition of city expenditures by sub-type, 2013 Note: A: Growing light intensity in expanding periphery; B: Declining in all aspects; C: Dimming periphery; D: Growing light intensity in shrinking footprint; E: Declining economic activities in the core, growing area with stronger peripheries; F: Thriving core, shrinking footprint. 100 Other Health CareSocial Welfare EducationHousing and Utilities UAHpercapita 10,000 8,000 4,000 2,000 0 6,000 A B C D E F Notype %oftotal 100% 80% 40% 20% 0% 60% A B C D E F Notype Ukraine_2015_nov26.indd 100 2015-11-26 5:14 PM
  • 123.
    17 At least forthe intermediate-tier cities, there is a divergence in per capita expenditures on social sectors among night light categories of cities until 2012 (Figure 76). However, the overall reduction of sub-national expenditures in 2013 had a greater impact on the expenditures of sub-type B cities and cities without any type. These are the cities showing highest per capita expenditures in 2009-2012. At the same time sub-types D and F, having the lowest per capita expenditures, actually saw an increase in expenditures on education and social welfare in 2013. Thus, 2013 might represent the first year of rationalizing under-utilized social infrastructure in small cities. 108 Empirical studies from other countries suggest that economies of scale in the delivery of municipal services are mostly exhausted at an average size of 10,000 inhabitants, even though there are some special services, such as urban transportation and solid waste utilization, where economies of scale improve up to the size of 100,000 inhabitants (Lago-Peña and Martinez-Vazquez, 2013) Furthermore, there are 47 outlier cities (or 10 percent of all cities) with levels of per capita current expenditures more than four times the median level. These outliers represent 468,000 people (1.7%) out of the 27.5 million total city population of the country, but account for 10% of the total expenditures of cities. These extremely high levels of per capita expenditures in outlier cities appear to be primarily driven by the small scale of service provision since their average population is six times smaller than the average city.108 All but three outliers fall into the categories of small and mid-size towns. In fact, in all types of cities we observe an inverse relationship between population size and per capita expenditure in all sectors except Housing and Utilities and other non-social sectors (Figure 77). In social sectors, larger cities can enjoy lower unit costs as their large population size allows them to take advantage of economies of scale. These economies of scale are particularly visible in the Education and Social Welfare sectors. But large cities also need to spend more on urban infrastructure to deal with urban congestion. For larger cities, higher per capita expenditures on non-social sectors might reflect either higher costs for the same level of services or more extensive and/or better quality of services. Indeed, larger municipalities are able to provide a larger scope of services (and often better quality of services) than very small municipalities; thus, their per capita expenditures capture both lower costs and better services. CHAPTER 2 Cities and the Inter-Governmental Fiscal System Figure 76: Per capita expenditures on social sectors by night light category in sub-oblast cities, in UAH, 2013 101 1,700 1,500 1,300 1,100 900 700 2009 2010 2011 2012 2013 Education 2009 2010 2011 2012 2013 Social Welfare 1,500 1,300 1,100 900 700 500 A B C D E F No type Ukraine_2015_nov26.indd 101 2015-11-26 5:14 PM
  • 124.
    Possibly due totheir small size, the outlier cities disproportionally fall into the Appear and Missed types. As a result, half of the outliers are unclassified in the night light topology. Of those that are classified, over two-thirds are sub-type B (Declining in all aspects), which is greater than the proportion for all cities. Earlier we saw that cities in sub-type B and those without any type receive the highest per capita amount of inter-governmental grants. Furthermore, the sub-optimal scale of service provision in the 47 outlier cities does not seem to have been caused by population decline. In fact, only one-third of outliers have population declining more than the urban average and a quarter of them actually experienced population growth. There appears to be a clear U-shape relationship between population decline and per capita expenditures in all sectors except Housing and Utilities (Figure 78). Higher rates of population decline are associated with lower per capita expenditures in those sectors – except for cities declining more than the national average, where per capita expenditures are almost as high as in growing cities. This might be due to an interplay between availability of resources and economies of scale. Cities with population decline less than the national average might exhibit lower per capita expenditures dues to lower resource availability. However, with higher rates of population decline, the lack of economies of scale outweighs low resource availability, which cities offset by obtaining larger inter- governmental transfers. This U-shape relationship persisted throughout 2009-2013 (Figure 79). CHAPTER 2 Cities and the Inter-Governmental Fiscal System Figure 78 –Per capita expenditures by function and population trend, 2013 Figure 77 – Average per capita expenditures by function and city population size, 2013 102 Sm alltowns Largetowns Sm allcities Midsizecities Majorcities Midsizetowns Education Healthcare Social welfare Housing and Utilities Other 5,000 4,000 3,000 2,000 1,000 0 UAHpercapita Education Healthcare Social welfare Housing and Utilities Other 3,500 UHApercapita 3,000 2,500 2,000 1,500 1,000 500 0 Positivegrowth Decliningbutlessthan urbanaverage Decliningbutlessthan nationalaverage Decliningm orethan nationalaverage Ukraine_2015_nov26.indd 102 2015-11-26 5:14 PM
  • 125.
    In terms ofthe economic composition of city expenditures, again there are no major differences among nightlight types. The exception is a higher share of expenditures on current transfers and capital expenditures in sub-type F (see Figure 80). One has to note the small share of city budgets allocated to capital expenditures, ranging from just 2.6 percent of total expenditures in sub-type C cities to 10.9 percent in sub-type F cities. At the same time, the combined share of payroll and social security expenses exceeds three quarters in all city types except sub-type F. CHAPTER 2 Cities and the Inter-Governmental Fiscal System Figure 79 – Per capita expenditures on social sectors by population decline in sub-oblast cities, in UAH, 2013 Figure 80 – Economic composition of city expenditures by city typology, 2013 Note: A: Growing light intensity in expanding periphery; B: Declining in all aspects; C: Dimming periphery; D: Growing light intensity in shrinking footprint; E: Declining economic activities in the core, growing area with stronger peripheries; F: Thriving core, shrinking footprint. 103 Education 2,100 1,900 1,700 1,500 1,300 1,100 900 700 2009 2010 2011 2012 2013 Social Welfare 1700 1500 1300 1100 900 700 500 2009 2010 2011 2012 2013 100% 90% 80% 70% 60% 50% 40% 30% 20% 10% 0% Capital transfers Capital assets Other current outlays Social security Current transfers A B C D E F No type Positive growth Declining but less than urban average Declining but less than national average Declining more than national average Ukraine_2015_nov26.indd 103 2015-11-26 5:14 PM
  • 126.
    CHAPTER 2 Citiesand the Inter-Governmental Fiscal System Figure 81 – Economic composition of city expenditures by city population size, 2013 There is a clear relationship between the economic composition of city expenditures and a city’s population size (Figure 81). Larger cities allocated a smaller share of their expenditures to social security and labor, while allocating a larger share to goods and services and capital investments (as well as larger current transfers, mostly likely related to municipal enterprises). The higher payroll share in small towns might reflect fixed costs of labor-intensive social services like education. However, lower expenditures on supplies and capital inputs are likely to lower productivity of these same staff. Indeed, the economies of scale are primarily driven by outlays on payroll and social security (Figure 82). Not only that these two economic categories represent the bulk of city expenditures, in per capita terms they are significantly higher proportion of expenditures by smaller cities. There appears to be a clear U-shape relationship between population decline and per capita expenditures on Labor and Social security (Figure 83). Higher population decline is associated with lower per capita expenditures – except for cities declining more than the national average, where per capita expenditures are almost as high as in growing cities. As conjectured earlier, this might be due to an interplay between resource availability and economies of scale. While growing cities might have resources for a larger and better-paid labor force, the fixed cost of staff might make per capita outlays increase substantially when the denominator (population) drops significantly. 104 100% 90% 80% 70% 60% 50% 40% 30% 20% 10% 0% Sm alltowns Largetowns Sm allcities Midsizecities Majorcities Midsizetowns Capital transfers Capital assets Other current outlays Social security Current transfers Interests Ukraine_2015_nov26.indd 104 2015-11-26 5:14 PM
  • 127.
    CHAPTER 2 Citiesand the Inter-Governmental Fiscal System Figure 82 – Economies of scale by economic item, 2013 Figure 83 – Economic composition of city expenditures by population trend, 2013 105 Goods and services Interest Current transfers Social security Other current outlays Capital assets Capital transfers Labor UHApercapita Smalltowns Midsizetowns Largetowns Smallcities Midsizecities Majorcities 7,000 6,000 5,000 4,000 3,000 2,000 1,000 0 Goods and services Interest Current transfers Social security Other current outlays Capital assets Capital transfers Labor UHApercapita Positive growth Declining but less than urban average Declining but less than national average Declining more than national average 4,000 3,500 3,000 2,500 2,000 1,500 1,000 500 0 Ukraine_2015_nov26.indd 105 2015-11-26 5:14 PM
  • 128.
    In 2013, Ukraine’ssub-national capital investment was quite low at 0.95 percent of GDP. However, this reflected an overall low level of public investments in the country; the sub-national share of total public sector investment (48%) is roughly proportional to the sub-national share in the overall sub-national expenditures (44%). However, sub-national governments typically have a larger share of capital expenditures than recurrent expenditures because municipal services tend to be more capital-intensive than national functions, which are dominated by social services and income redistribution programs109 . In Ukraine, on average, capital expenditures accounted for about three percent of total city expenditures in 2013. Cities comprised 63% of sub-national capital expenditures, a proportion only slightly higher than their share of the total national population. More than half of capital spending by cities is outside the three social sectors (Figure 84). In all types of cities except sub-type D (Growing light intensity in shrinking footprint), the largest share of capital expenditures goes to Economic Affairs. Capital expenditures account for less than 15 percent of city expenditures in all sectors except Economic Affairs, Environmental Protection, and Housing and Utilities, where the share of capital expenditures is 76%, 68%, and 25% of total city expenditures, respectively. 109 Martinez-Vazquez, Jorge, and Andrey Timofeev. 2012. “Propensity to Invest and the Additionality of Capital Transfers: A Country Panel Perspective” International Studies Program Working Paper 12-16. International Studies Program, Andrew Young School of Policy Studies, Georgia State University. CHAPTER 2 Cities and the Inter-Governmental Fiscal System Figure 84 – Composition of capital expenditures by function and city typology, 2013 Note: A: Growing light intensity in expanding periphery; B: Declining in all aspects; C: Dimming periphery; D: Growing light intensity in shrinking footprint; E: Growing light intensity in expanding periphery; F: Thriving core, shrinking footprint. 106 Physical and intellectual development system Social welfare Education Healthcare Housing and municipal economy 100% 80% 60% 40% 20% 0% A B C D E F No type Ukraine_2015_nov26.indd 106 2015-11-26 5:14 PM
  • 129.
    In the Educationand Health care sectors, per capita capital expenditures decrease with the size of a city, while in Housing and Utilities and other non-social sectors they increase (Figure 85). This is consistent with the patterns found for total per capita expenditures in those sectors. Per capita capital investments are lower in cities with population declining more than the national average (Figure 86). This is mostly driven by city investments in non-social sectors other than Housing and Utilities, in particular Economic Affairs and Public Administration. CHAPTER 2 Cities and the Inter-Governmental Fiscal System Figure 85 – Per capita capital expenditures by function and population size, 2013 Figure 86 – Per capita capital expenditures by function and population trend, 2013 107 Education Healthcare Social welfare Housing and Utilities Education Healthcare Social welfare Housing and Utilities Other sectors Other sectors UHApercapita Smalltowns Midsizetowns Largetowns Smallcities Midsizecities Majorcities 250 200 150 100 50 0 UHApercapita Positive growth Declining but less than urban average Declining but less than national average Declining more than national average 160 140 120 100 80 60 40 20 0 Ukraine_2015_nov26.indd 107 2015-11-26 5:14 PM
  • 130.
    IV. Cities andthe Fiscal System This study examined public finances of all cities at all three tiers of sub-national government. Some of the patterns found in this chapter reflect the fact that different tiers of sub-national government had – and in the case of Kyiv still have – different assignments of revenue sources and functional responsibilities. Thus, larger cities tend to depend less on explicit grants, while relying more on non-tax revenues and locally-retained shares of national taxes. However, this pattern is not driven by demographic trends, but by the fact that larger cities tend to be at higher tiers in the administrative hierarchy of sub-national government. Thus, until 2015, a larger share of national tax revenue (e.g., PIT) was allocated to the budgets of higher-tier cities than to the budgets of bottom-tier cities. While at 60,000 residents the average size of a Ukrainian city makes it possible for an average city to provide major social services, including education and health care, almost a quarter of the country’s cities have fewer than 10,000 residents. While this might be too small to achieve the minimum efficient scale of provision, this challenge is somewhat mitigated by the fact that most major social services are delegated to the oblast and sub-oblast tiers, leaving sub-district cities responsible only for pre-school education and cultural/recreational centers. Nevertheless, there is an inverse relationship between population size and per capita expenditures, particularly concerning the Education and Social Welfare sectors. In 10 percent of Ukraine’s cities, per capita expenditures are more than four times higher than the median level. Although just 1.7% of the population of all cities, these outlier cities account for 10% of expenditures of all cities. The extremely high levels of per capita expenditures appear to be primarily driven by the small scale of service provision since the population of these cities is six times smaller than in an average city. Across all cities there are increasing economies of scale in all social sectors except hard municipal services such as Economic Affairs and Housing and Utilities. These economies of scale are particularly pronounced in the Education and Social Welfare sectors and primarily related to payroll costs and welfare benefits. As a result, larger cities allocate a smaller share of their expenditures to Social Security while a greater share is allocated to Goods and Services and Capital Investments. The share of city expenditures allocated to capital investments ranges from 1.6% in small towns to 9.4% in major cities. Per capita investments are lower in cities where population is declining more than the urban average. While cities are housing the bulk of national population and driving the economic growth, until 2015 their fiscal fortunes had been determined by the overall system of inter-governmental relations in the country. This was particular true for sub-district cities – which relied on intermediation by district authorities in their financial affairs – as over 80 percent of city revenues were not locally-derived but came from retained shares of national taxes and other transfers. Despite attempts to introduce formal criteria for the allocation of inter-governmental financial resources, government transfers were not based on an objective demand for services but largely financed the existing network of service facilities and staffing. Such financial disincentives, combined with legal constraints on local government discretion in downsizing the network of facilities and their staff, impeded fiscal adjustments necessitated by demographic and economic changes. Not surprisingly, differences in expenditure patterns among different categories of cities had strong associations with the incidence of grants but little relationship to the amount of locally-derived revenues. By disregarding expenditure needs altogether, the new general-purpose grants can remove financial disincentives that optimize networks and staff in hard municipal services. However, by earmarking new subventions separately for Education and Healthcare, the new system can further entrench under-utilized social infrastructure unless the subvention formulas focus on service needs as opposed to capacity of existing facilities. The only area where there is a clear relationship between city finances and a city’s economic base is in the use of own tax instruments, which produced more revenues in cities thriving in all respects (sub-type A). Similarly, cities with higher population decline appear to raise less own-source revenues per capita. However, because these own sources of revenue CHAPTER 2 Cities and the Inter-Governmental Fiscal System 108 Ukraine_2015_nov26.indd 108 2015-11-26 5:14 PM
  • 131.
    account for atiny fraction of city revenues, they make virtually no difference in their financial condition. However, when the right incentives are embedded in the system of inter-governmental fiscal relations, even existing local tax instruments can be utilized more fully by city governments to generate more significant revenue. While for reasons of efficiency structures should be taxed less than land, the currently negligible levels of collection from this local property tax (less than 0.01% of GDP) can be significantly increased. Until 2015, business taxes had been the most utilized out of all tax handles available to city governments in Ukraine. By far the largest per capita yield is observed for the Single Tax, which is paid by small businesses in lieu of the income tax and other national taxes. While taxation of businesses might be more expedient from both political and administrative perspectives, it is not as conducive to accountability and fiscal responsibility as taxing residents. Also, revenues from taxation of business are likely to be more volatile and thus can exacerbate the impact of urban decline. Revenues from property taxes, even when based on market values, are known to be less elastic. As with the reliance on business taxes, derivation-based sharing of revenues from national taxes, such as PIT, can amplify the revenue impact of urban decline. Derivation-based sharing makes local government revenues more volatile than formula-based sharing of revenue from national taxes. Pooling the sub-national share of revenues from national taxes in a redistribution fund and then allocating to each locality on a formula basis would reduce the volatility of revenue streams for cities by offsetting cyclical fluctuations in tax payments from various businesses located in individual localities. Furthermore, derivation-based revenue sharing makes it difficult to account for revenue capacity in the allocation of equalization grants. This is because there are no statistical indicators available that objectively capture differences in taxable bases at the bottom-tier level. By using lagged collections as a proxy for revenue capacity, equalization grants discourage mobilization of own revenues. By contrast, revenue sharing entirely based on a per capita formula, combined with adjustments for objective differences in expenditure needs, would provide each city with a predictable budget envelope and allow them to keep any gains achieved by rationalizing their expenditures. Formula-based revenue sharing combined with a hard-budget constraint can provide the right incentives for self-sufficiency. While being more stable and predictable, formula-based sharing of PIT is not a substitute for a genuine source of own revenues. While derivation-based sharing has some of the same features of local taxes, only the latter can provide local revenue autonomy because – unlike revenue sharing – surtaxes allow local governments a certain measure of discretion over the tax rate, and thus the ability to control their revenue on the margin. Thus, while sharing of PIT can contribute to the financing of local governments, it does not contribute to achievement of a level of revenue autonomy by local governments and to their subsequent increased accountability and fiscal responsibility. High dependence on inter- governmental revenues raises the question of whether cities control their revenues or whether the revenues control the cities’ policies. Increased revenue autonomy can lead to greater accountability and creates the basis for local creditworthiness. First, endowing local governments with a degree of revenue-raising authority allows them to increase or decrease those expenditures over which they have responsibilities based on the needs of their constituency110 . Second, local taxpayers will have a strong interest in ensuring that local officials use local budget resources wisely. Dependence of local governments on the revenue decisions of the central government (including decisions concerning sharing revenue from national taxes and most other forms of transfers) undermines the accountability of local officials to their constituency. CHAPTER 2 Cities and the Inter-Governmental Fiscal System 110 Thus revenue autonomy does not require that local governments control (i.e., determine bases and rates) for all their revenue sources. It would suffice if they could increase or decrease rates for a few taxes that comprise a meaningful share of their revenues with the rest coming from the predictable and stable sharing of national tax revenues. However, there would be little revenue autonomy if any additional revenue from higher local taxes were almost entirely offset with a reduction in grants. 109 Ukraine_2015_nov26.indd 109 2015-11-26 5:14 PM
  • 132.
    Broadening revenue-raising powersof city governments can be achieved through a combination of reforms related to tax administration and enforcement and tax assignment policy changes. Given that the most expensive local functions (Education, Health care, and Social Protection) are to be financed with earmarked grants starting from 2015, the remaining (own) local functions can to a large extent be covered by fully utilizing the ‘tax handles’ that have traditionally been given to local authorities throughout the world (user fees, property taxes, and betterment levies) as well some additional taxes, including vehicle and transportation taxes and a PIT surtax (or piggyback). While Ukraine’s cities have always received a share of revenue from some of these taxes levied by the national government (land tax and vehicle tax), until 2015 they were passive recipients of these monies and thus could not affect this revenue on the margin. The recent introduction of earmarked financing of social services, including Education and Health, should allow cities to focus on their core functions, such as urban infrastructure. However, local governments can also play an important role in the process of rationalization of the school network. Besides realizing the economies of scale in managing the network of schools – for example, by sharing specialized staff or custodial services among schools – local governments could also realize economies of scope in using the same facility for several functions such as education and culture. In these matters of coordination and rationalization, local governments have an information advantage over the central government. In addition, local governments can be instrumental in securing community consent for network rationalization by facilitating bargaining among affected parties (i.e., among winners and losers). For example, it is much harder to justify the closure of a school to the local community when the savings cannot be shifted to other services, which may be more critical for the community. In the short term, the focus of reforms should be on increasing the yield of user fees and property taxes, and perhaps introducing several new local taxes. Establishing minimum rates for these taxes (as exists for the Single Tax) could be an effective way to make cities assume to a minimal extent their responsibility to collect own revenues. In the medium term, the reassignment of those other taxes from national to sub-national levels will bring very desirable improvements to city finances, including increased horizontal accountability of local officials to their residents and greater fiscal responsibility in expenditure and debt management at the sub-national level. CHAPTER 2 Cities and the Inter-Governmental Fiscal System 110 Ukraine_2015_nov26.indd 110 2015-11-26 5:14 PM
  • 133.
  • 134.
  • 135.
    113 CHAPTER 3 Urban Planning andthe Spatial Development Ukraine_2015_nov26.indd 113 2015-11-26 5:14 PM
  • 136.
    Key Highlights andImplications for Further Policy and Analytical Work Urban planning in Ukraine bears the legacy of a centralized planning system. It is not sufficiently flexible to respond to market conditions and be an effective tool in developing the urban space. Centralized development of master and zoning plans is inefficient, costly and distant from realities on the ground. It is also not sufficiently transparent or welcoming to public input and debate. In addition, the planning framework is not equipped to adequately support strategies that reflect the reality of population loss and economic decline. Existing urban plans are aligned with national growth policies, and so propose expansions of housing and economic activity across all cities. Recent steps orchestrated in the Government’s Action Plan on Decentralization towards a planning reform, if implemented in full, have the potential to place planning at the local level, which will permit cities to determine their own priorities along their economic and social needs. It will promote a more transparent system resulting in plans more closely attuned to the actual conditions of growing and shrinking cities. Such changes will require increased funding and intense capacity building at the local level. Going forward, urban planning and spatial development should take note of the continuous demographic changes and shifts in the country. Current mobility remains low and the high homeownership rate has prevented the widespread housing abandonment that characterizes typical shrinking cities in Europe and United States. Once mobility increases and people start migrating to opportunity, declining cities are likely to decline even faster, while the growing centers and agglomerations may experience peri-urban growth and sprawled development. In both cases, authorities will need to reassess how infrastructure is planned and maintained to ensure that shrinking cities continue to provide acceptable levels of service to their population at a reasonable cost, while growing urban centers are supported to further foster growth. CHAPTER 3 Urban Planning and Spatial Development 114 Ukraine_2015_nov26.indd 114 2015-11-26 5:14 PM
  • 137.
    17 National Laws andthe Reform Process Urban planning in Ukraine has evolved since independence, but still bears the legacy of a centralized planning system inherited from the Soviet era, a time when urban development was under state control. The planning system has adopted international standards such as streamlining building permit procedures; encouraging public participation; and increasing access to planning information. However, the principal challenge remains: to bring legislation and practice in line with contemporary standards that allow increased flexibility for local level planners to manage development. As a result, local governments in Ukraine are yet to capitalize fully on typical urban planning strategies - attracting investment, revitalizing the housing market, modifying infrastructure, revitalizing city centers aimed at stemming decline, and focusing on reducing the urban footprint111 . Over the past 20 years, urban planning reform in Ukraine shifted between centralized and decentralized planning models - and back - which caused disruption in local government’s allocation of land and issuance of permits and stifled potential market demand for urban land. Three national-level laws were passed in this period to govern urban legal, regulatory, and institutional processes. Requirements for stakeholder participation and procedural transparency were modernized through two key national-level urban planning laws. The Law of Urban Development (1992) was Ukraine’s first post- independence law that maintained the centralized Soviet system and gave primary planning, monitoring and execution powers to the State Architectural and Construction Inspection Agency (SACI). Under this law, regional and district councils had secondary planning authority, while local government’s function was to simply monitor implementation of government programs. The law did, however, give local governments the power to approve planning documentation on territory located in their jurisdiction. The subsequent Reform Law of Urban Planning (2011) simplified planning procedures. However, while local government obtained the power to plan and influence land use, spatial development, and zoning ordinances, they did still not have the power to prepare Master Plans themselves. Instead, these continued to be prepared by a central planning agency. Furthermore, although the 2011 law mandated cities to have master plans and new zoning plans within months of the law’s approval, no funding was made available to cities to make these provisions a reality (See Annex VIII for more detail). In the absence of a mandated plan, many local governments temporarily stopped re- allocating land plots and issuing local permits in the absence of transitional arrangements; this stifled market-led spatial and economic development. At the same time, another 2011 law – Law on Regulation of City Construction Activities and State Construction and Architecture Control – streamlined the planning development process by reducing the time allowed for government to process and approve permits and certificates from 415 days to 60 days. A series of so called centralization laws112 approved between 2012 and 2014 further shifted urban planning powers from regional and local governments back to the executive branch of the central government (See Annex VIII). The overall effect of these laws with respect to urban planning was the re-centralization of previously local functions to the national level, including zoning ordinances, building contracts, permits, and communal housing. In doing so, the 2012 laws placed tremendous administrative burden on the Ministry of Regional Development, Construction, Housing and Communal Services (MinRegion) without providing commensurate increases in human or financial resources, thereby limiting implementation of the law’s new provisions. The Law increased the authority of the central government in urban planning, further diminishing the power of regional and local governments. I. Regulatory and Institutional Framework 111 Empirical studies from other countries suggest that economies of scale in the delivery of municipal services are mostly exhausted at an average size of 10,000 inhabitants, even though there are some special services, such as urban transportation and solid waste utilization, where economies of scale improve up to the size of 100,000 inhabitants (Lago-Peña and Martinez-Vazquez, 2013). 112 In 2012, a series of so-called ‘centralization laws’ enacted by the national government mandated changes to a variety of laws including those concerning urban planning. CHAPTER 3 Urban Planning and Spatial Development 115 Ukraine_2015_nov26.indd 115 2015-11-26 5:14 PM
  • 138.
    However, recent governmentinitiatives, within the context of overall decentralization reforms in Ukraine, support the delegation of urban planning functions to the local level. The Government’s Action Plan on Decentralization, published in December 2014, and the 2015 amendments to the Law on Regulation of City Construction Activities and State Construction and Architecture Control, if implemented in full, would permit cities to determine their own planning priorities according to their economic and social needs. The reforms would also permit private development actors to have full access to planning, zoning, and building information in order to facilitate a well-functioning land market. These recent developments would bring current urban planning practices in line with contemporary international standards that allow increased flexibility of local level planners in managing development. Partly due to the fact that it is mostly centralized, Ukraine’s planning framework does not adequately support strategies that address the reality of population loss and economic decline. The one exception is the Law on Master Scheme of Territorial Planning of Ukraine (2002), which requires cities and other settlements to develop general city plans and detailed territorial plans based on demographic forecasts. This should ideally capture cities that are potentially shrinking or declining in population. However, there is little evidence that this law has been effective in guiding planning for such declines. In general, existing urban plans are aligned with national growth policies that propose expansions of housing and economic activity across all types of cities. While these policies are suited for cities that are growing, they do not correspond with the realities of declining cities. These urban plans do not propose alternative uses for underused industrial districts, brownfields, or abandoned buildings; such plans lock land from use and represent a lost economic opportunity. Elsewhere, increased flexibility in urban planning has allowed declining cities such as Dresden in Germany to undertake alternative development paths and adapt to demographic changes.113 Enforcing new regulations that have decentralized functions to the local level requires systemic changes including increased funding and capacity building. Today, planning regulations required by law often remain unimplemented due to insufficient funding or capacity. Many city-level General Plans114 (hereafter referred to as “Master Plans”), as well as local zoning information, are outdated. Other planning elements, such as the requirement for citizen participation, are ignored or subverted. Decentralizing urban planning places more responsibilities on local bodies; however, it can only be an effective local development tool if local governments are enabled with the right set of capacities and financing. Urban Planning Institutional Framework The urban planning policy framework in Ukraine is fragmented between the nation’s legislative and executive bodies and other public stakeholders. Various committees, ministries, agencies, and associations are responsible for elements of urban planning policies that span physical, economic, and cultural development (See Table 15 and Annex VIII). On the legislative end, two Verkhovna Rada (Parliament) Committees develop laws independent of other government institutions. In addition, several central government ministries – the Ministry of Economic Development and Trade, the Ministry of Culture, and MinRegion – make planning decisions within their respective areas of responsibility, i.e., economic development, culture, and construction. Among them, MinRegion makes the majority of planning decisions. It is responsible for the development and implementation of national policy on urban planning, architecture, housing construction, and formulation of regional development policy. MinRegion also monitors the implementation of urban planning legislation and initiatives. Other public players include the state scientific and research institutes, the most important among which is the Ukrainian State Scientific Research Institute for Urban Planning (Dipromisto). Dipromisto develops the national and regional General Plans and the city-level Master Plans as discussed in the next Section. 113 Dresden experienced a cycle of initial decline and regeneration between 1990 – 2002. In this period, the city went through three different phases of planning policy – Phase I Ignoring Shrinkage/Going for Growth (1990-1995); Phase II Urban Restructuring (1996-2001); and Phase III Re-urbanization (2002-onwards). 114 For ease of reference, this chapter will refer to the city level General Plans as Master Plans to avoid confusing them with the national and regional level General Plans. CHAPTER 3 Urban Planning and Spatial Development 116 Ukraine_2015_nov26.indd 116 2015-11-26 5:14 PM
  • 139.
    Executive Legislative Brunch Locallegislative Regional and Municipal Authorities Other Public Players Ministry of Regional Development, Housing Construction, and Communal Services. Agencies under its authority: 1) State Architectural and Construction Inspection (SACI) 2) State Service of Geodesy, Cartography and Cadastre (merged in 2015 with State Agency of Land Resources and Cartography Agency) 3) State Agency of E-government Ministry of Ecology and Natural Resources of Ukraine Ministry of Economic Development and Trade Ministry of Culture Verkhovna Rada Committees: 1) Committee for Construction, Urban Planning, and Communal Housing 2) Committee for State Construction, Regional Policy, and Local Self-Government Oblast and raion state administrations, including regional representative offices of national agencies and ministries Oblast and raion councils City councils and their executive committees Three state research and scientific institutes: 1) Scientific Research Institute Dipromisto 2) Scientific Research Institute of City Construction 3) State Company “Ukrainian State Scientific Research and Planning Institute of Civil Construction” Communal enterprise “Institute of Master Plan of Kyiv” Association of Ukrainian Cities Association of Small Cities of Ukraine Eastern Ukrainian Centre of Community Initiatives Another consequence of the current institutional set-up is that local governments are developing informal Strategic Plans, which are not connected to the Master Plans, in an effort to wrest some control over their development. Strategic plans, discussed in the next section, are developed by local government often with support from donor organizations, whereas Master Plans are developed by Dipromisto and approved by the MinRegion. Ukraine’s centralized planning system requires Master Plans for every settlement, but accords settlements little latitude in determining the content of those Plans. Consequently, local governments have often chosen to generate strategic plans that take into account local views but that have no formal relationship to the Master or General plans. The overarching consequence of the current system is that it has rendered urban planning inflexible. Ukraine’s planning system is centralized and often cannot take into account local conditions. The central government generally lacks the flexibility or mechanisms to consider special conditions or local contexts, presenting particular challenges for smaller cities that may need sensitive, small-scale planning policies to suit their particular conditions. CHAPTER 3 Urban Planning and Spatial Development The division of planning functions between government bodies creates structural challenges, ambiguity, and duplication of efforts to formulating and implementing planning policy in Ukraine (Table 15). For instance, MinRegion authored the Reform Urban Planning Law of 2011. Then in 2012, the Verkhovna Rada passed the centralization laws limiting city governments’ planning powers and contradicting the Reform Urban Planning Law of 2011. Another consequence of the current institutional set up is that it perpetuates potential conflicts of interest between agencies. For example, Dipromisto defines the parameters of city-level Master Plans, but it is also the primary generator of such plans. Table 15 - Urban planning and spatial development institutions 117 Ukraine_2015_nov26.indd 117 2015-11-26 5:14 PM
  • 140.
    II. Spatial Planning Ukrainesets a demanding standard by requiring spatial planning at all levels, from the scale of the entire nation to the level of individual buildings, contrary to international best practice115 and with implications at the local level where contexts and needs differ from city to city. There are three levels of spatial plans in the country, all of which are referred to as “General Plans” and are further classified by the administrative territory they cover – national, regional, and local/ city-level. Under the current fiscally-strained condition of the country, planning standards are difficult for officials to meet. Local General Plans (aka Master Plans) are time-consuming and expensive to produce and to update. National planning institutes such as Dipromisto lack the staff to create and update local Master Plans, and cities do not have enough resources to commission them. As a result, many Master Plans are old or outdated. In cases where sufficient resources exist, as in Kiev, political disputes sometimes derail the effectiveness of the Master Plans and this in turn puts lower-level planning decisions (e.g., zoning ordinances) on hold as they do not conform to the city’s Master Plan. Further, zoning standards are predicated on city growth, but most Ukrainian cities are no longer growing. Even when Master Plans are produced and updated, the task of creating and altering lower-level zoning and building codes is too costly for fiscally-strained city-level planning departments to meet. A final challenge is that if zoning and building plans (i.e., architectural designs) exist, they are most often not made public, so it is impossible for interested private-sector actors (e.g., developers) to access them. General Plans Ukraine has a national hierarchy of plans. At the national level, Dipromisto is responsible for developing the “General Scheme for Planning of Territory,” or the General Plan of Ukraine, which essentially is a land-use planning and strategic planning document for the nation (See Box 9). All subsequent spatial plans/general plans for regions, municipalities and settlements are to conform to the General Plan for Ukraine, making the system inflexible and many times non-responsive to local situations. Below the General Plan of Ukraine, Dipromisto116 also creates Regional General Plans for cross- border zones, oblasts, and districts. As with cross-border zones themselves, the plans may spill over the administrative boundaries of a specific district. 115 This national plan, or General Plan of Ukraine, is another legacy of Soviet-era planning where Territorial Spatial Plans were prepared for the nation. Best practice suggests development of regional plans, city master plans, and local zoning plans and architectural plans /design of buildings. 116 Dipromisto’s role in preparing General Schemes for 27 territories in Ukraine was adopted into law on February 7, 2002. Ordinance: No. 3059-III. CHAPTER 3 Urban Planning and Spatial Development 118 Ukraine_2015_nov26.indd 118 2015-11-26 5:14 PM
  • 141.
    17 Ukrainian planning legislationrequires that all cities of over 50,000 inhabitants produce Local General Plans also known as Master Plans.117 Master Plans are produced by government-run Planning Institutes, the principal one being ‘Dipromisto.’118 Dipromisto generates Master Plans for most oblast capitals, except for select cities, like Kyiv, that develop their own. Kyiv has its own planning institute, the “Institute of General Plan of Kyiv.” Master Plans developed in Ukraine for cities, towns, and villages require detailed zoning plans for housing, schools, green space, and other civic infrastructure. They are produced on an ongoing basis at the request of cities and are theoretically formulated according to a city’s future development trends. 117 Law on Regulation of City Construction Activity #3038-17, 17.02.2011 118 The other two planning institutes are the Scientific Research Institute of City Construction and the Ukrainian State Scientific Research and Planning Institute of Civil Construction. General Scheme of Territorial Development of Ukraine or General Plan of Ukraine: The purpose of the General Plan of Ukraine is to establish a spatial land use plan for the territory of Ukraine; create and maintain elements of the plan that ensure Ukrainian citizens have access to adequate housing, environmental protection, healthcare, and protected historical and cultural monuments; and determine national priorities for housing, industry, engineering, transportation, and social infrastructure. The General Plan includes data about the following national elements: Geo-strategic and geo-economic data; land, water, forest, recreational, and medicinal natural resources; the demographic, scientific, manufacturing, historical, cultural, and tourist potential of international and state significance; networks of settlements; social, engineering, and transport infrastructure; investment policy; and the environmental situation. General Plans at the regional level (aka Regional Plans): General Plans are created at the regional level for cross- border zones and oblasts. These regional plans guide land and industrial uses, conservation areas, and regional infrastructure relative to the resources and needs of each district/oblast. Plans for oblasts focus on land-use proposals, housing settlements, and evaluations of the area’s urban development potential. Local General Plan (aka Master Plan): Local General Plans are city-level plans commonly known as Master Plans in many countries. The Local General Plan represents the overall development vision and spatial growth of a city, providing an essential legal basis for land-use regulation such as zoning and sub-division control, and including plans for schools, housing, green spaces and other civic infrastructure based on population forecasts. Per international norms, a modern master plan should present a unified and compelling vision for a community, derived from the aspirations of its citizens, and establish the specific actions necessary to fulfill that vision. Zoning Plans: Areas of land within a city or municipal limit are divided by appropriate authorities into zones within which various uses are permitted. Thus, zoning is a technique of land-use planning used by local government urban planners in most developed countries. Zoning ordinances define land uses in a community, whether commercial, residential, industrial, or recreational, and they benefit the community by establishing design standards for that land use. Detailed Plan ofTerritory: According to Reform Law of Urban Planning (2011), there is a 5th tier of spatial planning. Cities with populations exceeding 50,000 should also develop a “Detailed Plan of Territory” for individual micro- districts and estates of the city where new construction activities are planned. These plans should be discussed with the local community, approved by the local council, and made accessible to the public. CHAPTER 3 Urban Planning and Spatial Development BOX 9: TYPES OF URBAN/SPATIAL PLANS IN UKRAINE 119 Ukraine_2015_nov26.indd 119 2015-11-26 5:14 PM
  • 142.
    Resource constraints andthe monopoly of Master Plan preparation at the central level has resulted in many cities not having completed or updated their Master Plans, limiting local governments’ ability to manage their land and property resources efficiently. A review by MinRegion in May 2013 showed that only 62% of all oblast capital cities, 42% of cities of raion significance (or provincial centers), 21% of urban settlements, and 14% of villages had Master Plans119 . In addition, only 33 zoning plans were developed across all of Ukraine and 624 detailed plans of territories. Dipromisto and two other planning institutes which are developing spatial plans for cities and territories are understaffed, overworked, and often find difficulty keeping up with demand to complete local plans by the stated deadlines. Also, Dipromisto’s charges tend to be cost-prohibitive for smaller cities with limited budgets. Further, since in practice, plans produced by Dipromisto are typically the ones recognized as official, Dipromisto is the preferred agency for cities (See Figure 88); consequently, it has a backlog of Master Plan development, leaving cities with outdated local plans. International practice holds that while there may be one regulatory agency at the national, regional, or local level to approve urban plans, the production of plans itself is open for outsourcing. However, legislation that requires plan production through state planning institutes has been recently revised to permit plan production by private enterprises licensed by the state; however, this legislation has yet to come into effect.120 These recent changes effectively eliminate the monopoly of state research institutes in architecture and planning control and open the possibility for inclusion of the private sector. When implemented, these changes should bring much more flexibility and local control to urban planning, which could then be used more effectively as a development tool by local governments. Competition from the private sector should also ‘incentivize’ all plan makers, including planning institutes, to update their planning procedures. The great discrepancy between planning laws and actual planning practice in Ukraine reduces public trust in the planning system. The planning laws in Ukraine dictate the development and publication of planning, zoning, and building documents; require public participation in development procedures; and outline clearly understandable steps for obtaining building permissions. In practice, these policies are not always followed. Master Plans are often non-public documents and often not implemented. Zoning ordinances are irregular and do not conform to Master Plans. Procedures for obtaining development and building permissions remain overly complicated; this allows for an increased role for intermediaries that are hired by private developers to facilitate the process, increasing the probability of corruption. Master Plans are made public only partially, encouraging land development speculation rather than guided private sector investments, contrary to the objectives of the Master Plans themselves. While Ukrainian cities are required by law to have Master Plans, and public input and hearings on planning decisions, including the production of drafts, is also required in practice, the Master Plans themselves are not always public documents in practice. In Kyiv, for example, the official Master Plan “GenPlan 2020,” is not fully available online. However, Kyiv’s Genplan 2025, which is still under preparation, is available online in accordance with recent government efforts to increase public access to information. Although explicitly required to be public by a 2011 law121 , Master Plans are yet to be fully public documents in some cities. This partial secrecy at the local level stands in strict contrast to strategic plans, discussed later, which, by their very nature are stakeholder-driven and fully public documents that are also generally available online. However, this local-level secrecy may be changing; in response to laws passed in 2011 with regard to improving public information, MinRegion – as the responsible agency for planning – is gradually introducing e-governance to improve transparency and public access to information. A review carried out by MinRegion found that cities are slowly starting to publish their plans online; in 2013, 73 cities published their master plans online, while in 2014 this number grew to 169 (representing 40% of the total number of Master Plans developed). MinRegion’s aim is to have all updated Master Plans for all types of settlements online by the end of 2015. 119 http://www.minregion.gov.ua/attachments/content-attachments/1067/2330.05.13.pdf 120 Law No. 1546 was approved on 9 April 2015 and signed by the President in June 2015. 121 Article 14 of 2011 Law No. 3038-17 CHAPTER 3 Urban Planning and Spatial Development 120 Ukraine_2015_nov26.indd 120 2015-11-26 5:14 PM
  • 143.
    State level The GeneralScheme of planning for the territory of Ukraine Schemes of planning of separate parts of the territory of Ukraine Regional level Schemes of planning of the territories of Autonomous Republic of Crimea and oblasts Schemes of planning of the territories of rayons Local level General plans of settlements Territorial zoning plans Detailed plans of the territory (site/building plans) Further decentralization of the planning system would give planners additional powers to formulate Master Plans and zoning plan recommendations responsive to city and stakeholder views at the local level. Decentralization of planning powers that allowed city-level planners to amend local Master Plans would enable city planners to add zoning incentives consistent with the public interest to make a property more attractive for a developer. This would promote a well- functioning and transparent urban planning system as a strong tool used by local governments to take stock of a city’s growth patterns and economic needs and plan towards a shared economic and spatial development vision. This could result in plans more closely attuned to the actual conditions of shrinking cities and that more closely reflected the desires of city-level stakeholders. CHAPTER 3 Urban Planning and Spatial Development Figure 87– Hierarchy of spatial plans produced by Dipromisto (2013) 121 Ukraine_2015_nov26.indd 121 2015-11-26 5:14 PM
  • 144.
    Strategic Plans Strategic Plansemerged in Ukraine as an independent process in line with international standards, and, although not replacing Master Plans, they have filled a gap in cities lacking updated Master Plans. Strategic Plans focus mainly on socio-economic development, seeking to enhance city competitiveness and seeking to improve access to and quality of local infrastructure and services. These plans essentially help guide city leadership in implementing socio-economic policies. The Strategic Plans are locally-produced documents, existing in parallel to Master Plans that focus on social and economic strategies to connect physical and spatial planning. They are often funded by and produced with assistance of external donors. Many cities in the world produce Strategic Plans in addition to Master Plans. Kyiv, for example, developed its City Development Strategy (CDS) for 2025 with the support of Cities Alliance and other partners such as the Fund of Effective Governance (see Box 10). The development of Strategic Plans such as CDSs permits municipalities to agree on a vision for future development in a consultative manner with key stakeholders and the general population. The development vision is derived by analyzing a city’s economic strengths, weaknesses, opportunities, and threats based on a detailed diagnostic of its local economic potential, existing infrastructure, and other local and regional advantages compared to neighboring cities and states. To achieve the development vision, cities agree on strategic action plans and investments that can guide capital investment plans of the local government or attract donor and private investment in the future. Strategic Plans are viewed as useful exercises for strategizing on socio-economic issues; however, they are not effective tools to ensure implementation unless accompanied by funding. It should be noted that these plans should not be used as a replacement for land use and zoning plans and cannot be used, for example, to determine changes in land use for individual buildings or plots in ‘brownfield’ areas that may be suitable for redevelopment. Strategic Plans are often perceived by city stakeholders as having more relevance for the city than formally produced and approved Master Plans simply by the fact of the Strategic Plan being locally prepared by relevant stakeholders. The introduction of Strategic Plans into the urban planning process of Ukrainian cities is a welcome development; the Strategic Plans could inform updates to Master Plans by helping incorporate the latest economic and social projections for a particular city and ensuring that public interests are at the forefront of the planning process. In contrast, Master Plans are periodically-produced documents with a long- term horizon of 15-30 years. The shorter planning time horizon of 5-10 years in Strategic Plans make these plans easier and possibly cheaper to produce. They can, among other benefits, inform regular updates and amendments to the Master Plans and other spatial planning documents. Zoning Plans The 2012 centralization laws mandated centralized development of local zoning plans; this is likely to prove inefficient and costly since it is distant from realities on the ground and it is also contrary to best practice. Local planners know their city’s needs better and are in a better position to determine the spatial growth pattern and constraints. It is for this reason that zoning plans globally are generally prepared by city-level planning organizations. Central government-generated zoning plans encourage building developments that do not conform to existing and/or projected development scenarios. Developers are technically required to consult with the city authorities, incorporate the Master Plan, and to hold a public hearing before moving forward. In fact, approvals are provided based on by the zoning plans produced at the central level, which may not reflect the views of city officials and residents. The issue is further complicated by weak oversight and enforcement in investigating unauthorized building construction across the country. The planning laws should place the development of zoning plans, zoning ordinances, and building permitting functions at the city level as per global best practice. Such reforms should be accompanied by appropriate capacity-building and training at the city level; local governments currently lack expertise in zoning issues and this perpetuates dependence on central agencies located in Kyiv. In addition, zoning plans should be regularly updated, legally enforced, and publicly available online. The current CHAPTER 3 Urban Planning and Spatial Development 122 Ukraine_2015_nov26.indd 122 2015-11-26 5:14 PM
  • 145.
    122 Author’s observationsbased on a team field research visit to Kyiv in 2014. There is a lack of agreement between actual spatial trends and spatial trends projected in planning documents. A closer review of planned projects and actual land use changes for two cities made by the authors of this Chapter – Kyiv, a city that is growing, and Kherson, a city in decline – found irregularities in zoning and building planning procedures resulting in developments that contravene zoning laws. Development that was not projected in the planning documents was built and development that had been projected was not. Despite a detailed legal framework for applying for building permissions, violations of spatial guidelines were noted, particularly in Kyiv122 . Permissions that had been granted for buildings surpassed zoning limitations sometimes to the detriment of adjacent historic buildings. Zoning standards to accommodate shrinking cities have not been developed for Ukrainian cities although they are available and in use internationally. In the United States, for example, declining cities such as Youngstown, Ohio have revised their zoning ordinances in order to convert industrial and commercial districts to park land, recreational, and natural green areas. The re-zoning was first proposed in the Youngstown 2010 Plan. Development Vision: By 2025, Kyiv will become an innovation center for the Eastern European region with a strong competitive position and clear development priorities. This city has maintained and is developing its unique identity and its historical legacy. It constantly improves the standards of living for its residents and its own attractiveness for business. Its development will be implemented in close cooperation with businessmen and investors amid constant improvement of the system of governance and preservation of the city’s greenery. On an international scale, Kyiv will be described as (1) Europe’s greenest capital city; (2) the recognized meeting site of the West and the East; and (3) an environmentally-friendly city about which its residents pride themselves. Strategic Development Objectives: • A two-fold increase in Kyiv’s economic welfare indicators (gross regional product per capita) by 2025 • A considerable improvement in the major comfort-of-living indicators (a 1.8 percent increase in the comfort-of- living index). What will the city of the future look like? Dynamic. encouraging innovations Unique, preserving and developing its identity Livable, improving its standards of living Open for business Clear, having a transparent system of governance Green and well-balanced Kyiv on an international scale Europe’s greenest capital city The recognized meeting site of the West and the East The city which its residents pride themselves on CHAPTER 3 Urban Planning and Spatial Development status of zoning plans as de facto non-public documents is a holdover from the state-driven economy and hampers the normal functioning of land development based on market demands. BOX 10: KYIV 2025 CITY DEVELOPMENT STRATEGY (SUPPORTED BY A CITIES ALLIANCE GRANT AND OTHER PARTNERS) 123 Ukraine_2015_nov26.indd 123 2015-11-26 5:14 PM
  • 146.
    Engaging Citizen Participation Althoughcitizen participation is a required element in Ukraine’s development permitting, such participation is often limited. In practice, however, the process of involving citizen participation and consultations in planning is often not followed. Public hearings are required according to Article 13 of Ukraine’s Self-governance Law, but the procedure for conducting public hearings123 has yet to be fully implemented and local government agencies need to amend their city charters accordingly. As a result, the process is haphazard and subject to the will of political officials; consequently, proper public outreach is not ensured, a consistent schedule of public hearings is often not met (they are held as seldom as once a year), and citizens’ suggestions during public meetings are sometimes subject to approval by national or local authorities. An increasing number of cities have started to publicize their city plans, but the public availability of detailed zoning and building plans remains limited. This makes irregularities in the planning process more likely, since there is no way to confirm what officials have determined regarding land use or building status for a specific parcel of land. As the vast majority of cities do not possess GIS-based electronic systems, the lack of digital land and building information also inhibits an effective planning process. Violations of planning regulations in Ukrainian cities reflect the lack of knowledge and enforcement of public participation rights. The government established “State Councils for the Development of Civil Society,” but social accountability remains weak. There is no formal channel of communication or consultation with national government agencies on urban planning. Ukrainian residents are largely unaware of their public participation rights or are passive about attending public hearings. This is slowly starting to change, especially in Kyiv, which has had nearly 20 “bottom up” initiatives related to urban development policies. One of these initiatives includes opening the Kyiv General Plan, currently unavailable to the public, to input by the public. Civil society organizations are critical participants in nurturing, advocating, and facilitating public participation as provided for in the planning regulations. Further investment in information and advocacy campaigns is required in order to enhance the “demand” side of public participation and to achieve transparency of the information produced by government agencies. See Box 11 about the case of Detroit’s master plan. 123 Decree of the Cabinet of Ministers on Ensuring Public Participation in Formulation and Implementation of State Policy #996, 3 November 2010. 124 See Detroit Future City website at www.detroitfuturecity.com. 125 “Detroit Future City” 2012 Detroit City Strategic Framework Plan. CHAPTER 3 Urban Planning and Spatial Development Detroit was once the fourth-largest city in the United States, but by the 1990s, it had lost over 800,000 people from its 1960 peak. The city had hollowed-out industries, diminishing population, significant poverty, and high levels of abandoned housing. Detroit began only around 2008 to attempt to confront most of these challenges on a city-wide scale. Between 2010 and 2012, a new master plan, known as Detroit Future City, was prepared for Detroit. This was the city’s first master plan since the 1960s and one of the first master plans in the United States that openly acknowledged shrinkage as a central element of future city planning and policy. The plan’s development was funded by the Kresge Foundation, a Michigan philanthropy, and it was authored by a variety of national planning, engineering, and urban design consultants. The plan was issued in 2012 following a long public outreach and consultation process involving more than 3000 public meetings to gather feedback and ideas for the future of the city124 . Detroit Future City’s overall vision accepted Detroit’s loss of population, abandonment of housing and departure of industry, and the city’s smaller and different future economic structure. Upon its launch, Detroit’s plan was widely publicized and acclaimed throughout the United States125 . BOX 11: DETROIT (USA) MASTER PLAN 124 Ukraine_2015_nov26.indd 124 2015-11-26 5:14 PM
  • 147.
    17 126 House priceto income ratio is the ratio of median house prices to median annual disposable salary (after tax), expressed as years of income. Median house price and median salary are taken as average for the set of cities inside the country. For example, Ukraine is assessed on the basis of 16 cities, including all major oblast centers. Observations for Russia include 24 cities across the country, Poland 22 cities, and the USA around 240. In the case of Ukraine, a person with average income would have to save for 17 years in order to buy a house. CHAPTER 3 Urban Planning and Spatial Development III. Housing Market Consequences of Demographic Changes On Housing Ukraine’s housing market is characterized by very high homeownership rates, few rental options, and very minimal mortgage holding. Privatization following independence from the Soviet Union in 1991 generated a homeownership rate of over 94 percent by 2010 (See Figure 88 and Figure 89). At the same time, the supply of new rental properties – a valid affordable housing option for the young and for urban migrants – has been very limited. In addition, very few households are able to obtain mortgages, so must finance a housing acquisition through other means (i.e., savings, family loans – see Figure 90). In fact, most households with average income in Ukraine cannot afford to buy a dwelling. The price to income ratio126 stands at 16.8 in Ukraine, which is more than three times higher than Germany (See Figure 91). As a consequence of these conditions there is a substantial ‘grey market’ of undocumented rental arrangements featuring insecure landlord/tenancy rights as well as tax evasion. Figure 88– Dwelling stock by tenure status 2000-2009 Source: State Statistics Service of Ukraine 100 95 90 85 80 75 2000 2001 2002 2003 2004 2005 2006 2007 2008 2009 Private property State housing Employee housing Market rent 125 Ukraine_2015_nov26.indd 125 2015-11-26 5:14 PM
  • 148.
    CHAPTER 3 UrbanPlanning and Spatial Development Figure 89 – Dwelling stock by country Figure 90 – Level of mortgage penetration Source: Estimates from Living in Transition survey, European Bank for Reconstruction and Development and World Bank, 2010 Source: Estimations From Living in Transition Survey, 2010 126 Rented Owned Other Uzbekistan MacedoniaTajikistanKosovoUkraineMoldovaLithuania Azerbaijan KyrgyzstanRom aniaGeorgia SerbiaBulgaria KazakhstanCroatiaHungaryPolandSloveniaMongolia Montenegro LatviaFranceSweden GreatBritainTurkeyTurkeyGerm any RussiaSlovakiaBelarusEstonia Italy CzechRepublic Arm enia BosniaandHerzegovina 100% 90% 80% 70% 60% 50% 40% 30% 20% 10% 0% Purchased built with mortgage Privatized Cooperative Purchased built without mortgage Inherited Not stated 100% 90% 80% 70% 60% 50% 40% 30% 20% 10% 0% Uzbekistan Macedonia Tajikistan Kosovo Ukraine Moldova Lithuania Azerbaijan Kyrgyzstan Rom ania Georgia Serbia Bulgaria Kazakhstan Croatia Hungary Poland Slovenia Mongolia Montenegro Latvia France Sweden GreatBritain Turkey Albania Germ any Russia Slovakia Belarus Estonia Italy CzechRepublic Arm enia BosniaandHerzegovina Ukraine_2015_nov26.indd 126 2015-11-26 5:14 PM
  • 149.
    CHAPTER 3 UrbanPlanning and Spatial Development Figure 91 – House price to income ratio Source: Numbeo, 2011 Housing construction in Ukraine reflects the country’s demographic transition and regional urbanization trends – discussed in Chapter 1 of this report. There are relatively high levels of new housing construction in Western Ukraine, which had Ukraine’s lowest urbanization levels at independence in 1991. In 2010, the Western region’s leader by numbers of commissioned apartments was Ivano-Frankivsk Oblast, with 5,540 apartments, which could be a reflection of the very high Night Lights growth observed in this oblast. According to a recent housing market and mobility study carried out by the World Bank, in the last five years this Oblast was one of the top-5 oblasts in terms of the number of apartments put into operation per 1000 residents. Other oblasts of Western Ukraine also showed higher than average levels of housing construction per 1000 residents127 . Growth in the tourism sector and investments in recent years by Ukrainians working abroad spurred the housing construction activity. On the contrary, very low levels of housing construction were observed in the oblasts of Eastern Ukraine. In 2010 the number of new apartments built and occupied per 1000 residents was less than 0.63 (in Dnipropetrovsk Oblast. Although construction rates in bigger cities such as Donetsk, Kharkiv, and Dnipropetrovsk exceeded this average in 2010, they were lower than average in the West and, with the recent conflict are expected to drop drastically. Even during the construction boom of 2006-2008, the number of newly built apartments in these oblasts rarely was higher than 1 apartment per 1000 residents128 . The region’s sharp population decline and its existing high urbanization rates are likely the main causes of the low construction levels observed. As discussed in detail in Section 2 of Chapter 1, most cities and towns in the Eastern Region have been declining in population over the past two decades – a key factor for the substantial drop in housing demand. 127 Lviv – 1.77; Chernivtsi – 2.27; Ternopil – 2.23. The same goes for neighboring Khmelnitsky Oblast – 2.47. Bureau of Economic and Social Technologies, Housing Market and Labor Mobility, September 2011 (Research Report Prepared Under Contract for the World Bank). 128 Bureau of Economic and Social Technologies, Housing Market and Labor Mobility, September 2011 (Research Report Prepared Under Contract for the World Bank). 127 Housingpricetoincomeratio 25 20 15 10 5 0 UnitedStatesCanadaGerm anyBelgium UnitedKingdom AustriaIreland NetherlandsDenm arkPortugalFinlandSweden SpainSlovakia CzechRepublicFranceBulgaria Latvia GreeceEstoniaHungary ItalyPolandSloveniaArm enia RussiaMoldovaRom ania KazakhstanUkraineLithuaniaBelarus Ukraine_2015_nov26.indd 127 2015-11-26 5:14 PM
  • 150.
    CHAPTER 3 UrbanPlanning and Spatial Development The very high homeownership rate in Ukraine, among other factors, has prevented the widespread housing abandonment that characterizes typical shrinking cities in Europe and United States. As discussed in Chapter 1, people in Ukraine are not migrating internally at expected rates; this is due to a combination of factors: very high ownership rates; limited access to finance, which makes it difficult to finance moving costs; and an underdeveloped housing market. In addition, in places where economic opportunities have declined, households find it difficult to find suitors to buy their dwellings and are hesitant to leave; this is particularly true for older residents who are generally less eager to move and more dependent on pensions. As a result, people in Ukraine have a high tendency to stay behind in shrinking cities, despite declining economic opportunities. Under improved housing market conditions, households (labor) mobility would be expected to increase, leading to higher housing abandonment in economically declining cities. This dynamic has been observed in shrinking cities in other countries (e.g., Cleveland, Detroit, Leipzig). The quality and quantity of the multi-family housing stock is declining due to deferred maintenance and the cost of service provision.129 City housing agencies provide collective services (water, heat, and electricity) to the substantial stock of existing housing constructed prior to 1991130 . This housing stock consists of 19.3 million apartments, equivalent to 422 apartments per 1,000 residents. Here Ukraine lags just behind the EU-27 average (446 apartments) and is ahead of such countries as Poland (349), Slovakia (370), Romania (391), and Slovenia (410). As a result of de-population, the housing stock per 1,000 residents is likely to rise above the EU average (as discussed in the ‘built-up area’ analysis presented in Section 4 of Chapter 1). However, the quality of housing stock is much lower than the European norm. Three-quarters of all homes were built between 1945 and 1990 (See Table 15), and many of these have been poorly maintained. Necessary repairs on facilities such as roofs and elevators are often delayed or not undertaken; as a result most homeowners possess low-value properties in poor condition. Upkeep that will improve housing values and quality is often difficult due to the weak regulatory and enforcement environment relative to that ensured by the home-owners associations that are typical for multi-family residential buildings in Europe or the US. 129 Ibid. 130 Ibid, p. 12 131 Ibid. Table 15 – Age distribution of housing stock Year 1919 1919-1945 1946-1970 1971-1980 1981-1990 1991-2000 2000 Ukraine 2010 4.7 11.8 49.2 16.2 10.7 4.4 3 Estonia 2009 9.4 14.2 30 21.5 19.6 2 3.3 Latvia 2008 13.8 13.1 22.1 19.4 20.2 7 4.4 Austria 2009 15.2 8.2 28 15.2 11.5 13.6 8.3 Netherlands 2009 6.9 13.9 27 17 15.4 12 7.9 Sweden 2008 12.1 14.7 37 16.8 9.4 5.5 4.6 Portugal 2008 7.4 10 21.9 16.1 18.8 17.7 8.1 Source: Housing statistics in the EU (2010); state statistics service of Ukraine; calculations131 128 Ukraine_2015_nov26.indd 128 2015-11-26 5:14 PM
  • 151.
    CHAPTER 3 UrbanPlanning and Spatial Development Inefficient or non-functioning land registration and title systems in Ukraine hamper development of affordable housing. Land costs represent a substantial part of overall construction costs and thus affect the availability of affordable housing. The transaction cost to acquire land through purchase or by having land allocated for housing by local government is non-transparent and costly. According to the World Bank’s latest Doing Business report (2015), obtaining construction permits requires eight separate procedures, takes 64 days, and costs 10.2 percent of the warehouse value (one of the highest values in the region). Completing a property transfer requires seven separate procedures, takes 27 days, and costs 2 percent of the property value (one of the highest values in the region). Globally, Ukraine ranks 70th of the 189 economies assessed on the ease of dealing with construction permits and 59th on the ease of registering property132 . Out of all 25 million plots of land in the country, only about 12 million plots are in the cadaster. However, the cadaster does not contain information about plots that were registered before the Land Code came into effect in January 2002. Registration of titles for land parcels and buildings is done by two separate agencies. Registration of property rights for apartments, houses and other buildings is done by offices of the Bureau of Technical Inventory that are attached to local administrations. The register is kept by the Ministry of Justice. Registration of land parcel titles is done by local offices of the State Service of Geodesy, Cartography, and Cadastre (in 2015, this was merged into the State Agency of Land Resources and Cartography Agency). As a result, it may happen that a land plot is registered to more than one person, increasing the risk of legal disputes. Access to municipal land for construction purposes is possible in two ways – land auctions and non-competitively. Both come with their own specific challenges and costs, and an assessment of risks and profitability of investment is complicated. Consequently, investors are left uncertain about various characteristics of a land parcel such as transport access, engineering services and infrastructure, environmental conditions, and restrictions on land use. Incomplete urban planning documentation for most Ukrainian cities results in local government being unclear about the direction of development and the activities allowed on each land parcel.133 The absence of Master Plans and detailed zoning plans in some cities tends to make urban development more chaotic, increasing the risk of congestion in growing cities and the risk of vacancy and unsold housing stock in shrinking cities. New construction often takes place at the expense of preservation of open spaces and parks within cities since the extension of boundaries for growing cities involves a complicated planning process leading to disputes with cities and the raions. Brownfields re-development is also problematic as it involves a lengthy and costly process of change in the type of land-use as well as necessary decontamination measures. 132 World Bank, Doing Business 2015: Going Beyond Efficiency; Economy Profile 2015: Ukraine (Washington, DC: World Bank, 2014), available at http://www.doingbusiness.org/data/exploreeconomies/~/media/giawb/doing%20business/documents/profiles/country/UKR.pdf?ver=2 133 Housing Market and Labor Mobility 129 Ukraine_2015_nov26.indd 129 2015-11-26 5:14 PM
  • 152.
    CHAPTER 3 UrbanPlanning and Spatial Development IV. Planning as an Instrument for Managing City Growth And City Decline Planning for Dynamic Growth Cities that are experiencing growth in Ukraine are in theory allowed to extend their boundaries according to the mandate of a Master Plan rather than based on market demands; however, in practice the process is complicated and local authorities avoid shifting city boundaries, which has the stimulates uncontrolled urban sprawl. In theory, expanding city boundaries provides access to greenfield land that can be converted into high-density sub-markets under a state-driven planning structure that guides the type, location, and size of development. In reality, city municipal boundaries are fixed, but urban sprawl occurs nonetheless, extending development beyond the border of the city and making centralized planning efforts difficult. For instance, Kyiv’s boundaries were expanded in 1961 and again in 2001, yet they do not reflect the full extent of the city. City boundaries are a political designation, but growth is more efficiently accommodated when boundaries are based on transportation, employment, and housing needs. These challenges are present in many countries, especially former Soviet bloc countries. Some countries address the issue by creating functional or administrative agglomerations comprised of a city and its surrounding areas where urban sprawl is the densest. This notion of city-regions is growing in popularity among planners in Europe, but the approach has not reached Ukraine yet. Zoning is also not flexible or transparent so it is difficult to plan for growth beyond the boundaries of the Master Plan area, particularly in expanding sub-markets. Planning for growing sub-markets requires zoning that permits construction based on both current and future projections of demand. In practice, this “upper limit” of construction is often left flexible in zoning, so that cities can amend or permit variances to zoning that allow additional construction. In New York City, for instance, a shortage of land for additional construction of office space in mid-town Manhattan led the city to propose development and additional density there called the “Vanderbilt Corridor.” In the Ukrainian context, there are several growth corridors, but zoning is inflexible without clear reference to demand. Without strategic investment in infrastructure or services, growing cities accommodate new development in either existing areas or expand to the urban fringe. High land values in desirable areas of the existing city footprint drive up costs and often encourage over-development to recoup costs. On the other hand, lower land values on the periphery are driven up by the cost of extending services and infrastructure, resulting in sprawl. Further complicating development in Ukraine, many of the desirable sub-markets are historic areas with tight development controls including height restrictions. Growing cities, particularly Kyiv, should establish Master Plans that project a growing future city, but that also protects valued cultural and historic resources such as parkland, green-belts, and historic areas. The land-use pattern of these cities, particularly in their 20th century housing and commercial districts, is characterized by low density and can easily accommodate new development without the need to re-develop parkland or historic areas. The recent development pattern of Kyiv, for example, to favor skyscrapers, ignores the central city’s historic importance. An expanding economy also places pressure on existing housing by driving prices up, thus increasing the risk of displacement for low-income homeowners or renters, particularly in high-value, center-city areas. Local governments need to ensure housing strategies are in place at the local level to encourage private sector involvement in providing affordable housing. At the national level, planning reforms need to be put in place to promote the supply of affordable rental housing in the market. An expanding economy also places pressure on the transport system due to increases in jobs and in new commuters. The planning system must accommodate this increased pressure by constructing new transit lines and roadways. 130 Ukraine_2015_nov26.indd 130 2015-11-26 5:14 PM
  • 153.
    CHAPTER 3 UrbanPlanning and Spatial Development Planning for Shrinking Cities Many cities in Ukraine have demonstrated declines in many demographic areas yet are operating with Master Plans based on growth trends (See Box 12 for an example). Declining local economies have led to reduced demand for space and the abandonment of industrial, retail, and office parcels. Often, these abandoned parcels are extremely large, causing a large decline in the intensity of economic activity in the city. Gradually, over time, the footprint of the city begins to shrink or remains stable, creating a vicious cycle of population loss and declines in the quality of life. Unfortunately, a declining economy does not reduce the amount of infrastructure required for servicing remaining housing, manufacturing, office, and retail activities in the city. Ukraine’s planning legislation and strategic framework are based on expectations of growth rather than shrinking and redistribution. In a handful of growing cities, the processes of sub-division, zoning variances, and development permissions will continue to be needed. However, in most Ukrainian cities there are very few new residential structures and there is little demand for new industrial or commercial space. Indeed, in many cases, much of the existing commercial and residential space in the city lies vacant134 . Ukraine’s planning laws mandate a system that is fundamentally miss-aligned with the actual needs of the nation’s cities, which remain unable to shape their own planning priorities as well as those of private development actors. Citizens are inhibited from accessing or understanding important planning, zoning, and building information. Meanwhile, further reforms of the 2011 legislation have been slow to be implemented. Given these challenges, General Plans and Master Plans could incorporate new tools for managing decline and redistribution at both the national and city levels. These might include demolition of surplus industrial and dilapidated residential buildings, brownfield redevelopment, allotment of unused or unneeded land to stakeholders, zoning changes to enhance economic development of underused properties, and new spatial strategies that reflect the reduced need for housing and commerce in shrinking cities. Planning legislation should allow for differentiations in planning methodology to account for the mix of local growth and decline. For instance, in the United States, declining cities such as Youngstown, Ohio have revised zoning ordinances in order to convert underused industrial and commercial districts to park land, recreation areas, and natural spaces. This re-zoning was first proposed in the Youngstown 2010 Plan published in 2004135 . Such zoning changes, if they were implemented, would most likely concern the reuse of abandoned industrial areas, rather than housing due to the relative stability of Ukraine’s housing market. 134 Author’s interview of officials of the City Administration of Kherson, 17 December 2014. 135 See http://www.cityofyoungstownoh.com/about_youngstown/youngstown_2010/plan/plan.aspx The Master Plan for Kherson projects recreational areas along the Dnipro waterfront. According to some Kherson planners interviewed for this study, the plan is “not realistic; it does not depict the city’s actual condition.” Overall, Kherson planners regarded both the city’s development condition, and the city’s planning condition, as “frozen”. Development was very limited due to the city’s economic decline and Ukraine’s overall political problems. At the same time, it was difficult to adjust planning norms such as the General Plan or zoning plans to reflect these conditions because of the centralized nature of Ukraine planning. BOX 12: DISCONNECT BETWEEN REALITY AND PLAN 131 Ukraine_2015_nov26.indd 131 2015-11-26 5:14 PM
  • 154.
    CHAPTER 3 UrbanPlanning and Spatial Development Shrinking cities in Ukraine face numerous spatial planning challenges, such as: • Urban decline places pressure on the planning system to project new activities for abandoned or underused areas. This requires entrepreneurial action on the part of planning departments to project and attract new economic activities. • Abandonment requires the re-tooling of Master Plans to accommodate changed or declining activities. • Urban decline may also require projecting a shrunken or changed urban footprint. This is an activity that is unfamiliar to most urban planners and is not part of conventional urban planning practice. • Maintenance of existing infrastructure is expensive and difficult. Projecting reductions of infrastructure proportionate to the reduction of both residents and economic activities may be a necessity, placing additional demands on the urban planning system. Approaches to address shrinking cities differ internationally. While some cities plan to stem decline through incentives and investments, others focus on reducing urban footprints and increasing existing efficiencies. Urban planning plays an important and facilitative role for both approaches towards stabilization or growth. While the World Development Report (WDR) of 2009 takes a particular development view towards cities that have no hope for resurrecting economic activity, there is evidence that Local Economic Development efforts – where a city’s economic strengths, weaknesses, opportunities, and threats are first evaluated and then used as a basis to re-invent a city’s economic potential and development path – have led to the successful comeback of some cities (Dresden being a good example). New master plans geared for shrinking cities can project alternative land uses for underused industrial or commercial areas, including recreational or natural spaces. Community participation can help identify “bottom-up” opinions or interest in uses for underutilized spaces, and these opinions can be incorporated into General Plans. Zoning can be revised to permit a wider range of uses or to remove restrictions on properties that prevent their being re-purposed for alternative land uses. Ukrainian policy makers may need to look internationally to find suitable planning models to develop policies for the country’s shrinking cities. Germany provides an interesting model for future planning in Ukraine (See Box 13). Like Ukraine, Germany has a tradition of state involvement in urban planning, but it has a much stronger economy and a tradition of government transparency and citizen participation in planning decisions. Ukraine lacks these three latter factors. The USA model of urban planning, however, is not necessarily appropriate either. The US has extremely decentralized planning and a tradition of citizen participation in governance – both of which Ukraine lacks. Ukrainian cities also have large-scale problems like deindustrialization that are better solved by state policies at the national and regional level than they are by policies at the local level as in the United States. Ultimately, Ukraine will not be able to “copy” any country’s planning system wholesale; reform of planning will have to accommodate those qualities of Ukrainian governance that stem from the country’s history, while also accommodating concepts of governmental transparency and citizen participation that are less familiar to public officials and citizens of Ukraine. 132 Ukraine_2015_nov26.indd 132 2015-11-26 5:14 PM
  • 155.
    CHAPTER 3 UrbanPlanning and Spatial Development German reunification in 1990 catalyzed a substantial series of capital projects to reunify and rebuild the country. To date, the population of the area of the former East Germany has decreased by 12 percent, with nine percent of that decrease occurring during or after reunification in the 1990s.136 A national policy strategy came in 2001 in the form of Stadtumbau Ost (Urban Renewal/Restructuring East), a 2.5 billion euro initiative in six former East German states. In effect from 2002 to 2009 (and subsequently extended by the Länder for a second period to 2016), the initiative had a two-fold mission: 1) stabilizing the housing market by tearing down abandoned or underutilized buildings, and 2) upgrading inner-city districts, modernizing living conditions, and improving social infrastructure137 . The overall goal of Stadtumbau Ost was to remove 350,000 unoccupied houses in order to stabilize the real estate market as well as attract private investment through redevelopment based on new housing construction (220,000 homes were demolished by 2007)138 . The global economic crisis of 2008 caused more shrinkage, so Stadtumbau Ost proposed the demolition of nearly 350,000 more homes by 2016, the majority of which (217,000) were demolished after the formal conclusion of the program in 2009139 . The Bund and Länder also spent 320 million euros to upgrade districts in urban centers through the adaptation of urban infrastructure, modernization or demolition of vacant commercial buildings, maintenance of historic buildings, and overall efforts to modernize living conditions. In 2004 the Bund launched Stadtumbau West in areas of the former West Germany as a companion to Stadtumbau Ost. Between 2004 and 2008, the Bund, Länder, and city/local municipalities each invested one- third of a total of 738 million euros140 spread across 300 cities141 . For both Stadtumbau Ost and West, cities and regions were required to generate spatial plans in order to project visions for the future of the areas benefiting from the program. Many of these urban plans were recognized as innovative and attained worldwide visibility as a result of the involvement of leading architects and urban planners in their formulation142 . 136 Pallagst, Karina, Thorsten Wiechmann and Cristina Martinez-Fernandez, eds., Shrinking Cities: International Perspectives and Policy Implications (New York, NY: Routledge, 2014); Werz 2001, Abwanderung. 137 Shrinking Cities (2014); Urban Regeneration. 138 Ibid; Glock, Birgit, and Hartmut Häussermann, “New trends in urban development and public policy in eastern Germany: dealing with the vacant housing problem at the local level,” International Journal of Urban and Regional Research, Volume 28, Issue 4, pp. 919–929, December 2004. 139 Goethe Institut 2009, Making Shrinking Cities. 140 An additional 76 million euros was allocated to the initiative in 2009. 141 Ibid. 142 International Building Exhibition Urban Redevelopment Saxony-Anhalt 2010: Less Is Future (Jovis: 2010). BOX 13: NATIONAL LEVEL SPATIAL POLICY: STADTUMBAU OST AND WEST (GERMANY) 133 Ukraine_2015_nov26.indd 133 2015-11-26 5:14 PM
  • 156.
  • 157.
    135 CHAPTER 4 Impact ofthe Current Conflict on the Urban System Ukraine_2015_nov26.indd 135 2015-11-26 5:14 PM
  • 158.
    143 This sectionis based on and summarizes findings of the Eastern Ukraine Recovery and Peacebuilding Assessment (RPA). See World Bank, RPA: Analysis of Crisis Impacts and Needs in Eastern Ukraine: Synthesis Report (World Bank Group), March 2015, available at http://www-wds. worldbank.org/external/default/WDSContentServer/WDSP/IB/2015/05/14/090224b082e84fea/1_0/Rendered/PDF/Synthesis0report.pdf 144 In March 2014, the Autonomous Republic of Crimea and the city of Sevastopol held referenda to join the Russian Federation, which were widely criticized and declared as having no validity in the UN General Assembly resolution 63/262 The UUR was initiated prior to the ongoing conflict in Ukraine. Even though events related to the conflict are not reflected in the analysis undertaken for the UUR – due to the limitation of data sets from 1998 to 2013, the unavailability of recent and reliable data from the conflict areas, and the continuously evolving and changing characteristics of the crisis – the conflict is expected to impact the urban system in the country. To that end, the following discussion, drawing on the recent Eastern Ukraine Recovery and Peacebuilding Assessment, concerns recent events in Ukraine. The Current Conflict Ukraine’s ongoing conflict has had a huge impact on human welfare and social and economic conditions in the East. The current conflict commenced with a political crisis that started in late 2013, followed by the referenda in Crimea in March 2014144 , and an intensifying conflict in Eastern Ukraine focused on the areas of Donetsk and Luhansk. In late 2014, the European Union, the United Nations, and the World Bank, under the leadership and participation of the Government of Ukraine, commenced the Eastern Ukraine Recovery and Peacebuilding Assessment (RPA). It was finalized in March 2015 and informs this present section. The conflict has resulted in a significant number of displaced people. The RPA found that, as of February 2015, there have been 7,000 deaths, some 18,000 wounded, and over 1.6 million people displaced both internally and outside of Ukraine. Around 1 million persons are registered as internally displaced and another 640,000 have taken refuge in other countries, many in the Russian Federation. Out of the 5.2 million people that resided in conflict-affected regions prior to the conflict, at least 3.9 million have been directly affected by the conflict. Initially, the majority of the displaced were women and children. As the conflict deepened, the demographic profile of internally displaced people (IDPs) broadened to also include older and disabled residents. Figure 93 shows displacement as of February 2015. The displacement intensified as a result of a Government of Ukraine resolution to halt services in areas not controlled by the government. Government decree 875/2014 issued in mid-November 2014 closed all Government offices in areas outside the Government’s control, halting funding of pensions, social benefits, and other services while also withdrawing support to schools and hospitals. Offices of Ukraine’s Central Bank also closed, limiting access to cash and banking services. Pension and social payments are now only available to persons with registered residences in Government- controlled territory. This withdrawal of financial services and resources to Government-supported institutions deepened vulnerability and prompted outflows of some of the Donbas region’s most vulnerable residents. There are indications, for example, of extraordinary numbers of pensioners leaving areas outside of Government control in December 2014-January 2015 and registering as IDPs in Government-controlled areas. The majority of the displaced population seems to be concentrated in the areas close to the line of conflict. Over 96% of IDPs originated from the oblasts of Luhansk and Donetsk. Of these, 75% sought refuge in host communities within the five eastern oblasts. 49% of IDPs stayed within Luhansk and Donetsk, swelling the population of conflict-affected host communities nearest to the fighting. This is reported to be a typical movement pattern for IDPs, reflecting a desire to achieve greater physical safety, while remaining within a reasonable distance of home, relatives, property, and former livelihoods. The result is a concentration of the displaced into host areas that are poorly prepared to receive them; some cities host IDP populations that exceed by several times their original populations (See Figure 92). CHAPTER 4 Impact of the Current Conflict on the Urban System143 136 Ukraine_2015_nov26.indd 136 2015-11-26 5:14 PM
  • 159.
    Figure 92 –Conflict and displacement in Eastern Ukraine (as of February 2015) Source: Eastern Ukraine Recovery and Peacebuilding Assessment (RPA) February 2015 The displaced bear the intense human and personal cost of the conflict; however, IDPs also create a significant strain on local communities, services, and financing. Among other effects are a downward pressure on wages, and an upward pressure on food prices. The RPA found that health facilities and classrooms are oversubscribed in many areas and community services such as elderly care, child care, recreation services, and sanitation services have been affected as resource-poor authorities redirect their budgets to the immediate needs of IDPs. This fuels social fragmentation in host areas, further complicating the effects of the conflict. The majority of the displaced in Ukraine have moved at least twice in the course of their displacement, while one-third of IDPs have moved three or more times. While repeat movements are typically driven by a search for secure, adequate, and reasonably priced accommodation, they should be understood as disruptive episodes in the lives of the displaced as they search for improved circumstances. IDP movements are driven by a variety of factors, such as the depletion of personal capital; limited access to services and assistance in new and unfamiliar areas; disinclination of landlords to rent to IDPs; loss of the ability of host families and family members to provide support; and the search for employment opportunities. However, many of the displaced have worked in the industrialized Eastern regions and have labor skills that are in less demand in the Central and Eastern regions. Repeated dislocations due to renewed physical safety concerns are also common as many of the displaced, seeking to remain near home areas, have had to flee repeatedly due to heavy fighting nearby. CHAPTER 4 Impact of the Current Conflict on the Urban System 137 Ukraine_2015_nov26.indd 137 2015-11-26 5:14 PM
  • 160.
    145 World Bankestimations 146 Recovery and peace building assessment : analysis of crisis impacts and needs in Eastern Ukraine (Vol. 2): Full component reports (World Bank Group), March 2015, available at http://documents.worldbank.org/curated/en/2015/05/24487461/recovery-peace-buiding-assessment- analysis-crisis-impacts-needs-eastern-ukraine-vol-2-full-component-reports The effect of the conflict on the local regional economy and the economy of Ukraine at large is significant. As the Donbas region historically contributed approximately 16% to the GDP and 25% to Ukrainian exports, the conflict in the East has had significant economic implications for the whole country. Trade disputes with Russia have further damaged the Ukrainian economy. Ukraine’s real GDP is expected to decrease by 8% in 2014 and is forecast to contract by a further 7.5% in 2015,145 while the exchange rate has heavily depreciated since early 2014. Over the same period registered unemployment has increased from 7.7% to 9.3% while employment opportunities are estimated to have decreased by 2 million. This is due to the fact that nearly 80% of the formal economy in Donetsk and Luhansk regions is not operational, resulting in decline of industrial production in the regions of 60% and 85%, respectively. However, the economic spillover of the conflict extends to the entire country. The Urban System Following the Conflict At the time of this report, the conflict continues to evolve; its long-term impact on both population movement and the economy at large remains to be seen. The joint assessment sees the situation in the East as likely to remain volatile and fluid for some time. To date, the RPA146 assesses total damages to infrastructure and social services estimated at around USD 463 million. Damages to the transport and energy sectors constitute the bulk of the impact. Further, there are losses that have been incurred in various sub-sectors, but not fully quantified yet relating to diminished output capacity, increased production costs, the inability to efficiently transmit and deliver services as a result of infrastructure damage, and reduced ability of consumers to pay for services already received. Total recovery needs for infrastructure and social services are estimated by the RPA at around USD 1.3 billion. Needs are greatest in the transport, social welfare, and health sectors at USD 558m, USD 329m, and USD 184m, respectively. Needs estimates are built upon the damages reported to infrastructure and the reconstruction of impacted infrastructure to improved standards; the restoration of service delivery to individuals residing in Donetsk and Luhansk and replacement of facilities; and the provision of social services to individuals displaced as a result of the conflict (IDPs). To contain the developmental impacts of displacement and leverage the skills and presence of the displaced for more positive outcomes for all, the RPA recognizes four key challenges: (i) delivery of services such as security, education, health, and social payments along with basic infrastructure in equal measure to the displaced and host populations, (ii) the displaced (re)gaining control of land and property, (iii) reestablishing livelihoods and social bonds that are disrupted by forced displacement and conflict and (iv) accountable and responsive governance and rule of law at the local level. These are the barriers to durable solutions for Ukraine’s internally displaced – and they are, at the same time, critical development challenges for the entire population of Ukraine. This approach is premised on the continuation of the IDP crisis for the foreseeable future and the associated strains that such population movements place on state finances, service delivery mechanisms, governance, and social cohesion. Once conditions allow, the restoration of infrastructure and services in conflict-affected areas should reflect the new realities of geographic distribution of people and production. Even prior to the conflict, the area had largely obsolete and inefficient heavy industries, many of which were in decline. The area was a recipient of targeted central fiscal transfers (subsidies) and there was accumulation of wage arrears. Post-conflict rebuilding of assets should be guided by the expected numbers of returnees and should focus on restoring institutions, rule of law, and social cohesion as well as basic services for the population. This will ensure that people who choose to return and remain will have their basic needs met, and not be pushed out by the lack of schools, health services, and public security. Connectivity to the rest of the country CHAPTER 4 Impact of the Current Conflict on the Urban System 138 Ukraine_2015_nov26.indd 138 2015-11-26 5:14 PM
  • 161.
    will be especiallyimportant to ensure re-integration of the conflict-affected areas. The UUR suggests that even in areas not affected by the conflict, push factors rather than pull factors seemed to underpin internal migration. The conflict has further reinforced the push factors. The interplay of push and pull factors in Ukraine needs to be further analyzed. A first step in this direction would be to carry out a new census since the last census was taken in 2001. A set of public policies aimed to ease mobility (such as further developing the housing and rental markets) would benefit economic integration. One consequence of improved mobility could be that shrinking cities will shrink even faster, but the desired objective would be a set of conditions where people are pulled to cities with emerging economic opportunities. This will then permit the urban system to achieve its full potential as Ukraine’s engine of growth. While some of the UUR’s findings related to individual cities may change as a result of population movements wrought by the ongoing conflict, its findings on trends, challenges, and opportunities for the urban system in Ukraine remain. Most cities, in the short- and medium-term, will probably continue to loose population. However, several cities in Ukraine – in particular those close to the largest urban centers – are growing, albeit slowly, and will continue to attract people in search for opportunities. This presents a dual challenge: city administrators, including planners, need to manage for urban expansion in the country’s population growth centers while local governments of urban centers affected by population decline need to adapt their city strategies to reflect new demographic and economic realities associated with shrinking. Reforms should underpin a realignment of fiscal resources across cities and other local governments, and provide better incentives to local governments for efficient fiscal management and improved urban services. In declining cities local authorities will need to re-assess how infrastructure is planned and maintained, and the way services are financed and delivered. Neighborhoods may need to be consolidated as cities lose density. Public service plans, designed for a larger population, may have to be re-considered to address lower demand. Many cities around the globe have successfully transitioned through periods of demographic decline and the main lesson is that, while challenging, opportunities exist for declining cities. If managed well, cities can “shrink better,” i.e., consolidate their urban footprint, emerge greener through the conversion of brownfields to green public spaces, and so on. In addition, an aging urban population has consequences for the demand for and the type of housing (e.g., long-term care facilities), the demand for public transportation (as elderly tend to commute less), and other basic services. Further, the combination of an overall aging urban population and declining fertility rates will also likely shift demand from education to health services. Urban areas will therefore need to adapt their social and physical infrastructure to better serve the changing needs and demands of their population. Simultaneously, growing urban centers need to be supported by a set of public policies that further foster economic growth. The majority of population growth observed in Ukraine is concentrated on the outskirts of main urban centers, such as Kyiv and Lviv, which are core elements of larger urban agglomerations. As discussed in Chapter 1, one of the key findings of the UUR is that agglomerations are particularly important engines of economic growth in the country. However, growth centers, as observed in many countries, can experience setbacks associated with congestion costs; traffic congestion, a shortage of infrastructure, and environmental pollution can increase as cities become larger and denser if growth is not properly managed. Making agglomeration economies work in Ukrainian growth centers will require a set of instruments that span institutional, administrative, and sometimes geographic boundaries. Infrastructure will need to be adapted to ensure that newcomers are well-absorbed and integrated into the city. This is particularly challenging in the case of public transport, particularly where the functional urban footprint expands beyond administrative boundaries – as is the case in most major urban centers in Ukraine. The introduction of metropolitan governance mechanisms might be needed to effect coordination in urban areas that have expanded into multiple administrative units. In addition, Ukraine’s growing cities need to better manage their peri-urban growth to avoid sprawled development and facilitate in-fill development options (e.g., brownfield re-development), while ensuring that sufficient green and public space is available. Finally, despite growth in their populations, Ukrainian growth centers will also experience aging of their populations, which will require local governments to reshape their services in order to meet the changing needs of their population. CHAPTER 4 Impact of the Current Conflict on the Urban System 139 Ukraine_2015_nov26.indd 139 2015-11-26 5:14 PM
  • 162.
  • 163.
  • 164.
    Annex I Special EconomicZones Special Economic Zones (SEZ) were established in Ukraine in order to overcome the crisis that the country faced during the post-soviet era in the 1990s. The deep crisis of the coal industry, the country’s hyperinflation in the 1994 and complications faced during the privatization of public enterprises led to a situation in which a great level of investment was needed to re-boost economic activity. Two types of SEZ were approved in 1998: (i) Free Economic Zones (FEZ), defined as SEZ in which companies are taxed very lightly or not at all, and (ii) Territories of priority development (TPD) which are SEZ designated in distressed regions. The benefits of the SEZ included the exemption from VAT taxes, subsidies and financial grants for companies installed. A total of 12 FEZ and 9 TPD were established between 1998 and 2005, when the government eliminated them. During their existence, SEZ attracted numerous investments, mostly from Ukrainian residents and offshore jurisdictions. Tax incentives created opportunities for corruption and rent seeking activities, opening the way for oligarchs to establish and own much of the economic activity in these priority regions and cities. The revenue costs and budget were seldom transparent, and they proved not to be a good system for promoting foreign investment in new local enterprises. Moreover, these zones often distorted local and regional competition and led to mechanical relocation of production facilities to designated areas rather than creation of new companies. Additionally, Ukraine was in the process of entering the WTO, and it failed at being compelling in this process in at least three aspects: first, import duties were not collected when goods manufactured in free economic zones were sold outside of them, but inside the Ukrainian territory; second, preference to investment projects that promised to procure Ukrainian-made goods contradicted the WTO Agreement on Trade Related Investment Measures (TRIMS); third, direct tax incentives could be interpreted as discriminatory protection against imports, and deterrence for foreign investment. This led to the cancellation of the SEZ in 2005. Ukraine joined the WTO shortly after. The total investment attracted during the existence of these incentives was 1.5 billion US$ from Ukraine residents and 600 million US$ from foreigner investors. Currently, there is debate about the negative consequences of SEZ discontinuing, especially the impact on the investors in those zones, and their potential reopening with stricter conditions. ANNEX I Special Economic Zones 142 Ukraine_2015_nov26.indd 142 2015-11-26 5:14 PM
  • 165.
    Figure 1 –Special economic zones Ukraine (1998-2005) Sources: Violeta Skrypnykova, Channels of Corruption in Establishment of Special Economic Zones in Ukraine Ondrej Klipa | Ph.D. Candidate, Charles University, the Czech Republic| Issue 2, 2005, Problem Of The Special Economic Zones Within The Ukrainian Economy And Politics Mark Davis, The World Bank, The debate on Elimination of Free Enterprise Zones in Ukraine, December 12, 2005 ANNEX I Special Economic Zones ! ! ! ! ! ! ! ! ! ! !! ! ! !! !!! ! ! ! ! ! ! ! ! ! ! ! ! ! ! ! !! ! ! ! ! ! ! ! ! ! ! ! ! ! ! ! ! ! ! ! ! ROMANIA RUSSIAN FEDERATION BELARUS POLAND MOLDOVA BULGARIA SERBIA HUNGARY SLOVAK REPUBLIC Kyiv Lviv Sumy Odessa Kharkiv Volyn Poltava Rivne Chernihiv Zhytomyr Luhansk Crimea Kherson Vinnytsya Cherkasy Mykolaiv Kirovohrad Dnipropetrovsk Zaporizhzhia Ternopil Khmelnytskyi Ivano-Frankivsk Zakarpat Chernivtsi Kyiv City Sevastopol Donetsk Kyiv Lviv Sumy Odessa Kharkiv Volyn Poltava Rivne Chernihiv Zhytomyr Luhansk Crimea Kherson Vinnytsya Cherkasy Mykolaiv Kirovohrad Dnipropetrovsk Zaporizhzhia Ternopil Khmelnytskyi Ivano-Frankivsk Zakarpat Chernivtsi Kyiv City Sevastopol Donetsk Novovolynsk Zhovtneve K olynsky Y K Novovolynsk Zhovtneve K olynsky Y K T s Kovel R T s Kovel R ! ! ! ! ! ! ! ! ! ! ! ! ! ! !!! ! ! ! ! ! ! ! ! ! ! ! ! P K Y TK P K Y TK DonetskDonetsk ! ! s s s ! K 143 Ukraine_2015_nov26.indd 143 2015-11-26 5:14 PM
  • 166.
    ANNEXES Region Sector lq2010lq2000 Western region Agriculture, hunting and forestry. Fishing 1.33 1.21 Industry 0.77 0.81 Construction 1.12 1.01 Trade; repair of motor vehicles, household goods and personal use. Hotels and restaurants 0.92 0.91 Transport, storage and communication 0.84 0.85 Finance 0.72 0.85 Real Estate 0.64 0.64 Public Administration 0.96 0.89 Education 1.15 1.13 Health care 1.06 1.03 Other community and personal services; activities in the field of culture and sports 1.17 1.20 Eastern region Finance 0.79 0.81 Other community and personal services; activities in the field of culture and sports 0.90 0.95 Public Administration 0.78 0.86 Construction 1.05 1.00 Real Estate 0.97 1.02 Health care 0.91 0.90 Transport, storage and communication 1.03 1.03 Education 0.85 0.85 Agriculture, hunting and forestry. Fishing 0.65 0.60 Industry 1.43 1.40 Trade; repair of motor vehicles, household goods and personal use. Hotels and restaurants 1.08 1.15 Annex II Location Quotient ANNEX II Location Quotient 144 Ukraine_2015_nov26.indd 144 2015-11-26 5:14 PM
  • 167.
    Region Sector lq2010lq2000 Central region Finance 1.44 1.24 Other community and personal services; activities in the field of culture and sports 0.94 0.95 Construction 0.98 1.00 Health care 1.02 1.02 Transport, storage and communication 1.02 0.98 Real Estate 1.29 1.19 Public Administration 1.24 1.14 Education 1.03 1.06 Industry 0.86 0.86 Agriculture, hunting and forestry. Fishing 0.97 1.08 Trade; repair of motor vehicles, household goods and personal use. Hotels and restaurants 0.95 0.95 Southern region Finance 0.91 1.01 Other community and personal services; activities in the field of culture and sports 1.01 0.93 Construction 0.89 0.99 Real Estate 1.00 1.06 Public Administration 0.94 1.05 Health care 1.00 1.04 Transport, storage and communication 1.09 1.11 Education 0.96 0.96 Agriculture, hunting and forestry. Fishing 0.94 0.98 Industry 1.01 0.98 Trade; repair of motor vehicles, household goods and personal use. Hotels and restaurants 1.06 1.00 ANNEX II Location Quotient 145 Ukraine_2015_nov26.indd 145 2015-11-26 5:14 PM
  • 168.
    Annex III Methodological AnnexUsing NL Data as a Proxy for Economic Activity Night-time lights and economic activity. In a series of articles, Henderson, Soreygard and Weil147 have developed a methodology based on the finding that there is a strong empirical connection between economic activity and the intensity level of night lights observed by satellites. This can be an important complement to official GDP data particularly when countries have poor national income accounts. In some cases it can even be used as a replacement or proxy for GDP data. For example, data on NLs is often readily available at arbitrary granularity levels, while GDP official data is rarely collected at a level of disaggregation finer than the first subnational division. In this case, night light information can help draw conclusions about the behavior of economic activity at these smaller geographical levels such as metropolitan areas or municipalities. NLs also allow for the estimation of economic activity at supranational levels. Several applications of NLs have been produce, including those found in the World Bank 2014 SAR Urbanization Flagship report. Having an interest in regional dynamics in this review, NLs are a particularly useful tool. As a reassurance that Ukraine follows the same patterns shown in the literature for other countries and regions, this appendix provides regression analyses of the statistical link between night lights and GDP for Ukraine at the Oblast level in absolute, growth, and per capita levels. A significant positive relationship is ofund between nightlights and economic activity variables using panel data from the 24 Oblasts in Ukraine, the Autonomous Republic of Crimea, Kiev City and Sebastopol for the years 2004- 2008 (2000-2008 when using gross value added instead of gross regional product as a robustness test). Oblast level consumer price indices were used to express economic activity variables in real terms (in 2002 Hryvnias). Correlation between night lights intensity and levels of real Gross Value Added (GVA). Regression Table 1 shows a positive statistically significant relationship with (GVA), with a robust estimated elasticity of GDP with respect to lights of around 0.8. The R-squared numbers support the validity of the relationship. The model specification in column (2) introduces electricity production, which has a positive significant effect in economic activity. The significance of night lights remains, but is reduced by the inclusion of electricity, which suggests that electricity production is an important part of the transmission mechanism which links lights to economic activity, but is not the only one148 . Finally, the results in column (3) include year dummies. The effect of night lights remains significant, supporting that our results are not driven by time trends. As a robustness test, results calculated using Gross Value Added (GVA) are included in table 2. As expected, results are reproduced with slight differences in magnitude. Both tables use robust standard errors to take into account for possible correlation between observations in the same Oblast. 147 Henderson et al. (2009) develop a theoretical model that suggests an optimal way to combine night lights data and available GDP. This is based on the idea that both pieces of information can present measurement error, but that there is no reason for us to think that these errors will be correlated with each other. Henderson et al. (2011) apply this to a sample of 170 countries, while Henderson et al., (2012) further develops the intuition by providing additional examples of how night lights readings react to documented economic and social phenomena, and estimate a model that focuses on night lights density. 148 Other studies like the 2014 SAR Urbanization Flagship report and Henderson et al., (2012) show electricity consumption has a much higher correlation. Electricity consumption data available at the disaggregation level required for a similar analysis is not available for Ukraine. ANNEX III Methodological Annex Using NL Data as a Proxy for Economic Activity 146 Ukraine_2015_nov26.indd 146 2015-11-26 5:14 PM
  • 169.
    (1) (2) (3) Log(Night lights) 0.823*** 0.694*** 0.851*** (0.0496) (0.0806) (0.0753) 2005 -0.0920 (0.149) 2006 0.153 (0.149) 2007 0.230 (0.149) 2008 0.219 (0.149) Log(Electricity Output) 0.0800*** (0.0277) Constant -0.278 0.591 -0.691 (0.586) (0.771) (0.866) Observations 135 135 135 R-squared 0.473 0.507 0.501 Table 1 – Correlations with Log of real GVA Robust standard errors in parentheses *** p0.01, ** p0.05, * p0.1 The estimating equations are: ln(Yit)=β0+β1 ln(NLit)+Ɛit where i is an index for Oblasts, t is an index for time, ε is the estimation error. β1 is the parameter of interest. Because our regression is run in logarithms, its estimated value is an estimation of the elasticity. Y is a measurement of economic performance for Oblast I at time t. In our different regressions specifications gross regional product (GRP), GRP per capita, and gross value added (GVA) are used as dependent variable Y149 . 149 In some specifications, which are shown in the results tables, electricity consumption is added to the estimation equation as a control. ANNEX III Methodological Annex Using NL Data as a Proxy for Economic Activity 147 Ukraine_2015_nov26.indd 147 2015-11-26 5:14 PM
  • 170.
    Correlation between thegrowth of night-time light intensity, and GVA growth. Additionally, a regression specification is estimated that uses the growth of the logarithms across time instead of the levels. The regression in those cases is: Δln(Yit)=β0+β1 Δln(NLit)+Ɛit The results in columns (1) and (2) in Table 2 show that there is not a statistically significant positive relationship between the growth in the intensity of a country’s night-time lights and its growth of real GRP. Growth is calculated for 4 years periods. The same results are obtained when year by year growth rates are used. (1) 0.102 Δ log(Night Lights) (0.0637) Δ log(Electric Output) 0.0373 (0.0546) Constant 0.888*** (0.0165) Observations 54 R-squared 0.066 Number of code Correlation between “URBAN” night lights intensity and levels of real GDP. Gross Value Added (GVA) data is available by sector for the years 2001-2002. The sectors can be divided into those are typically urban and sectors that are typically rural according to the following classification: agriculture, hunting, forestry, fishing, fish farming in the rural production, and industry, construction, trade, repair of motor vehicles, household goods and personal goods, hotels and restaurants, transport and communication, financial activities, real estate, lease, and engineering. Using this division, measurements of aggregate urban and rural GVA can be constructed. It is necessary to separate urban and rural GVA, even if it is done at an Oblast level, because the relationship between each of these two categories and night lights intensity are fundamentally different. In particular, urban production is expected to be more strongly linked to night light intensity. Also, given that the interest here is in using NLs to infer economic activity at the city level, it is more accurate to estimate the relationship between the average urban production in the Oblast (as opposed to total) and the night lights classified as urban. The tables below do just that for both levels and growth rates. Table 2 – Correlation between growth of Log of real GRP and growth of Log of night lights Robust standard errors in parentheses *** p0.01, ** p0.05, * p0.1 ANNEX III Methodological Annex Using NL Data as a Proxy for Economic Activity 148 Ukraine_2015_nov26.indd 148 2015-11-26 5:14 PM
  • 171.
    (1) (2) (3) luntl0.791*** 0.751*** 0.790*** (0.0564) (0.0685) (0.0401) 2003.year 0.120 (0.124) 2004.year 0.240* (0.124) 2005.year 0.147 (0.125) 2006.year 0.235* (0.124) 2007.year 0.417*** (0.124) 2008.year 0.338*** (0.124) lelec 0.0296* (0.0165) Constant 0.593 0.775 0.391 (0.547) (0.593) (0.412) Observations 189 189 189 R-squared 0.667 0.670 0.692 Table 3 - Correlations with Log of real urban GVA and Log of urban night lights A significant positive relationship is obtained as expected. It is in fact quite similar to what was obtained when the aggregate night lights for both urban and rural were used, confirming the robustness of the results. Tables 4 show results for growth rates of the logs. Growth is calculated as the total change between 3 year periods. This reduces the effect of noise. As opposed to the results that use aggregate GVA and lights, here, the growth of urban lights is positively and significantly correlated with the growth of urban GVA. ANNEX III Methodological Annex Using NL Data as a Proxy for Economic Activity 149 Ukraine_2015_nov26.indd 149 2015-11-26 5:14 PM
  • 172.
    (1) (2) Δ (NightLights) 0.404*** 0.390*** (0.0921) (0.0955) Δ( Electric output) 0.0182 (0.0223) Constant 0.192*** 0.191*** (0.0117) (0.0123) Observations 54 54 R-squared 0.260 0.266 Table 4 - Correlations with growth of Log of real urban GVA and growth of Log of urban night Robust standard errors in parentheses *** p0.01, ** p0.05, * p0.1 Heterogeneity in interregional variation between night lights intensity and economic activity. In Bickenbach et al (2013) data on Brazil, India, United States and some countries in Western Europe are used to show that the relationship between economic activity and night lights is not stable when looking at subnational or regional units. As a consequence, conclusions drawn about the differences between cities in different regions based solely on night lights are less reliable than comparisons for a single city across time. In the following table, results are presented for regressions that use interactions with a dummy for regions. The elasticity between economic activity and nigh lights is, by this construction, allowed to be different across regions. In table 4, Region 1 refers to the Western, region 2 to the Eastern region, region 3 to the Central region, and region 4 to the Southern region (omitted category). The first two columns show a model that uses total (urban and rural) economic activity and night lights. The second column shows that the interaction with regional dummies is significant, which implies a varying elasticity . These regional effects are significant and show that, all else equal, the region where a city is located affects how much light it emits even at similar economic activity levels. This is also true when considering only urban economic activity and lights in columns 3 and 4. The regional effects are significant for the Western region, i.e. for similar levels of night lights, economic activity is lower in the East (when compared to the missed category (Southern)). The contrast is more important in the regressions that use urban variables, in which both the Western and the Central regions present this trend. This explains statistically why the large growth in lights in these two regions is not necessarily accompanied by a large growth in economic. The economic reason behind this might be more complex, but the differences in the movements from urban to rural as well as the initial conditions (the East being initially much more urban and industrial in nature while Central region being more service oriented) are candidate explanations. Finally, joint tests that compare the elasticities between regions conclude that they are statistically different. 150 The elasticity in this case is given by the coefficient on the night lights independent variable plus the coefficient on the interaction between night lights and the corresponding regional dummy. ANNEX III Methodological Annex Using NL Data as a Proxy for Economic Activity 150 Ukraine_2015_nov26.indd 150 2015-11-26 5:14 PM
  • 173.
    (1) (2) (3)(4) VARIABLES GVA GVA GVA Urban GVA Urban Log(Night Lights) 0.839*** 0.728*** (0.0496) (0.0620) Western X log(Night Lights) -0.0283*** (0.00632) Eastern X log(Night Lights) 0.0133 (0.00888) Central X log(Night Lights) -0.00235 (0.0110) year 0.0754** 0.0705** 0.0573*** (0.0336) (0.0326) (0.0166) Log (Urban Night Lights) 0.786*** 0.776*** (0.0555) (0.0615) Western X log (Urban Night Lights) -0.0325*** (0.00605) Eastern X log (Urban Night Lights) -0.00127 (0.00796) Central X log (Urban Night Lights) -0.0343*** (0.00818) Constant -151.8** -140.6** -114.2*** 0.958 (67.54) (65.57) (33.22) (0.623) Observations 135 135 189 189 R-squared 0.493 0.528 0.687 0.706 Joint Test dummies 0.000 0.000 Table 5 - Correlation between GVA and night lights changes are significantly different between regions Robust standard errors in parentheses *** p0.01, ** p0.05, * p0.1 ANNEX III Methodological Annex Using NL Data as a Proxy for Economic Activity 151 Ukraine_2015_nov26.indd 151 2015-11-26 5:14 PM
  • 174.
    Annex IV Robustness ofCity Typologies The threshold used to define whether an area is part of an urban footprint or is rural has been selected by calibrating the lights data against higher resolution land use cover maps, in particular, the European Space Agency’s GlobCover 2009 map and the MODIS Collection 5 Land Cover Type. This calibration process uses images to determine which areas are urban and which are rural and then contrasts it with measurements of emitted light. A model is built with this relationship to determine urban and rural areas in the rest of the country. The errors of this process allow for the calculation of a distribution of thresholds. The median threshold is the one used in the section to determine urban areas. For Ukraine, this threshold was determined to be 20.94 DN. Intensity of night-time light here is measured on a “Digital Number” (DN) scale. The determination of this threshold is subject to measurement error. This error is transmitted to the determination of the typologies constructed in the section. Depending on how close to the threshold the light emitted by a city is, a city might jump between the different categories (Found, Appeared, Disappeared, Missed) if the threshold is perturbed marginally. Similarly, both area change and intensive growth could pass from negative to positive or vice versa, if numbers are close to the threshold. To test the robustness of these typologies, they can be calculated using not only the original threshold, but also the 5th and 95th percentile. This gives a 90 percent confidence interval that a particular area is urban or rural when determined by NLs thresholds. This error bounds are passed to the typology classification. When testing the first typology with the 90 percent confidence interval, a total misclassification or classification error of 15 percent is obtained. This means that performing the classification of the first typology the 5th and 95th percentiles and comparing it with the current classification (calculated with the median or 50th percentile), only 15 percent of cities change type. The change comes from cities that were close to the median threshold. For example, one city could have disappeared by presenting emitted lights just below the urban threshold in the second period. Changing this threshold can move it from disappeared to found. Similarly, when testing the second typology with the 90 percent confidence interval, a total misclassification of 35 percent is obtained. The same logic applies as before. The classification error in this case was expected to be higher because changing the threshold changes the urban footprint, which changes multiple dimensions of the data used to construct the second typology: it changes the total area of the footprint, which determines the area change; it also changes the amount of light emitted in the core, as it changes the measurement of the core, as well as its change overtime. Given that the confidence interval is so wide, this scale of misclassification error is not so large151 . 151 See Denison D., Holmes C., Mallick B., Smith A., Bayesian Methods for Nonlinear Classification and Regression. (2002) for a discussion on classification error and applications on the social sciences. ANNEX IV Robusness of City Typologies 152 Ukraine_2015_nov26.indd 152 2015-11-26 5:14 PM
  • 175.
  • 176.
    Annex V List ofUkrainian Cities (2013) City Oblast Typology 2 Population 2013 Typology 1 Region Size Population growth Typology 3 Simferopol Crimea 1 337285 FOUND Southern Mid size cities (100k - 500k) Declining but less than urban average A Vinnytsia Vinnytsia 1 371698 FOUND Central Mid size cities (100k - 500k) Positive growth A Rivne Rivne 1 250333 FOUND Western Mid size cities (100k - 500k) Positive growth A Ternopil Ternopil 1 217118 FOUND Western Mid size cities (100k - 500k) Declining but less than urban average A Kamianets- Podilskyi Khmelnytskyi 1 102743 FOUND Western Mid size cities (100k - 500k) Positive growth A Sarny Rivne 1 28625 FOUND Western Large towns (20k - 50k) Positive growth A Kuznetsovsk Rivne 1 41432 FOUND Western Large towns (20k - 50k) Positive growth A Kivertsi Volhynia 1 14611 FOUND Western Mid size towns (10k - 20k) Declining more than national average A Stryi Lviv 1 60126 FOUND Western Small cities (50k - 100k) Declining but less than urban average A Chernihiv Cernihiv 1 296089 FOUND Central Mid size cities (100k - 500k) Declining but less than urban average A Shepetivka Khmelnytskyi 1 43375 FOUND Western Small cities (50k - 100k) Declining more than national average A Kovel Volhynia 1 68912 FOUND Western Small cities (50k - 100k) Positive growth A Hnivan Vinnytsia 1 12587 FOUND Central Mid size towns (10k - 20k) Declining but less than urban average A Khust Zakarpattia 1 28643 FOUND Western Large towns (20k - 50k) Declining but less than urban average A Chernivtsi Cernivcy 1 258842 FOUND Western Mid size cities (100k - 500k) Positive growth A ANNEX V List of Ukrainian Cities 154 Ukraine_2015_nov26.indd 154 2015-11-26 5:14 PM
  • 177.
    City Oblast Typology 2 Population 2013 Typology 1 Region SizePopulation growth Typology 3 Kerch Crimea 1 145265 FOUND Southern Mid size cities (100k - 500k) Declining more than national average A Kalush Ivano- Frankivsk 1 67585 FOUND Western Small cities (50k - 100k) Declining but less than urban average A Khmel- nytskyi Khmel- nytskyi 1 264988 FOUND Western Mid size cities (100k - 500k) Positive growth A Kostopil Rivne 1 31590 FOUND Western Large towns (20k - 50k) Positive growth A Bakhmach Cernihiv 1 18683 FOUND Central Large towns (20k - 50k) Declining more than national average A Kharkov Charkiv 1 1451028 FOUND Eastern Major cities ( 500k) Declining but less than urban average A Kamianka- Buzka Lviv 1 10900 FOUND Western Mid size towns (10k - 20k) Declining more than national average A Pyriatyn Poltava 1 15981 FOUND Central Mid size towns (10k - 20k) Declining but less than urban average A Vynohradiv Zakarpa-ttia 1 25565 FOUND Western Large towns (20k - 50k) Declining but less than urban average A Brody Lviv 1 23784 FOUND Western Large towns (20k - 50k) Positive growth A Yevpatoria Crimea 1 106877 FOUND Southern Mid size cities (100k - 500k) Positive growth A Sokal Lviv 1 21386 FOUND Western Large towns (20k - 50k) Declining but less than urban average A Volodymyr- Volynskyi Volhynia 1 38870 FOUND Western Large towns (20k - 50k) Positive growth A Feodosiya Crimea 1 69461 FOUND Southern Small cities (50k - 100k) Declining more than national average A Staro- kostiantyniv Khmel nytskyi 1 34945 FOUND Western Large towns (20k - 50k) Declining but less than urban average A Soledar Donetsk 1 11708 FOUND Eastern Mid size towns (10k - 20k) Declining more than national average A Rava-Ruska Lviv 1 8426 FOUND Western Small Town (10k) Positive growth A Kolomyia Ivano- Frankivsk 1 61428 FOUND Western Small cities (50k - 100k) Declining but less than urban average A ANNEX V List of Ukrainian Cities 155 Ukraine_2015_nov26.indd 155 2015-11-26 5:14 PM
  • 178.
    City Oblast Typology 2 Population 2013 Typology 1 Region SizePopulation growth Typology 3 Dunaivtsi Khmel- nytskyi 1 16219 FOUND Western Mid size towns (10k - 20k) Declining but less than urban average A Hlukhiv Sumy 1 34574 FOUND Central Large towns (20k - 50k) Declining but less than urban average A Novovo- lynsk Volhynia 1 53199 FOUND Western Small cities (50k - 100k) Declining but less than urban average A Nizhyn Cernihiv 1 73282 FOUND Central Small cities (50k - 100k) Declining but less than urban average A Berehove Zakar-pattia 1 24458 FOUND Western Large towns (20k - 50k) Declining more than national average A Yalta Crimea 1 78115 FOUND Southern Small cities (50k - 100k) Declining but less than urban average A Sevastopol Sevas-topol 1 342580 FOUND Southern Mid size cities (100k - 500k) Positive growth A Zbarazh Ternopil 1 14004 FOUND Western Mid size towns (10k - 20k) Positive growth A Chervo- nohrad Lviv 1 68000 FOUND Western Small cities (50k - 100k) Declining but less than urban average A Horodok_K Khmel- nytskyi 1 16761 FOUND Western Mid size towns (10k - 20k) Declining but less than urban average A Ismail Odessa 1 73007 FOUND Southern Small cities (50k - 100k) Declining more than national average A Kalynivka Vinnytsia 1 19291 FOUND Central Mid size towns (10k - 20k) Declining but less than urban average A Mena Cernihiv 1 12264 FOUND Central Mid size towns (10k - 20k) Declining but less than urban average A Ivano- Frankivsk Ivano- Frankivsk 1 226018 FOUND Western Mid size cities (100k - 500k) Positive growth A Skvyra Kiev 1 16715 FOUND Central Mid size towns (10k - 20k) Declining more than national average A Lviv Lviv 1 730272 FOUND Western Major cities ( 500k) Declining but less than urban average A Sambir Lviv 1 34899 FOUND Western Large towns (20k - 50k) Declining but less than urban average A Droho- bych Lviv 1 77080 FOUND Western Small cities (50k - 100k) Declining but less than urban average A ANNEX V List of Ukrainian Cities 156 Ukraine_2015_nov26.indd 156 2015-11-26 5:14 PM
  • 179.
    City Oblast Typology 2 Population 2013 Typology 1 Region SizePopulation growth Typology 3 Lutsk Volhynia 1 214727 FOUND Western Mid size cities (100k - 500k) Positive growth A Zhytomyr Zhytomyr 1 271303 FOUND Central Mid size cities (100k - 500k) Declining but less than urban average A Zolochiv Lviv 1 24074 FOUND Western Large towns (20k - 50k) Positive growth A Odessa Odessa 1 1014852 FOUND Southern Major cities ( 500k) Declining but less than urban average A Hadiach Poltava 1 24196 FOUND Central Large towns (20k - 50k) Positive growth A Uman Cherkasy 1 87111 FOUND Central Small cities (50k - 100k) Declining but less than urban average A Kiev Kiev 1 2757900 FOUND Central Small Town (10k) Positive growth A Buryn Sumy 1 9134 FOUND Central Mid size towns (10k - 20k) Declining more than national average A Zoloto- nosha Cherkasy 1 28371 FOUND Central Large towns (20k - 50k) Declining but less than urban average A Radekhiv Lviv 1 9600 FOUND Western Small Town (10k) Positive growth A Dubno Rivne 1 38019 FOUND Western Large towns (20k - 50k) Declining but less than urban average A Kakhovka Kherson 2 37419 FOUND Southern Large towns (20k - 50k) Declining but less than urban average B Bar Vinnytsia 2 16442 APPEAR Central Mid size towns (10k - 20k) Declining but less than urban average B Luhansk Luhansk 2 425848 FOUND Eastern Mid size cities (100k - 500k) Declining more than national average B Starobilsk Luhansk 2 18297 FOUND Eastern Large towns (20k - 50k) Declining more than national average B Mykolaivka Donetsk 2 15684 FOUND Eastern Mid size towns (10k - 20k) Declining but less than urban average D Torez Donetsk 2 57998 FOUND Eastern Small cities (50k - 100k) Declining more than national average B Sniatyn Ivano- Frankivsk 2 10106 APPEAR Western Mid size towns (10k - 20k) Declining but less than urban average B ANNEX V List of Ukrainian Cities 157 Ukraine_2015_nov26.indd 157 2015-11-26 5:14 PM
  • 180.
    City Oblast Typology 2 Population 2013 Typology 1 Region SizePopulation growth Typology 3 Balakliia Charkiv 2 29499 FOUND Eastern Large towns (20k - 50k) Declining more than national average B Popasna Luhansk 2 21917 FOUND Eastern Large towns (20k - 50k) Declining more than national average B Marhanets Dnipro- petrovsk 2 48546 FOUND Southern Small cities (50k - 100k) Declining but less than urban average B Bolekhiv Ivano- Frankivsk 2 10768 APPEAR Western Mid size towns (10k - 20k) Positive growth B Synelny- kove Dnipro- petrovsk 2 31568 FOUND Southern Large towns (20k - 50k) Declining but less than urban average B Khmilnyk Vinnytsia 2 28209 APPEAR Central Large towns (20k - 50k) Positive growth B Chortkiv Ternopil 2 29640 FOUND Western Large towns (20k - 50k) Positive growth B Znamianka Kirovohrad 2 23983 FOUND Central Large towns (20k - 50k) Declining more than national average B Buchach Ternopil 2 12597 APPEAR Western Mid size towns (10k - 20k) Positive growth B Krasnohrad Charkiv 2 21332 FOUND Eastern Large towns (20k - 50k) Declining but less than national average B Komsomolsk Poltava 2 51730 FOUND Central Small cities (50k - 100k) Declining but less than urban average B Sievero- donetsk Luhansk 2 109466 FOUND Eastern Mid size cities (100k - 500k) Declining more than national average B Novoia- vorivske Lviv 2 29580 APPEAR Western Large towns (20k - 50k) Positive growth B Novyj Rozdil Lviv 2 28797 APPEAR Western Large towns (20k - 50k) Positive growth B Mohyliv- Podilskyi Vinnytsia 2 32056 FOUND Central Large towns (20k - 50k) Declining but less than urban average B Volochysk Khmel- nytskyi 2 19619 APPEAR Western Large towns (20k - 50k) Declining more than national average B Pervomaisk Mykolaiv 2 66671 FOUND Southern Small cities (50k - 100k) Declining but less than urban average B Kaniv Cherkasy 2 25558 APPEAR Central Large towns (20k - 50k) Declining but less than urban average B ANNEX V List of Ukrainian Cities 158 Ukraine_2015_nov26.indd 158 2015-11-26 5:14 PM
  • 181.
    City Oblast Typology 2 Population 2013 Typology 1 Region SizePopulation growth Typology 3 Trostianets Sumy 2 21368 FOUND Central Large towns (20k - 50k) Declining more than national average B Ordzho- nikidze Dnipro- petrovsk 2 41374 FOUND Southern Large towns (20k - 50k) Declining more than national average B Konotop Sumy 2 88787 FOUND Central Small cities (50k - 100k) Declining but less than urban average B Zalishchyky Ternopil 2 9417 APPEAR Western Mid size towns (10k - 20k) Declining more than national average B Bakhchi saray Crimea 2 26482 APPEAR Southern Large towns (20k - 50k) Declining but less than urban average B Horodok_L Lviv 2 15959 APPEAR Western Mid size towns (10k - 20k) Declining but less than urban average B Lebedyn Sumy 2 26137 FOUND Central Large towns (20k - 50k) Declining more than national average D Novyi Buh Mykolaiv 2 15531 FOUND Southern Mid size towns (10k - 20k) Declining but less than urban average B Yuzhnou krainsk Mykolaiv 2 40555 FOUND Southern Large towns (20k - 50k) Positive growth B Snizhne Donetsk 2 48485 FOUND Eastern Small cities (50k - 100k) Declining more than national average B Okhtyrka Sumy 2 49047 FOUND Central Small cities (50k - 100k) Declining but less than urban average B Nemyriv Vinnytsia 2 11900 APPEAR Central Mid size towns (10k - 20k) Declining but less than urban average B Nova Kakhovka Kherson 2 47852 FOUND Southern Small cities (50k - 100k) Declining more than national average B Kotovsk Odessa 2 40692 FOUND Southern Large towns (20k - 50k) Declining but less than urban average B Enerhodar Zaporizhia 2 54708 FOUND Southern Large towns (20k - 50k) Declining but less than urban average B Slavutych Kiev 2 24826 FOUND Central Mid size towns (10k - 20k) Positive growth B Zvenyho rodka Cherkasy 2 17958 APPEAR Central Large towns (20k - 50k) Declining more than national average B Druzhkivka Donetsk 2 59863 FOUND Eastern Small cities (50k - 100k) Declining more than national average B ANNEX V List of Ukrainian Cities 159 Ukraine_2015_nov26.indd 159 2015-11-26 5:14 PM
  • 182.
    City Oblast Typology 2 Population 2013 Typology 1 Region SizePopulation growth Typology 3 Dnipro dzerzhynsk Dnipro petrovsk 2 241880 FOUND Southern Mid size cities (100k - 500k) Declining but less than urban average B Morshyn Lviv 2 6037 APPEAR Western Small Town (10k) Declining more than national average B Chasiv Yar Donetsk 2 13999 FOUND Eastern Mid size towns (10k - 20k) Declining more than national average B Romny Sumy 2 42616 FOUND Central Small cities (50k - 100k) Declining more than national average B Liuboml Volhynia 2 10246 APPEAR Western Mid size towns (10k - 20k) Declining but less than urban average B Lutuhyne Luhansk 2 17989 FOUND Eastern Mid size towns (10k - 20k) Declining but less than urban average B Kherson Kherson 2 299052 FOUND Southern Mid size cities (100k - 500k) Declining more than national average B Berdiansk Zaporizhia 2 116034 FOUND Southern Mid size cities (100k - 500k) Declining but less than urban average B Hrebinka Poltava 2 10960 FOUND Central Mid size towns (10k - 20k) Declining but less than national average D Poltava Poltava 2 296852 FOUND Central Mid size cities (100k - 500k) Declining more than national average D Burshtyn Ivano- Frankivsk 2 15340 APPEAR Western Mid size towns (10k - 20k) Positive growth B Dolyna Ivano- Frankivsk 2 20622 FOUND Western Large towns (20k - 50k) Declining but less than urban average B Zhydachiv Lviv 2 11180 APPEAR Western Mid size towns (10k - 20k) Declining but less than urban average B Myronivka Kiev 2 11964 FOUND Central Mid size towns (10k - 20k) Declining more than national average B Nowomos kowsk Dnipro petrovsk 2 70787 FOUND Southern Small cities (50k - 100k) Declining but less than urban average B Kosiv Ivano- Frankivsk 2 8543 APPEAR Western Small Town (10k) Positive growth B Zmiiv Charkiv 2 15211 FOUND Eastern Large towns (20k - 50k) Declining more than national average B Mostyska Lviv 2 9193 APPEAR Western Small Town (10k) Positive growth B ANNEX V List of Ukrainian Cities 160 Ukraine_2015_nov26.indd 160 2015-11-26 5:14 PM
  • 183.
    City Oblast Typology 2 Population 2013 Typology 1 Region SizePopulation growth Typology 3 Amvrosiivka Donetsk 2 18832 FOUND Eastern Large towns (20k - 50k) Declining more than national average B Horodnia Cernihiv 2 12558 APPEAR Central Mid size towns (10k - 20k) Declining more than national average B Mykolaiv_M Mykolaiv 2 496188 FOUND Southern Major cities ( 500k) Declining but less than urban average B Krasnyi Lyman Donetsk 2 22509 FOUND Eastern Large towns (20k - 50k) Declining more than national average B Kostianty nivka Donetsk 2 77066 FOUND Eastern Mid size cities (100k - 500k) Declining more than national average B Shchors Cernihiv 2 11471 APPEAR Central Mid size towns (10k - 20k) Declining more than national average B Oleksandriia Kirovohrad 2 82819 FOUND Central Mid size cities (100k - 500k) Declining more than national average B Khorol Poltava 2 13593 APPEAR Central Mid size towns (10k - 20k) Declining more than national average B Ternivka Dnipro petrovsk 2 28920 FOUND Southern Large towns (20k - 50k) Declining but less than urban average B Polohy Zaporizhia 2 19906 FOUND Southern Large towns (20k - 50k) Declining more than national average B Alushta Crimea 2 28418 APPEAR Southern Large towns (20k - 50k) Declining more than national average B Khodoriv Lviv 2 9829 APPEAR Western Mid size towns (10k - 20k) Declining more than national average B Kryvyj Rih Dnipro petrovsk 2 656478 FOUND Southern Major cities ( 500k) Declining but less than urban average B Koziatyn Vinnytsia 2 24247 FOUND Central Large towns (20k - 50k) Declining more than national average B Pomichna Kirovohrad 2 9210 FOUND Central Mid size towns (10k - 20k) Declining more than national average D Druzhba Sumy 2 5031 FOUND Central Small Town (10k) Declining more than national average B Krasnyi Luch Luhansk 2 82765 FOUND Eastern Mid size cities (100k - 500k) Declining more than national average B Vovchansk Charkiv 2 19082 FOUND Eastern Large towns (20k - 50k) Declining more than national average B ANNEX V List of Ukrainian Cities 161 Ukraine_2015_nov26.indd 161 2015-11-26 5:14 PM
  • 184.
    City Oblast Typology 2 Population 2013 Typology 1 Region SizePopulation growth Typology 3 Reni Odessa 2 19480 FOUND Southern Large towns (20k - 50k) Declining but less than urban average D Mykolaiv_L Lviv 2 14877 FOUND Western Mid size towns (10k - 20k) Positive growth B Dzhankoy Crimea 2 36086 FOUND Southern Small cities (50k - 100k) Declining more than national average D Svaliava Zakarpattia 2 17027 FOUND Western Mid size towns (10k - 20k) Declining but less than urban average B Chervono zavodske Poltava 2 8612 FOUND Central Mid size towns (10k - 20k) Declining but less than urban average B Saky Crimea 2 23655 APPEAR Southern Large towns (20k - 50k) Declining more than national average B Kitsman Cernivcy 2 6762 APPEAR Western Small Town (10k) Declining more than national average B Dokucha ievsk Donetsk 2 23733 FOUND Eastern Large towns (20k - 50k) Declining but less than urban average B Zuhres Donetsk 2 18553 FOUND Eastern Large towns (20k - 50k) Declining more than national average B Zelenodolsk Dnipro petrovsk 2 13947 FOUND Southern Mid size towns (10k - 20k) Declining but less than urban average B Chop Zakarpattia 2 8994 FOUND Western Small Town (10k) Positive growth B Pryluky Cernihiv 2 58475 FOUND Central Small cities (50k - 100k) Declining more than national average B Yaremche Ivano- Frankivsk 2 8124 APPEAR Western Small Town (10k) Positive growth B Berezan Kiev 2 16543 APPEAR Central Mid size towns (10k - 20k) Declining but less than urban average B Swerdlovsk Luhansk 2 65276 FOUND Eastern Small cities (50k - 100k) Declining more than national average B Rozdilna Odessa 2 17904 FOUND Southern Mid size towns (10k - 20k) Positive growth B Kaharlyk Kiev 2 13758 APPEAR Central Mid size towns (10k - 20k) Positive growth B Melitopol Zaporizhia 2 156984 FOUND Southern Mid size cities (100k - 500k) Declining but less than urban average B ANNEX V List of Ukrainian Cities 162 Ukraine_2015_nov26.indd 162 2015-11-26 5:14 PM
  • 185.
    City Oblast Typology 2 Population 2013 Typology 1 Region SizePopulation growth Typology 3 Izium Charkiv 2 51511 FOUND Eastern Small cities (50k - 100k) Declining more than national average B Sudak Crimea 2 15457 APPEAR Southern Mid size towns (10k - 20k) Positive growth B Vilniansk Zaporizhia 2 15682 FOUND Southern Mid size towns (10k - 20k) Declining but less than urban average B Staryi Sambir Lviv 2 6446 APPEAR Western Small Town (10k) Positive growth B Svitlovodsk Kirovohrad 2 46613 FOUND Central Small cities (50k - 100k) Declining more than national average B Khrysty nivka Cherkasy 2 10860 FOUND Central Mid size towns (10k - 20k) Declining more than national average D Bilopillia Sumy 2 16731 FOUND Central Mid size towns (10k - 20k) Declining more than national average B Verkhivtseve Dnipro petrovsk 2 10033 FOUND Southern Mid size towns (10k - 20k) Declining but less than urban average B Krolevets Sumy 2 23574 FOUND Central Large towns (20k - 50k) Declining more than national average B Malyn Zhytomyr 2 26934 FOUND Central Large towns (20k - 50k) Declining but less than urban average B Vilnohirsk Dnipro petrovsk 2 23764 FOUND Southern Large towns (20k - 50k) Declining but less than urban average B Kirovske Donetsk 2 28291 FOUND Eastern Large towns (20k - 50k) Declining more than national average B Dniprorudne Zaporizhia 2 19479 FOUND Southern Large towns (20k - 50k) Declining more than national average D Debaltseve Donetsk 2 25774 FOUND Eastern Large towns (20k - 50k) Declining more than national average B Novoselytsia Cernivcy 2 7774 APPEAR Western Small Town (10k) Declining more than national average B Novodni strovsk Cernivcy 2 10776 APPEAR Western Mid size towns (10k - 20k) Positive growth B Zhovkva Lviv 2 13594 APPEAR Western Mid size towns (10k - 20k) Positive growth B Piatykhatky Dnipro petrovsk 2 18944 FOUND Southern Large towns (20k - 50k) Declining more than national average B ANNEX V List of Ukrainian Cities 163 Ukraine_2015_nov26.indd 163 2015-11-26 5:14 PM
  • 186.
    City Oblast Typology 2 Population 2013 Typology 1 Region SizePopulation growth Typology 3 Kamin- Kashyrskyi Volhynia 2 12018 APPEAR Western Small Town (10k) Positive growth B Krasyliv Khmelnyt skyi 2 19743 APPEAR Western Large towns (20k - 50k) Declining but less than urban average B Khotyn Cernivcy 2 9771 APPEAR Western Mid size towns (10k - 20k) Declining more than national average B Kramatorsk Donetsk 2 164283 FOUND Eastern Mid size cities (100k - 500k) Declining more than national average B Bobrynets Kirovohrad 2 10991 APPEAR Central Mid size towns (10k - 20k) Declining more than national average B Lokhvytsia Poltava 2 11863 APPEAR Central Mid size towns (10k - 20k) Declining but less than urban average B Horokhiv Volhynia 2 9093 APPEAR Western Small Town (10k) Positive growth B Kupiansk Charkiv 2 29487 FOUND Eastern Large towns (20k - 50k) Declining more than national average B Dnepro petrovsk Dnipro petrovsk 2 997754 FOUND Southern Major cities ( 500k) Declining more than national average D Horlivka Donetsk 2 256714 FOUND Eastern Mid size cities (100k - 500k) Declining more than national average D Sokyriany Cernivcy 2 9462 APPEAR Western Mid size towns (10k - 20k) Declining more than national average B Smila Cherkasy 2 68636 FOUND Central Small cities (50k - 100k) Declining but less than urban average B Kurakhove Donetsk 2 20098 FOUND Eastern Large towns (20k - 50k) Declining more than national average D Berezhany Ternopil 2 18161 APPEAR Western Mid size towns (10k - 20k) Positive growth B Alchevsk Luhansk 2 111360 FOUND Eastern Mid size cities (100k - 500k) Declining more than national average B Shpola Cherkasy 2 17806 FOUND Central Large towns (20k - 50k) Declining more than national average B Krasno perekopsk Crimea 2 29815 FOUND Southern Large towns (20k - 50k) Declining but less than urban average D Biliaivka Odessa 2 12052 APPEAR Southern Mid size towns (10k - 20k) Declining more than national average B ANNEX V List of Ukrainian Cities 164 Ukraine_2015_nov26.indd 164 2015-11-26 5:14 PM
  • 187.
    City Oblast Typology 2 Population 2013 Typology 1 Region SizePopulation growth Typology 3 Dzerzhynsk Donetsk 2 35296 FOUND Eastern Small cities (50k - 100k) Declining more than national average B Nikopol Dnipro petrovsk 2 118720 FOUND Southern Mid size cities (100k - 500k) Declining more than national average B Iziaslav Khmelnyt skyi 2 17172 APPEAR Western Mid size towns (10k - 20k) Declining more than national average B Komsomol ske Donetsk 2 11763 FOUND Eastern Mid size towns (10k - 20k) Declining more than national average B Antratsyt Luhansk 2 54640 FOUND Eastern Small cities (50k - 100k) Declining more than national average B Ilovaisk Donetsk 2 15949 FOUND Eastern Large towns (20k - 50k) Declining more than national average B Korsun- Shevchenkiv- skyi Cherkasy 2 18655 APPEAR Central Large towns (20k - 50k) Declining but less than urban average B Zhmerynka Vinnytsia 2 35390 FOUND Central Large towns (20k - 50k) Declining but less than urban average B Zhovti Vody Dnipro- petrovsk 2 47509 FOUND Southern Small cities (50k - 100k) Declining more than national average B Artemivsk Donetsk 2 77620 FOUND Eastern Small cities (50k - 100k) Declining more than national average B Lubny Poltava 2 47643 FOUND Central Small cities (50k - 100k) Declining more than national average B Pochaiv Ternopil 2 7842 APPEAR Western Mid size towns (10k - 20k) Declining but less than urban average B Krasnodon Luhansk 2 44283 FOUND Eastern Small cities (50k - 100k) Declining more than national average B Olevsk Zhytomyr 2 10231 APPEAR Central Mid size towns (10k - 20k) Declining but less than national average B Stakhanov Luhansk 2 77593 FOUND Eastern Mid size cities (100k - 500k) Declining more than national average B Rovenky Luhansk 2 47852 FOUND Eastern Small cities (50k - 100k) Declining more than national average B Vorozhba Sumy 3 7444 DIS APPEAR Central Small Town (10k) Declining more than national average C ANNEX V List of Ukrainian Cities 165 Ukraine_2015_nov26.indd 165 2015-11-26 5:14 PM
  • 188.
    City Oblast Typology 2 Population 2013 Typology 1 Region SizePopulation growth Typology 3 Bila Tserkva Kiev 3 210919 FOUND Central Mid size cities (100k - 500k) Positive growth C Haisyn Vinnytsia 3 25855 FOUND Central Large towns (20k - 50k) Positive growth E Myrhorod Poltava 3 41109 FOUND Central Large towns (20k - 50k) Declining but less than urban average E Yavoriv Lviv 3 12905 FOUND Western Mid size towns (10k - 20k) Declining but less than urban average E Siversk Donetsk 3 12145 DIS APPEAR Eastern Mid size towns (10k - 20k) Declining more than national average C Ladyzhyn Vinnytsia 3 22961 FOUND Central Mid size towns (10k - 20k) Positive growth E Krasno- armiysk Donetsk 3 64895 FOUND Eastern Small cities (50k - 100k) Declining but less than national average E Bobrovytsia Cernihiv 3 11238 DIS APPEAR Central Mid size towns (10k - 20k) Declining but less than urban average C Kobeliaky Poltava 3 10181 DIS APPEAR Central Mid size towns (10k - 20k) Declining more than national average C Bohodukhiv Charkiv 3 15797 FOUND Eastern Mid size towns (10k - 20k) Declining more than national average E Haivoron Kirovohrad 3 15214 DIS APPEAR Central Mid size towns (10k - 20k) Declining but less than urban average C Volnovakha Donetsk 3 23305 FOUND Eastern Large towns (20k - 50k) Declining but less than urban average E Apostolove Dnipro petrovsk 3 14432 DIS APPEAR Southern Mid size towns (10k - 20k) Declining more than national average C Kreminna Luhansk 3 20324 DIS APPEAR Eastern Large towns (20k - 50k) Declining more than national average C Verkhniod niprovsk Dnipro petrovsk 3 16885 DIS APPEAR Southern Large towns (20k - 50k) Declining but less than urban average C Kirovohrad Kirovohrad 3 234322 FOUND Central Mid size cities (100k - 500k) Declining more than national average C Selydove Donetsk 3 24145 DIS APPEAR Eastern Large towns (20k - 50k) Declining more than national average C Karlivka Poltava 3 15202 DIS APPEAR Central Large towns (20k - 50k) Declining more than national average C ANNEX V List of Ukrainian Cities 166 Ukraine_2015_nov26.indd 166 2015-11-26 5:14 PM
  • 189.
    City Oblast Typology 2 Population 2013 Typology 1 Region SizePopulation growth Typology 3 Netishyn Khmelny tskyi 3 36741 FOUND Western Large towns (20k - 50k) Positive growth C Pervo maisk L Luhansk 3 38435 FOUND Eastern Small cities (50k - 100k) Declining more than national average E Kremenchuk Poltava 3 225892 FOUND Central Mid size cities (100k - 500k) Declining but less than urban average C Barvinkove Charkiv 3 9709 DIS APPEAR Eastern Mid size towns (10k - 20k) Declining more than national average C Cherkasy Cherkasy 3 285605 FOUND Central Mid size cities (100k - 500k) Declining but less than urban average E Novohrad- Volynskyi Zhytomyr 3 55991 FOUND Central Small cities (50k - 100k) Declining but less than urban average E Korosten Zhytomyr 3 65503 FOUND Central Small cities (50k - 100k) Declining but less than urban average E Sumy Sumy 3 269177 FOUND Central Mid size cities (100k - 500k) Declining more than national average C Shchastia Luhansk 3 12773 DIS APPEAR Eastern Mid size towns (10k - 20k) Declining more than national average C Berdychiv Zhytomyr 3 78523 FOUND Central Small cities (50k - 100k) Declining more than national average C Mala Vyska Kirovohrad 3 11141 DIS APPEAR Central Mid size towns (10k - 20k) Declining more than national average C Slavuta Khmelnyt skyi 3 35625 FOUND Western Large towns (20k - 50k) Positive growth E Mariupol Donetsk 3 461810 FOUND Eastern Major cities ( 500k) Declining but less than national average E Ovruch Zhytomyr 3 16614 FOUND Central Mid size towns (10k - 20k) Declining but less than urban average E Snihurivka Mykolaiv 3 13131 DIS APPEAR Southern Mid size towns (10k - 20k) Declining more than national average C Bilhorod- Dnistrovskyi Odessa 3 50246 FOUND Southern Small cities (50k - 100k) Declining but less than urban average E Khorostkiv Ternopil 3 7057 DIS APPEAR Western Small Town (10k) Declining but less than urban average C Orikhiv Zaporizhia 3 15281 DIS APPEAR Southern Large towns (20k - 50k) Declining more than national average C ANNEX V List of Ukrainian Cities 167 Ukraine_2015_nov26.indd 167 2015-11-26 5:14 PM
  • 190.
    City Oblast Typology 2 Population 2013 Typology 1 Region SizePopulation growth Typology 3 Andrushivka Zhytomyr 3 9038 DIS APPEAR Central Mid size towns (10k - 20k) Declining more than national average C Novo ukrainka Kirovohrad 3 17741 FOUND Central Large towns (20k - 50k) Declining more than national average C Skadovsk Kherson 3 18940 FOUND Southern Large towns (20k - 50k) Declining but less than urban average E Borshchiv Ternopil 3 11222 FOUND Western Mid size towns (10k - 20k) Declining but less than urban average E Svatove Luhansk 3 18241 DIS APPEAR Eastern Large towns (20k - 50k) Declining more than national average C Uzhhorod Zakarpattia 3 116349 FOUND Western Mid size cities (100k - 500k) Declining but less than urban average C Nadvirna Ivano- Frankivsk 3 22209 FOUND Western Large towns (20k - 50k) Positive growth E Petrovske Luhansk 3 13260 DIS APPEAR Eastern Mid size towns (10k - 20k) Declining more than national average C Pereiaslav- Khmelnyts kyi Kiev 3 27945 FOUND Central Large towns (20k - 50k) Declining more than national average E Persho travensk Dnipro petrovsk 3 29019 DIS APPEAR Southern Large towns (20k - 50k) Declining but less than urban average C Novhorod- Siverskyi Cernihiv 3 13791 DIS APPEAR Central Mid size towns (10k - 20k) Declining more than national average C Mukachevo Zakarpattia 3 84992 FOUND Western Small cities (50k - 100k) Positive growth E Mospyne Donetsk 3 10806 DIS APPEAR Eastern Mid size towns (10k - 20k) Declining more than national average C Vosnessensk Mykolaiv 3 36613 FOUND Southern Large towns (20k - 50k) Declining more than national average C Zymohiria Luhansk 3 9949 DIS APPEAR Eastern Mid size towns (10k - 20k) Declining more than national average C Hirske Luhansk 3 10131 DIS APPEAR Eastern Mid size towns (10k - 20k) Declining more than national average C Talne Cherkasy 3 14216 FOUND Central Mid size towns (10k - 20k) Declining more than national average E Vasylivka Zaporizhia 3 13996 DIS APPEAR Southern Mid size towns (10k - 20k) Declining more than national average C ANNEX V List of Ukrainian Cities 168 Ukraine_2015_nov26.indd 168 2015-11-26 5:14 PM
  • 191.
    City Oblast Typology 2 Population 2013 Typology 1 Region SizePopulation growth Typology 3 Tsiurupynsk Kherson 3 25112 DIS APPEAR Southern Large towns (20k - 50k) Positive growth C Svitlodarsk Donetsk 3 12164 DIS APPEAR Eastern Mid size towns (10k - 20k) Declining more than national average C Fastiv Kiev 3 48237 FOUND Central Small cities (50k - 100k) Declining more than national average E Hirnyk Donetsk 3 11641 DIS APPEAR Eastern Mid size towns (10k - 20k) Declining more than national average C Yahotyn Kiev 3 20445 FOUND Central Large towns (20k - 50k) Declining more than national average C Armiansk Crimea 3 22337 FOUND Southern Large towns (20k - 50k) Declining more than national average E Chervono partyzansk Luhansk 3 15659 FOUND Eastern Large towns (20k - 50k) Declining more than national average E Tokmak Zaporizhia 3 32996 DIS APPEAR Southern Large towns (20k - 50k) Declining more than national average C Bashtanka Mykolaiv 3 12680 DIS APPEAR Southern Mid size towns (10k - 20k) Declining but less than urban average C Shostka Sumy 3 79058 FOUND Central Small cities (50k - 100k) Declining more than national average E Liubotyn Charkiv 3 21909 FOUND Eastern Large towns (20k - 50k) Declining more than national average E Korostyshiv Zhytomyr 3 25817 FOUND Central Large towns (20k - 50k) Declining but less than urban average E Donetsk Donetsk 4 953217 FOUND Eastern Major cities ( 500k) Declining but less than national average . Zaporizhia Zaporizhia 4 770672 FOUND Southern Major cities ( 500k) Declining but less than national average . Yasynuvata Donetsk 35836 FOUND Eastern Large towns (20k - 50k) Declining but less than urban average . Busk Lviv 8437 MISSED Western Small Town (10k) Declining but less than urban average . Artemove Donetsk 5598 DIS APPEAR Eastern Small Town (10k) Declining more than national average . ANNEX V List of Ukrainian Cities 169 Ukraine_2015_nov26.indd 169 2015-11-26 5:14 PM
  • 192.
    City Oblast Typology 2 Population 2013 Typology 1 Region SizePopulation growth Typology 3 Artsyz Odessa 15178 MISSED Southern Large towns (20k - 50k) Declining more than national average . Novohro divka Donetsk 15398 MISSED Eastern Mid size towns (10k - 20k) Declining more than national average . Rudky Lviv 5434 MISSED Western Small Town (10k) Positive growth . Boryspil Kiev 59545 FOUND Central Small cities (50k - 100k) Positive growth . Peremy shliany Lviv 6874 MISSED Western Small Town (10k) Declining more than national average . Komarno Lviv 3842 MISSED Western Small Town (10k) Declining but less than urban average . Dovbysh Zhytomyr 4498 MISSED Central Small Town (10k) Declining but less than urban average . Marinka Donetsk 9913 FOUND Eastern Mid size towns (10k - 20k) Declining more than national average . Vynnyky Lviv 16278 FOUND Western Mid size towns (10k - 20k) Positive growth . Shcholkine Crimea 11184 MISSED Southern Mid size towns (10k - 20k) Declining but less than urban average . Brianka Luhansk 47512 FOUND Eastern Small cities (50k - 100k) Declining more than national average . Zastavna Cernivcy 8063 MISSED Western Small Town (10k) Declining more than national average . Oster Cernihiv 6339 MISSED Central Small Town (10k) Declining more than national average . Ustyluh Volhynia 2214 MISSED Western Small Town (10k) Declining but less than urban average . Illichivsk Odessa 59718 FOUND Southern Small cities (50k - 100k) Positive growth . Kamianka Cherkasy 12652 MISSED Central Mid size towns (10k - 20k) Declining more than national average . Pivdenne Charkiv 7818 FOUND Eastern Small Town (10k) Declining more than national average . Kremenets Ternopil 21729 MISSED Western Large towns (20k - 50k) Declining but less than urban average . ANNEX V List of Ukrainian Cities 170 Ukraine_2015_nov26.indd 170 2015-11-26 5:14 PM
  • 193.
    City Oblast Typology 2 Population 2013 Typology 1 Region SizePopulation growth Typology 3 Baranivka Zhytomyr 11980 MISSED Central Mid size towns (10k - 20k) Declining but less than urban average . Bilozerske Donetsk 16101 MISSED Eastern Large towns (20k - 50k) Declining more than national average . Rzhyshchiv Kiev 7532 MISSED Central Small Town (10k) Declining more than national average . Bilohirsk Crimea 18220 MISSED Southern Mid size towns (10k - 20k) Declining but less than urban average . Bolhrad Odessa 15631 MISSED Southern Mid size towns (10k - 20k) Declining more than national average . Polonne Khmelnytskyi 21749 MISSED Western Large towns (20k - 50k) Declining but less than national average . Huliaipole Zaporizhia 14358 MISSED Southern Mid size towns (10k - 20k) Declining more than national average . Inkerman Sevastopol 11985 FOUND Southern Mid size towns (10k - 20k) Positive growth . Hlyniany Lviv 3183 MISSED Western Small Town (10k) Declining but less than national average . Zboriv Ternopil 6923 MISSED Western Small Town (10k) Declining more than national average . Pryvillia Luhansk 7747 DIS APPEAR Eastern Mid size towns (10k - 20k) Declining more than national average . Kirovsk Luhansk 28529 DIS APPEAR Eastern Large towns (20k - 50k) Declining more than national average . Zorynsk Luhansk 7331 MISSED Eastern Small Town (10k) Declining more than national average . Obukhiv Kiev 33102 FOUND Central Large towns (20k - 50k) Positive growth . Artemivsk L Luhansk 7506 FOUND Eastern Mid size towns (10k - 20k) Declining more than national average . Shumsk Ternopil 5404 MISSED Western Small Town (10k) Positive growth . Teplodar Odessa 10204 MISSED Southern Small Town (10k) Positive growth . ANNEX V List of Ukrainian Cities 171 Ukraine_2015_nov26.indd 171 2015-11-26 5:14 PM
  • 194.
    City Oblast Typology 2 Population 2013 Typology 1 Region SizePopulation growth Typology 3 Vasylkiv Kiev 36672 FOUND Central Large towns (20k - 50k) Declining more than national average . Radomyshl Zhytomyr 14943 MISSED Central Mid size towns (10k - 20k) Declining but less than urban average . Dubrovytsia Rivne 9414 MISSED Western Mid size towns (10k - 20k) Declining but less than urban average . Lanivtsi Ternopil 8752 MISSED Western Small Town (10k) Positive growth . Pustomyty Lviv 9111 APPEAR Western Small Town (10k) Declining more than national average . Henichesk Kherson 20353 MISSED Southern Large towns (20k - 50k) Declining more than national average . Lysychansk Luhansk 104314 FOUND Eastern Mid size cities (100k - 500k) Declining more than national average . Skalat Ternopil 4018 MISSED Western Small Town (10k) Declining but less than urban average . Vashkivtsi Cernivcy 5406 MISSED Western Small Town (10k) Declining more than national average . Krasno horivka Donetsk 15937 FOUND Eastern Mid size towns (10k - 20k) Declining but less than urban average . Velyki Mosty Lviv 6121 MISSED Western Small Town (10k) Positive growth . Ochakiv Mykolaiv 14632 MISSED Southern Mid size towns (10k - 20k) Declining more than national average . Lypovets Vinnytsia 8727 MISSED Central Small Town (10k) Declining more than national average . Rodynske Donetsk 10698 FOUND Eastern Mid size towns (10k - 20k) Declining more than national average . Irmino Luhansk 10044 FOUND Eastern Mid size towns (10k - 20k) Declining more than national average . Borzna Cernihiv 10535 MISSED Central Mid size towns (10k - 20k) Declining more than national average . Yunokomu narivsk Donetsk 14154 FOUND Eastern Large towns (20k - 50k) Declining more than national average . Boiarka Kiev 35320 FOUND Central Large towns (20k - 50k) Declining but less than urban average . ANNEX V List of Ukrainian Cities 172 Ukraine_2015_nov26.indd 172 2015-11-26 5:14 PM
  • 195.
    City Oblast Typology 2 Population 2013 Typology 1 Region SizePopulation growth Typology 3 Sukhodilsk Luhansk 21061 FOUND Eastern Large towns (20k - 50k) Declining more than national average . Sosnivka Lviv 11517 MISSED Western Mid size towns (10k - 20k) Declining but less than urban average . Korets Rivne 7388 MISSED Western Small Town (10k) Declining more than national average . Brovary Kiev 98250 FOUND Central Small cities (50k - 100k) Positive growth . Turka Lviv 7173 MISSED Western Small Town (10k) Declining more than national average . Khartsyzk Donetsk 59315 FOUND Eastern Small cities (50k - 100k) Declining more than national average . Sharhorod Vinnytsia 6975 MISSED Central Mid size towns (10k - 20k) Declining but less than urban average . Berezivka Odessa 9760 MISSED Southern Mid size towns (10k - 20k) Positive growth . Uzyn Kiev 12122 MISSED Central Mid size towns (10k - 20k) Declining more than national average . Monasty ryska Ternopil 6089 MISSED Western Small Town (10k) Declining but less than urban average . Balta Odessa 19211 MISSED Southern Large towns (20k - 50k) Declining but less than urban average . Storozhy nets Cernivcy 14473 MISSED Western Mid size towns (10k - 20k) Declining but less than urban average . Skole Lviv 6312 MISSED Western Small Town (10k) Declining more than national average . Vyshhorod Kiev 26536 FOUND Central Large towns (20k - 50k) Positive growth . Terebovlia Ternopil 13783 MISSED Western Mid size towns (10k - 20k) Positive growth . Stary Krym Crimea 9512 MISSED Southern Small Town (10k) Declining but less than national average . Miusynsk Luhansk 4830 MISSED Eastern Small Town (10k) Declining more than national average . Belz Lviv 2343 MISSED Western Small Town (10k) Declining but less than urban average . ANNEX V List of Ukrainian Cities 173 Ukraine_2015_nov26.indd 173 2015-11-26 5:14 PM
  • 196.
    City Oblast Typology 2 Population 2013 Typology 1 Region SizePopulation growth Typology 3 Ostroh Rivne 15725 MISSED Western Mid size towns (10k - 20k) Positive growth . Tavriysk Kherson 11001 FOUND Southern Mid size towns (10k - 20k) Declining but less than urban average . Ulianovka Kirovohrad 6109 MISSED Central Mid size towns (10k - 20k) Declining more than national average . Tysmeny tsia Ivano- Frankivsk 9497 APPEAR Western Small Town (10k) Declining but less than urban average . Bylbasivka Donetsk 6310 FOUND Eastern Small Town (10k) Declining more than national average . Rakhiv Zakarpattia 15243 MISSED Western Mid size towns (10k - 20k) Positive growth . Zdolbuniv Rivne 24569 FOUND Western Large towns (20k - 50k) Declining but less than urban average . Pereshche pyne Dnipro petrovsk 10178 MISSED Southern Small Town (10k) Positive growth . Prymorsk Zaporizhia 12208 MISSED Southern Mid size towns (10k - 20k) Declining but less than national average . Monasty ryshche Cherkasy 9040 MISSED Central Mid size towns (10k - 20k) Declining but less than urban average . Vakhrusheve Luhansk 11878 MISSED Eastern Mid size towns (10k - 20k) Declining more than national average . Kodyma Odessa 8865 MISSED Southern Mid size towns (10k - 20k) Declining more than national average . Horodysche Cherkasy 14291 MISSED Central Mid size towns (10k - 20k) Declining more than national average . Kiliya Odessa 20606 MISSED Southern Large towns (20k - 50k) Declining more than national average . Hola Prystan Kherson 14870 MISSED Southern Mid size towns (10k - 20k) Declining more than national average . Zinkiv Poltava 9953 MISSED Central Mid size towns (10k - 20k) Declining but less than national average . Dubliany Lviv 10240 FOUND Western Small Town (10k) Positive growth . Sudova Vyshnia Lviv 6461 MISSED Western Small Town (10k) Declining but less than urban average . ANNEX V List of Ukrainian Cities 174 Ukraine_2015_nov26.indd 174 2015-11-26 5:14 PM
  • 197.
    City Oblast Typology 2 Population 2013 Typology 1 Region SizePopulation growth Typology 3 Nosivka Cernihiv 14077 MISSED Central Mid size towns (10k - 20k) Declining more than national average . Putyvl Sumy 16317 MISSED Central Mid size towns (10k - 20k) Declining but less than national average . Novyi Kalyniv Lviv 4105 MISSED Western Small Town (10k) Positive growth . Irpin Kiev 42924 FOUND Central Large towns (20k - 50k) Positive growth . Rozhyshche Volhynia 13327 MISSED Western Mid size towns (10k - 20k) Declining but less than urban average . Dobromyl Lviv 4457 MISSED Western Small Town (10k) Declining more than national average . Perechyn Zakarpattia 6716 MISSED Western Small Town (10k) Declining but less than urban average . Zhashkiv Cherkasy 14234 MISSED Central Mid size towns (10k - 20k) Declining more than national average . Valky Charkiv 9410 MISSED Eastern Mid size towns (10k - 20k) Declining more than national average . Pervoma iskyi Charkiv 31061 FOUND Eastern Large towns (20k - 50k) Declining but less than urban average . Nova Odesa Mykolaiv 12298 MISSED Southern Mid size towns (10k - 20k) Declining more than national average . Novo druzhesk Luhansk 7749 FOUND Eastern Mid size towns (10k - 20k) Declining more than national average . Ananiv Odessa 8614 MISSED Southern Mid size towns (10k - 20k) Declining more than national average . Hlobyne Poltava 10043 DIS APPEAR Central Mid size towns (10k - 20k) Declining more than national average . Dolynska Kirovohrad 19420 FOUND Central Mid size towns (10k - 20k) Positive growth . Pohre byshche Vinnytsia 9898 MISSED Central Mid size towns (10k - 20k) Declining more than national average . Baturyn Cernihiv 2716 MISSED Central Small Town (10k) Declining more than national average . Ukrainka Kiev 15644 FOUND Central Mid size towns (10k - 20k) Positive growth . ANNEX V List of Ukrainian Cities 175 Ukraine_2015_nov26.indd 175 2015-11-26 5:14 PM
  • 198.
    City Oblast Typology 2 Population 2013 Typology 1 Region SizePopulation growth Typology 3 Derhachi Charkiv 18154 FOUND Eastern Large towns (20k - 50k) Declining more than national average . Vyshneve Kiev 37457 FOUND Central Large towns (20k - 50k) Positive growth . Semenivka Cernihiv 8476 MISSED Central Mid size towns (10k - 20k) Declining more than national average . Bilytske Donetsk 8691 MISSED Eastern Mid size towns (10k - 20k) Declining more than national average . Tarashcha Kiev 11410 MISSED Central Mid size towns (10k - 20k) Declining more than national average . Irshava Zakarpattia 9221 MISSED Western Small Town (10k) Declining but less than urban average . Bohuslav Kiev 16825 MISSED Central Mid size towns (10k - 20k) Declining but less than urban average . Ichnia Cernihiv 11587 MISSED Central Mid size towns (10k - 20k) Declining more than national average . Seredyna- Buda Sumy 7231 MISSED Central Small Town (10k) Declining but less than urban average . Novoazovsk Donetsk 11760 MISSED Eastern Mid size towns (10k - 20k) Declining more than national average . Tetiiv Kiev 13329 MISSED Central Mid size towns (10k - 20k) Declining more than national average . Tatarbunary Odessa 10992 MISSED Southern Mid size towns (10k - 20k) Positive growth . Vyzhnytsia Cernivcy 4207 MISSED Western Small Town (10k) Declining more than national average . Stebnyk Lviv 20993 FOUND Western Large towns (20k - 50k) Positive growth . Berestechko Volhynia 1752 MISSED Western Small Town (10k) Declining more than national average . Rubizhne Luhansk 60374 FOUND Eastern Small cities (50k - 100k) Declining more than national average . Molochansk Zaporizhia 6980 MISSED Southern Small Town (10k) Declining more than national average . Makiivka Donetsk 353918 FOUND Eastern Mid size cities (100k - 500k) Declining more than national average . ANNEX V List of Ukrainian CitiesANNEX V List of Ukrainian Cities 176 Ukraine_2015_nov26.indd 176 2015-11-26 5:14 PM
  • 199.
    City Oblast Typology 2 Population 2013 Typology 1 Region SizePopulation growth Typology 3 Beryslav Kherson 13187 MISSED Southern Mid size towns (10k - 20k) Declining more than national average . Pidhorodne Dnipro petrovsk 19498 FOUND Southern Mid size towns (10k - 20k) Positive growth . Yampil Vinnytsia 11300 MISSED Central Mid size towns (10k - 20k) Declining but less than urban average . Ukrainsk Donetsk 11994 MISSED Eastern Mid size towns (10k - 20k) Declining more than national average . Dymytrov Donetsk 49646 FOUND Eastern Small cities (50k - 100k) Declining more than national average . Merefa Charkiv 22280 FOUND Eastern Large towns (20k - 50k) Declining more than national average . Vuhlehirsk Donetsk 7868 FOUND Eastern Mid size towns (10k - 20k) Declining more than national average . Perevalsk Luhansk 25941 FOUND Eastern Large towns (20k - 50k) Declining more than national average . Bucha Kiev 28483 FOUND Central Large towns (20k - 50k) Declining but less than urban average . Shakhtarsk Donetsk 51007 FOUND Eastern Small cities (50k - 100k) Declining more than national average . Almazna Luhansk 4325 FOUND Eastern Small Town (10k) Declining more than national average . Pavlohrad Dnipro petrovsk 110070 FOUND Southern Mid size cities (100k - 500k) Declining more than national average . Novomyr horod Kirovohrad 11569 MISSED Central Mid size towns (10k - 20k) Declining more than national average . Uhniv Lviv 1007 MISSED Western Small Town (10k) Declining but less than urban average . Lozova Charkiv 58307 FOUND Eastern Small cities (50k - 100k) Declining more than national average . Sloviansk Donetsk 117445 FOUND Eastern Mid size cities (100k - 500k) Declining but less than national average . Rohatyn Ivano- Frankivsk 8077 MISSED Western Small Town (10k) Declining but less than national average . Illintsi Vinnytsia 11366 MISSED Central Mid size towns (10k - 20k) Positive growth . ANNEX V List of Ukrainian CitiesANNEX V List of Ukrainian Cities 177 Ukraine_2015_nov26.indd 177 2015-11-26 5:14 PM
  • 200.
    City Oblast Typology 2 Population 2013 Typology 1 Region SizePopulation growth Typology 3 Vatutine Cherkasy 17563 FOUND Central Large towns (20k - 50k) Declining more than national average . Truskavets Lviv 29516 FOUND Western Large towns (20k - 50k) Declining but less than urban average . Chuhuiv Charkiv 32279 FOUND Eastern Large towns (20k - 50k) Declining more than national average . Awdijivka Donetsk 35128 FOUND Eastern Large towns (20k - 50k) Declining but less than urban average . Boryslav Lviv 34938 FOUND Western Large towns (20k - 50k) Declining more than national average . Zolote Luhansk 14572 MISSED Eastern Large towns (20k - 50k) Declining more than national average . Horodenka Ivano- Frankivsk 9386 MISSED Western Mid size towns (10k - 20k) Declining but less than urban average . Tiachiv Zakarpattia 9162 MISSED Western Mid size towns (10k - 20k) Declining more than national average . Halych Ivano- Frankivsk 6290 MISSED Western Small Town (10k) Declining but less than urban average . Bershad Vinnytsia 13160 MISSED Central Mid size towns (10k - 20k) Declining but less than urban average . Molodo hvardiysk Luhansk 23332 DIS APPEAR Eastern Large towns (20k - 50k) Declining more than national average . Pidhaitsi Ternopil 2866 MISSED Western Small Town (10k) Declining more than national average . Koriukivka Cernihiv 13161 MISSED Central Mid size towns (10k - 20k) Declining more than national average . Tlumach Ivano- Frankivsk 8829 MISSED Western Small Town (10k) Declining but less than urban average . Zhdanivka Donetsk 12352 FOUND Eastern Mid size towns (10k - 20k) Declining more than national average . Derazhnia Khmelnytskyi 10317 MISSED Western Mid size towns (10k - 20k) Declining but less than urban average . Vuhledar Donetsk 15357 MISSED Eastern Mid size towns (10k - 20k) Declining more than national average . Dobropillia Donetsk 31196 MISSED Eastern Large towns (20k - 50k) Declining more than national average . ANNEX V List of Ukrainian Cities 178 Ukraine_2015_nov26.indd 178 2015-11-26 5:14 PM
  • 201.
    City Oblast Typology 2 Population 2013 Typology 1 Region SizePopulation growth Typology 3 Berezne Rivne 13444 MISSED Western Mid size towns (10k - 20k) Declining but less than urban average . Alupka Crimea 8520 MISSED Southern Mid size towns (10k - 20k) Declining but less than urban average . Hertsa Cernivcy 2122 MISSED Western Small Town (10k) Positive growth . Bibrka Lviv 3829 MISSED Western Small Town (10k) Declining but less than urban average . Kamianka- Dniprovska Zaporizhia 13495 MISSED Southern Mid size towns (10k - 20k) Declining more than national average . Yenakiieve Donetsk 82629 FOUND Eastern Mid size cities (100k - 500k) Declining more than national average . Oleksan drivsk Luhansk 6635 FOUND Eastern Small Town (10k) Declining but less than national average . Tulchyn Vinnytsia 15849 MISSED Central Mid size towns (10k - 20k) Declining but less than urban average . Radyvyliv Rivne 10508 MISSED Western Mid size towns (10k - 20k) Positive growth . Kopychyntsi Ternopil 6890 MISSED Western Small Town (10k) Declining but less than urban average . Sviatohirsk Donetsk 4654 DIS APPEAR Eastern Small Town (10k) Declining more than national average . Chyhyryn Cherkasy 9371 MISSED Central Mid size towns (10k - 20k) Declining more than national average . Vylkove Odessa 8480 MISSED Southern Mid size towns (10k - 20k) Declining more than national average . Khyriv Lviv 4088 MISSED Western Small Town (10k) Declining more than national average . ANNEX V List of Ukrainian Cities 179 Ukraine_2015_nov26.indd 179 2015-11-26 5:14 PM
  • 202.
    Annex VI Extensive Growth Extensivechange refers to the change in brightness in the urban periphery. The periphery is usually defined as the area surrounding the urban core that was not considered as urban by NL standards in the initial period but becomes “urban” in T1. However, the periphery takes another interpretation when urban footprints are shrinking. In this case extensive change is interpreted as the change in NLs in the disappearing footprint. The interpretation in this case, which is the most common case in Ukraine, is not as straightforward as the interpretation of the other indicators used in the section, and hence the analysis of extensive change was moved to this appendix. The following figure and equations explain the way this indicator is calculated. Figure 1 – Urban footprint, intensive and extensive change using NLs (1996-2010) • Intensive change = Y – A • Extensive change = (B – Y) – (Z – A) • Area Change = B – A • Area Change % = (B – A) / A ANNEX VI Extensive Growth 180 CITY FOOTPRINT (1996 - 2010) T0NTL A Z T0footprint T1footprint The columns represent the summed nighttime lights values for the identified footprint T1NTL Y B Ukraine_2015_nov26.indd 180 2015-11-26 5:14 PM
  • 203.
    The following figurecompare intensive versus extensive change over the 1996-2010 period and using the same color coding as the group types mentioned before (Group 1, 2 3). Figure 2 – Intensive vs extensive change (without outliers) ANNEX VI Extensive Growth 181 Ukraine_2015_nov26.indd 181 2015-11-26 5:14 PM
  • 204.
    The following tableextends the analysis in the text by dividing cities further based on whether they present positive or negative extensive growth. Growing urban footprint Shrinking urban footprint - Extensive growth Dimming periphery + Extensive growth Growing light intensity in periphery - Extensive growth Dimming shrinking footprint + Extensive growth Growing light intensity in shrinking footprint + Intensive growth Growing light intensity in the urban core Type 1: Thriving urban core, expanding urban footprint Thriving urban core, shrinking urban footprint Growing economic activity focused in the core: increased economic activity in the urban center. The new periphery, despite increasing in area, experienced a decline in economic activity as captured by night lights. Examples: no examples in Ukraine found A. Growing economic activity in the core and periphery: the urban footprint has expanded and economic activity as captured by night lights has increased both in the urban core and the expanding periphery. Examples: Odessa, Lutsk, Kiev, Kharkov, Lviv. Examples: no examples in Ukraine found F. Examples: Donetsk,Zaporizhia - Intensive growth Declining light intensity in the urban core Type 3: Dimming core, expanding area Type 2: Dimming core, shrinking area C. Declining economic activities in the core and periphery while increasing urban footprints: despite a spreading out of the urban footprint, economic activity is declining in the core and in the new larger periphery. Examples: Mykolaiv, Sumy, Kirovohrad. E. Declining economic activities in the core, growing area with stronger peripheries: activity has been transferred from the core to the periphery. Examples: Torez, Borshchiv, Ostroh. B. Declining in all aspects: these cities have decreased their economic activity both in the core in the shrinking footprint. Examples: Dnepropetrovsk, Hirnyk, Kramatorsk. D. Activity shifted to the periphery: activity in the core has declined but economic growth has occurred in shrinking footprint. Examples: Donetsk, Balta, Vuhledar. Table 1 - Description of the different types that uses extensive growth ANNEX VI Extensive Growth 182 Ukraine_2015_nov26.indd 182 2015-11-26 5:14 PM
  • 205.
    152 Defined byurban NL measurements per capita. Growing area Shrinking area - Extensive growth + Extensive growth - Extensive growth + Extensive growth + Intensive growth Type 1: Thriving core, expanding area Mean (Std dev) Thriving core, shrinking area Mean (Std dev) A F Population 2013 (000s) 124.8 (363.2) 861 (129) Average annual Population growth (‘89-’13) 124.8 (363.2) -0.59% (0.041) Total NLs value (000s of NLs units) in 2010. 148 9.40 (32.40) 69.11 (44.80) Total NLs value (000s of NLs units) per cap (2010). 0.067 (.032) 0.077 (0.048) NLs growth (% Growth of NLs units) (1996-2010) 587% (22.46) 142.6% (1.23) - Intensive growth Type 3: Dimming core, expanding area Mean (Std dev) Type 2: Dimming core, shrinking area Mean (Std dev) C E B Population 2013 (000s) 76.3 (88.3) 50.8 (94.4) 79.2 (181.2) 152.3 (399.8) Average annual Population growth (‘89-’13) -0.57% (.454) -0.44% (.566 -0.70% (.614) -0.69% (.256) Total NLs value (000s of NLs units) in 2010. 6.16 (5.49) 3.23 (7.40) 4.50 (12.95) 10.41 (27.25) Total NLs value (000s of NLs units) per cap (2010). 0.017 (.012) 0.053 (.030) 0.044 (.03) 0.055 (.065) NLs growth (% Growth of NLs units) (1996-2010) -7.7% (.056) 39.4% (.624) -61.5 % (.24) -30.4% (.20) Table 2 – Typology of cities based on NL observations over 1996 2010: selected statistics ANNEX VI Extensive Growth 183 Ukraine_2015_nov26.indd 183 2015-11-26 5:14 PM
  • 206.
    By adding extensivegrowth to the previously used intensive growth and area change, the following five city typologies emerge when (A) THRIVING AND SPRAWLING153 CITIES, Growing economic activity in the core and periphery: the urban footprint has expanded and economic activity as captured by night lights has increased both in the urban core and the expanding periphery. These are mainly large cities (average population is 124.8k) and although – on average – they are still experiencing demographic decline, their decline is the lowest compared to the other types. They present also the highest levels of economic activity per capita suggesting that these cities are more productive. In addition, these cities have a higher average total economic growth (587 percent) than the rest suggesting that these are true growth engines in the country. However, the growth of the urban footprint accompanied by the observed demographic decline suggests that these cities are sprawling. Examples of TYPE A are: Odessa, Lutsk, Kiev, Kharkov and Lviv. Around 24 percent of cities in Ukraine fall under this type. On the other side of the spectrum cities that are declining economically are found; (B) ABSOLUTE DECLINE – COMPACT, These are cities declining in all aspects with a decreasing economic activity in the core and periphery and shrinking footprint: These cities are smaller than thriving cities - the average population is 79.2k. In addition to experiencing a decline in economic activity, these cities have the fastest declining population – with -0.70 percent annual decline on average and have lowers levels of productivity than thriving cities measured by NL per capita. Examples of TYPE B are: Dnepropetrovsk, Hirnyk and Kramatorsk. Around 33 percent of cities in Ukraine fall under this type. (C) ABSOLUTE DECLINE AND SPRAWLING, These cities have experienced economic decline in the urban core and periphery despite a growth of the urban footprint. These cities also present the lowest level of productivity and have fast declining population – with -0.57 percent annual decline on average. The growth of the urban footprint accompanied by the observed demographic decline suggests that these cities are sprawling. Examples of TYPE C are: Mykolaiv, Sumy, Kirovohrad. Around 5.47 percent of cities in Ukraine fall under this type. A third set of cities are those whose urban core has experienced economic decline that was partly compensated through growth in expanding or shrinking areas; (D) DECLINING CENTERS but INCREASED ACTIVITY IN SHRINKING AREA, These cities are experiencing a declining in economic activity in the initial urban core and a shrinking urban footprint but increased economic activity in shrinking footprint. These cities, although rare, have dying centers but economic activity has been catching up in the shrinking footprint. Demographic decline is similar to the one observed in absolute declining cities but productivity – measured as NL per capita – is higher. Examples of TYPE D are: Donetsk, Balta, Vuhledar. Around 2.84 cities in Ukraine fall under this type. (E) DECLINING CENTERS but INCREASED ACTIVITY IN GROWING URBAN FOOTPRINT, These cities have experienced economic decline in the urban core but increased economic activity in the growing urban footprint. These cities, although rare, have dying centers but growing economic activity in the periphery and present overall a positive economic growth – on average. These cities are small – having on average 50.8k population – and have productivity levels similar to those in TYPE D. Examples of TYPE E are: Torez, Borshchiv, Ostroh. Around 6.13 percent of cities in Ukraine fall under this type. 153 Sprawling is a hypothesis based on the growth of the urban footprint and population decline. However the NL footprints do not correspond to the city’s boundaries and therefore population data might not correspond to the population living inside the urban footprint defined through NLs. ANNEX VI Extensive Growth 184 Ukraine_2015_nov26.indd 184 2015-11-26 5:14 PM
  • 207.
    (F) GROWING LIGHTINTENSITY IN SHRINKING FOOTPRINT. These cities have experienced economic growth despite dimishing areas, which in both examples found also imply declining population. The only two cities found in this category are Donetsk and Zaporizhia, which are an agglomeration in the Eastern region and a single city in the Southern respectively. In the same way most of the Thriving cities (A – in BLUE) are located in the Western and Central regions while most of the absolute declining (B and C) settlements are located in the Southern and Eastern Region. Figure 3 - Distribution of city typologies across economic regions ANNEX VI Extensive Growth 185 100% 90% 80% 70% 60% 50% 40% 30% 20% 10% 0% Western Central Southern Eastern A - Thriving and sprawling C - Absolute decline - sprawling B - Absolute decline/compact E - Declining centers increased activity in growing footprint D - Declining centers increased activity in shrinking area Ukraine_2015_nov26.indd 185 2015-11-26 5:14 PM
  • 208.
    Annex VII Assignment ofExpenditure Responsibilities in The Budget Code Oblast District Sub-district Voluntary Public administration Own staff Own staff Own staff Local debt Defense none none none mobilization training of local significance Public order, safety and judicial authority none none none none Economic affairs none none none local-significance roads; transportation and road infrastructure; regulation of passenger fares; land use regulation Environmental protection activity none none none environmental protection events of local significance Housing and municipal economy none none none local housing and utilities development, populated area improvement Healthcare specialized care, sanatoriums medical and sanitary education programs; other activity in the health protection system Out-patients’ clinics, ambulance departments, ambulance and first aid stations; primary care, medical and sanitary education programs none none Physical and intellectual development system sports schools for children and young people, physical culture and sports-based rehabilitation of the disabled people, culture and sports events, libraries, museums and exhibitions, philharmonic societies, musical ensembles, theatres, culture palaces and houses sports schools for children and youth of all types, physical culture and sports events and organizations; cultural/ education and theatrical/show programs (theatres, rayon (city), libraries or centralized libraries of the centralized rayon (city) library system, museums, exhibitions, culture palaces and houses, aesthetic education schools for children; zoos palaces and houses of culture, clubs, entertainment centers, other clubs and libraries community-owned zoos ANNEX VII Assignment of Expenditure Responsibilities in The Budget Code 186 Ukraine_2015_nov26.indd 186 2015-11-26 5:14 PM
  • 209.
    Oblast District Sub-districtVoluntary Education General secondary education system for individuals with special needs; Vocational training system; Higher education; Postgraduate education system; Out-of-school education system and establishments for non- school activity of children; Other establishments and initiatives in the national education system Pre-school education system; General secondary education system; continuing education; Out-of-school education system and establishments for non- school activity of children; Other establishments and initiatives in the national education system Pre-school education system extracurricular education Social protection and social security system fulfillment of allowances and other entitlements for disabled; fulfillment of allowances and other entitlements for orphans disabled children social rehabilitation centers; disabled people professional rehabilitation centers, shelters for children, the centers of the socio- psychological rehabilitation of children and social dormitories for orphan children and children deprived of parental care; implementation of the state policy in respect of children, young people, women and families assistance to families with children, poor families, people disabled since childhood, disabled children, temporary state assistance to children; additional payments to the population for the coverage of the utilities expenses (housing subsidies for the population), support to the housing construction (rehabilitation) for certain categories of individuals; compensations to individuals rendering social services to senior citizens, the disabled, disabled children, outpatients unable to take care of themselves and requiring outside assistance: benefits for special categories of individuals none social protection for poor students of vocational education establishments; social protection establishments for homeless individuals; utility rates subsidized through local council decision; centers of the social adaptation of individuals released from penitentiary institutions; reduced fares granted to certain categories of individuals ANNEX VII Assignment of Expenditure Responsibilities in The Budget Code 187 Ukraine_2015_nov26.indd 187 2015-11-26 5:14 PM
  • 210.
    Annex VIII Summary ofUrban Spatial Planning Legislation Law/Act with access address and date of approval Core objectives Elements relevant to urban planning and spatial policy Fundamental legislation Civil Code #435-15, 16.01.2003 Regulates personal property and non-property ownership rights and relationships among different stakeholders on the basis of principles of judicial equality, freedom of action and independence of ownership. It does not cover the aspects of ownership rights emerging as a result of administrative subordination, execution of power and budgetary relationships. › Stipulates rights of private ownership, including property, and measures to protect these rights. › Provides legal basis for concluding and implementing civil agreements (contracts), their enforcement and procedures for restoring abused rights of ownership. Land Code #2768-14, 25.10.2001 Regulates issues of land property and relations among various stakeholders in managing, transferring and owning the land resources of Ukraine. › Stipulates rights and responsibilities of central, regional and local authorities in managing land resources. › In particular determines that the right to change the borders of rayons and cities, as well as change the status of the most valuable land resources belongs to the parliament of Ukraine. › Stipulates separately the rights and responsibilities of each tier of territorial government in land management, appropriation, sale, purchase and rent of state, communal and private land plots. › Stipulates nine different types of land plots depending on the core use, including housing and communal building, as well as the procedures for change of main use. Law on Local Self‑Government 280/97-вр, 21.05.1997 Stipulates the system of self-government in Ukraine, basic principles and guarantees of self-government, its organisation and activities, legal status and responsibilities of local self- government institutions and personalities › Defines the authorities and responsibilities of self- government bodies, among others, in the sphere of managing communal property, land ownership, land use and management (including the right to setup the level of land use tax), urban planning, construction, housing. › Stipulates what territorial community is in the territorial-administrative arrangement, what are its rights, including land and property ownership, principles of functioning of representative elected bodies and individuals (councils and mayors), executive bodies of the councils. › Defines the rights to unite with other territorial communities, create self-organised bodies by community members, organise public hearings. ANNEX VIII Summary of Urban Spatial Planning Legislation 188 Ukraine_2015_nov26.indd 188 2015-11-26 5:14 PM
  • 211.
    Law/Act with access addressand date of approval Core objectives Elements relevant to urban planning and spatial policy Law on the Fundamentals of State Regional Policy #156-19, 05.02.2015 Stipulates legal, economic, social, environmental, humanitarian and organisational fundamentals of state regional policy as an integral element of Ukraine’s domestic policy. › Defines the principles of regional development, which among other includes subsidiarity – transfer of responsibilities to the lowest possible territorial level of governance. › Defines the role of local and regional self-government bodies in formulation and implementation of regional policy on their respective territories. Sector-specific legislation Law on Amendments to Certain Laws of Ukraine on Regulation of City Building Activities and State Construction and Architectural Control #1546, approved on 9.04.2015 but is still awaiting President’s signature (as of 10 April 2015) Stipulates framework for decentralising the authorities in the sphere of building, architectural and construction activities, their monitoring, control over compliance. › Envisages transfer of responsibilities for (1) issuing construction permits and land use permits; (2) architectural and construction control; and (3) approval of complete construction objects from oblast state administrations to executive bodies of city, rayon and village councils where respective land plots and buildings are located (with some exceptions). › Stipulates reduction of the number of days for obtaining necessary technical documentation for construction works. › Removes the limitation to use only specialists of scientific research and engineering institutions accredited by the MinRegion for architecture and construction control. Law on Master Scheme of Territorial Planning of Ukraine #3059-14, 07.07.2002 Stipulates the terms and conditions of use of the territory of Ukraine, responsible authorities for developing General Scheme, its implementation, monitoring and control. Includes maps and text, which explains current spatial organisation of economic, social and environmental systems and presents priorities for development until 2020. › Outlines priorities and conceptual decisions about planning and use of territory of Ukraine, including improving the settlement system, development of industrial, social, engineering and transport infrastructure, creation of national environmental network etc. › Defines four types of territories in Ukraine, including urbanisation zones, which require (strict) regulation of construction and zoning. ANNEX VIII Summary of Urban Spatial Planning Legislation 189 Ukraine_2015_nov26.indd 189 2015-11-26 5:14 PM
  • 212.
    Law/Act with access addressand date of approval Core objectives Elements relevant to urban planning and spatial policy Law on Regulation of City Construction Activity #3038-17, 17.02.2011 Stipulates legal and organisational fundamentals of city construction activities. Ensures that these are congruent with the objectives of sustainable development of territories; with state, communal and private interests. › Defines terminology of city construction activities, including master plan, detailed plans of territories, zoning, suburban territories etc. Regulates procedures for preparation of project documentation, ensuring continuous oversight and control over construction activities according to technical, architectural and land use standards defined for each individual city by its self- governing bodies. › Stipulates that city planning and construction should be aimed at creating rational system of settlement, balanced use of territory that combines housing and communal buildings, industrial, recreational, cultural, and environmentally important and protected areas. › Divides responsibilities among different tiers and branches of power (see the most recent Law #1546 above). › Requires obligatory publication of all planning documentation, including online (with the exceptions of secret and restricted information). › Requires obligatory preparation of master plans for ALL cities, settlements and villages of Ukraine, which is the condition for taking any decisions in the area of land ownership transfer and management. Law on Architectural Activity #687-14, 20.05.1999 Stipulates legal and organisational fundamentals of architectural activities and aimed at creating beneficial life environment, achieving aesthetical distinctiveness, economic expediency, reliability of buildings and constructions. › Defines standards and principles of architectural activities towards all objects, including buildings and constructions of all purposes and ownership types, landscapes, specific areas and territorial-administrative units. › Defines standards and principles for preparing necessary documentations and drawings, maintaining high standards of technical, architectural and engineering expertise, actual construction of the objects, their acceptance, monitoring compliance with technical and other standards, activities of self-regulated professional organisations in the sphere etc. ANNEX VIII Summary of Urban Spatial Planning Legislation 190 Ukraine_2015_nov26.indd 190 2015-11-26 5:14 PM
  • 213.
    Law/Act with access addressand date of approval Core objectives Elements relevant to urban planning and spatial policy Law on Complex Reconstruction of Outdated Housing Estates (Neighbourhoods) #526- 16, 22.12.2006 Stipulates legal, economic, social and organisational aspects of complex reconstruction of outdated housing estates (neighbourhoods) with the substitution of dilapidated residential and non-residential housing stock. › Determines the notion of dilapidated residential housing – with the amortisation level above 60%. › Determines the procedures for guaranteeing property rights in the process of complex reconstruction of outdated and dilapidated housing stock requiring resettlement of residents to temporary and/or permanent new housing. › Defines responsibilities of central government institutions and local self-governments. The latter, among others, is responsible for preparing complex master plans of reconstruction of estates with outdated housing, conduction competitive tenders for selection of investor and construction company, managing all relations with the residents of estates due for reconstruction, including dispute resolution. Law on Land Planning #858-15, 22.05.2003 Stipulates legal and organisational fundamentals of land management and regulates relationships among state government institutions, self-government, physical and judicial persons aimed at achieving the standards of sustainable land use. › Defines priorities for land use and stipulates responsibilities for central government and regional/ local self-governments to adhere to those, especially in terms of prioritisation of protection of agrarian lands, setting and monitoring environmental standards; › Defines responsibilities for actual management of land allocation for all types of owners across all types of settlements, including cities. Law on State Land Cadastre #3613-17, 07.07.2011 Establishes State Land Cadastre as Ukraine’s single GIS system that contains information about all land plots regardless their ownership and type of use. › Defines the principles and procedures for registering land plots of different types of ownership and land use; as well as requirements for information for each land plot that should be gathered, classified, presented in GIS form and published with open access. › Stipulates free public access to information in Land Cadastre. It includes online access to the entire database, which was launched in 2013 at the address http://map.land.gov.ua/ ANNEX VIII Summary of Urban Spatial Planning Legislation 191 Ukraine_2015_nov26.indd 191 2015-11-26 5:14 PM
  • 214.
    Law/Act with access addressand date of approval Core objectives Elements relevant to urban planning and spatial policy Relevant legislation in adjacent spheres Law On Information, #2657-XII, 02.10.1992 Regulates relationships for creating, collecting, obtaining, storing, using, sharing, protecting and securing information; stipulates core principles and mechanisms of state information policy. › Stipulates universal right on free access to information, its use, sharing, storing, protecting and securing, except when information is classified as confidential, secret or for internal use only; › Defines the obligation for all government agencies to inform public and mass media about its activities and decisions; › Obliges government agencies to create special units responsible for ensuring access to the information. Law on Public Access to Information #2939-VI, 13.01.2011 Introduces procedures for ensuring the universal right for public access to information produced by authorities at different tiers, as well as by other providers of publicly significant information. › Stipulates obligations of state authorities to publish information – proactively or reactively; as well as mechanisms, timeframe and costs related to disclosure; › Sets up clear limitations when information cannot be disclosed and procedures for communicating these limitations to the public; › Defines procedure for substantiating the refusal to release information in the public domain (three-stage test). Presidential Decree on Provision of Public Access to Information by the Executive Power agencies #547, 05.05.2011 Regulates public access to information produced and administered by the executive power authorities › Stipulates forms and procedures, timeframe for disclosing information in the public domain; › Standards of dealing with information requests and appeals for all executive power agencies. Decree of the Cabinet of Ministers on Ensuring Public Participation in Formulation and Implementation of State Policy #996, 03.11.2010 Established mechanisms for public participation in developing, implementing and monitoring state policies. › Sets up typical procedure for establishing and functioning of Public Councils, their responsibilities and rights; › Defines mechanisms for public consultations, survey of public opinions, submitting proposals, recommendations and complaints; › Stipulates mechanisms for organising public hearings. ANNEX VIII Summary of Urban Spatial Planning Legislation 192 Ukraine_2015_nov26.indd 192 2015-11-26 5:14 PM
  • 215.
  • 216.
    Annex IX Summary ofPlanning Stakeholders Legislative Parliament has authority to develop and approve legislation governing all spheres.154 It has to vote on any decisions with regard to local elections, status and responsibilities of different tiers of public administration and self-government, changes in the borders of administrative units, including cities, budgetary allocation etc. Two committees of Verkhovna Rada are responsible for developing and submitting legislation in the sphere of urban planning, spatial development and housing. These are: 1. Committee for Construction, Urban Planning, and Communal Housing 2. Committee for State Construction, Regional Policy, and Local Self-Government Executive – central level Ministry of Regional Development, Construction and Housing (MinRegion) is responsible for developing and implementing policies and regulations in the spheres of territorial-administrative organization and self-government, construction, spatial planning, housing and communal services. It is led by the Minister who is at the same time Vice Prime Minister of the Cabinet, with the responsibility of introducing e-government and development of territories of Ukraine affected by the security crisis. MinRegion has a range of state agencies/services under its jurisdiction, among which the most crucial are: • State Architectural and Construction Inspection (SACI) which is responsible for implementing policy of state architectural and construction control and oversight; issues permits for various types of planning and construction works; issues licenses for professional market operators. Has 25 regional offices. • State Service of Geodesy, Cartography and Cadastre (created as a result of merger of State Agency of Land Resources and Cartography Agency in 2015) which is responsible for land management functions, evaluation of value and technical characteristics of land plots, expertise and environmental protection, managing State Land Cadastre and database of valid expert organisations and individuals with technical skills in land survey and management. It has 557 regional departments across all regions of Ukraine. Currently the State Service is in the process of changing all heads of oblast and rayon offices as one of the steps aimed at reducing large-scale corruption. Ministry of Economic Development and Trade is responsible for state regional policy and overall economic policy, performs monitoring of the development of Ukrainian regions, as well as development of deprived territories (that include monofunctional cities), provides administrative, organizational support and expertise in preparation of socio-economic strategies for oblasts, ARC and cities of state significance. The Ministry is responsible for implementation of the State Strategy for Regional Development 2020 (approved by the Cabinet in August 2014), which recognizes the importance of the network of large cities for enhancing the competitiveness of national economy. It is also responsible, together with MinRegion, for implementation of the Law on Fundamentals of State Regional Policy (February 2015). Ministry of Culture is responsible, among other things, for developing and implementing policy in the area of protecting national cultural heritage. It includes Department for Protection of Cultural Architectural Heritage, that is crucial agency for agreeing and issuing 154 According to Ukrainian legislation, initiators/authors of the law could be both MPs and executive power – Cabinet of Ministers. All draft legislator acts developed by executive agencies, for example MinRegion, have to be approved by the Cabinet of Ministers before submission to the Verkhovna Rada. ANNEX IX Summary of Planning Stakeholders 194 Ukraine_2015_nov26.indd 194 2015-11-26 5:14 PM
  • 217.
    permits for constructionand development activities in the areas with special cultural and historical status (e.g. UNESCO site, architectural national reserve etc) and in adjacent areas. Ministry of Ecology and Natural Resources of Ukraine is responsible, among other things, for developing and implementing policy in the area of protecting environment, air, water, land resources including designating the land use and establishing restriction in use of land and other resources. Ministry of Infrastructure of Ukraine is responsible, among other things, for developing and implementing policy in the area of development and maintenance of infrastructure, use of land and construction of buildings on land that belongs to road and other infrastructural objects. Legislative and executive power agencies – regional and local level Oblast and rayon state administrations, including regional representative offices of national agencies and ministries, such as Territorial Architectural and Construction Inspections (property, construction, planning), as well as oblast, city and rayon departments of State Service of Geodesy, Cartography and Cadastre (land allocation, planning and management); oblast departments of economic development. They are responsible for implementing national legislation and regulations at oblast and rayon level, for ensuring oversight and monitoring over execution, providing a range of administrative services in the areas of urban development, architecture, planning, land management etc. Oblast and rayon councils are self-government bodies elected every 5 years. They are responsible for developing policies at oblast and rayon tiers according to the authorities granted to them by the Constitution and the Law on Local Self- Government, approving budgets, special programs and project of development, managing assets belonging to the oblast and rayon community. They do not have their own executive committees and delegate ALL executive functions to state administrations at oblast and rayon levels (see above). City councils and their executive committees are legislative bodies at city level with their own executive bodies elected every 5 years. City mayors are directly elected local politicians (with 5 years term of service) who are leading executive committees of the councils. These bodies are responsible for developing and implementing local socio-economic and other policies in the boundaries of their respective cities. Other Organizations Three state scientific and research institutes in the area of urban planning are responsible for preparing master plans for oblasts, rayons and cities of Ukraine, zoning plans and detailed territory plans; providing expertise for monitoring and oversight of their implementation as stipulated by specific national and local level regulations. These are: 1. Scientific Research Institute Dipromisto 2. Scientific Research Institute of City Construction 3. State Company “Ukrainian State Scientific Research and Planning Institute of Civil Construction” City of Kyiv has its own communal enterprise Institute of Master Plan of Kyiv. It is responsible for development, implementation and monitoring of execution of Kyiv Master Plan, as well as zoning plans and detailed plans of territories, other urban planning documentation, planning of engineering infrastructure. Association of Ukrainian Cities (AUC) is one of the most influential lobbying platforms in Ukraine that brings together mayors of all major and medium-sized cities of Ukraine. It has special section for small cities and towns. AUC is traditionally one of the strongest protagonists of functional and fiscal decentralization, strengthening the role and capacities of city councils in developing and implementing effective policies. Association of small cities of Ukraine is another lobbying platform that evolved from original Association of the heads of villages and settlements. It unites mayors of cities of rayon significance with the headquarters in the city of Ukrainka (Kyvska o blast). ANNEX IX Summary of Planning Stakeholders 195 Ukraine_2015_nov26.indd 195 2015-11-26 5:14 PM
  • 218.
    Eastern Ukrainian Centreof Community Initiatives is one of very few Ukrainian NGOs, which is specifically dealing with the issues of transparency and public participation in the area of urban planning and spatial development. In particular it is a very active lobbyist of the question of making 100% of master plans open for public. ANNEX IX Summary of Planning Stakeholders 196 Ukraine_2015_nov26.indd 196 2015-11-26 5:14 PM