Download to read offline
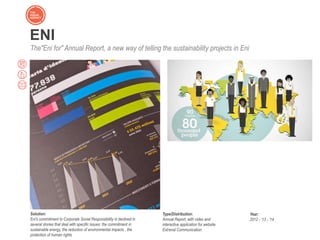
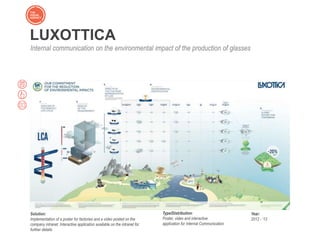
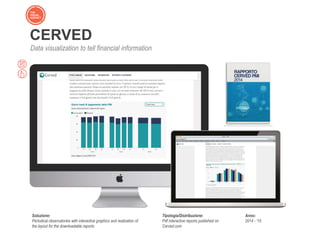


This document contains summaries of various companies' uses of data visualization and infographics for communication and reporting purposes, including: - Eni's use of an annual report with video and interactive application to communicate sustainability projects. - Luxottica's internal communication on environmental impacts using a poster, video, and intranet application. - Cerved's use of interactive reports and downloads to communicate financial information.