Download to read offline
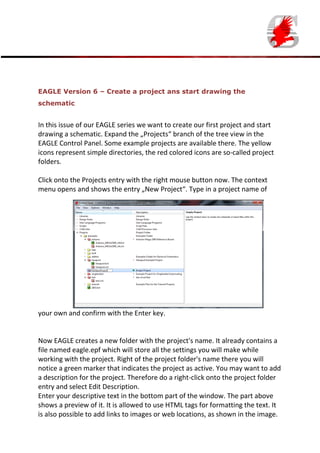

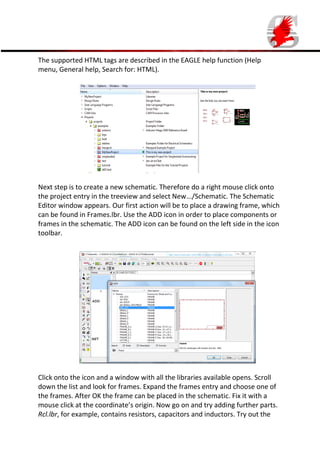


This document guides users on starting a project and creating a schematic in Eagle version 6. It explains how to create a new project folder, edit its description using HTML formatting, and place components using the schematic editor. Users are encouraged to explore libraries for adding various components like resistors and capacitors.


