Download as PDF, PPTX
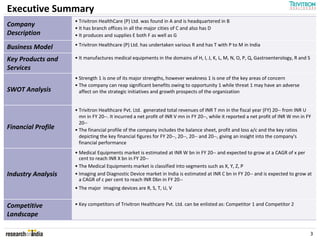
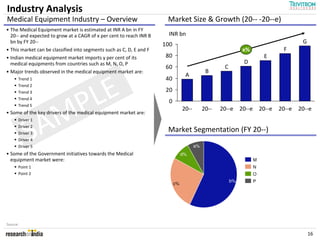

Trivitron Healthcare Pvt. Ltd., founded in 2012 and headquartered in India, specializes in manufacturing medical equipment across various domains. The company has experienced growth in financial performance while facing competitive pressures and challenges highlighted in a SWOT analysis. The medical equipment market in India is growing steadily, with significant opportunities for Trivitron amidst threats from competitors.


