TriMetals Mining Inc. news release
•Download as DOCX, PDF•
0 likes•68 views

TriMetals Mining Inc. is a growth focused mineral exploration company creating value through the exploration and development of the near surface, Gold Springs gold-silver project in mining friendly Nevada and Utah in the U.S.A. The Company’s approach to business combines the team’s track record of discovery and advancement of large projects, key operational and process expertise, and a focus on community relations and sustainable development. Management has extensive experience in the global exploration and mining industry.

Recommended
Recommended
More Related Content
Similar to TriMetals Mining Inc. news release
Similar to TriMetals Mining Inc. news release (20)
More from Chris Helweg
More from Chris Helweg (20)
Recently uploaded
Recently uploaded (20)
TriMetals Mining Inc. news release
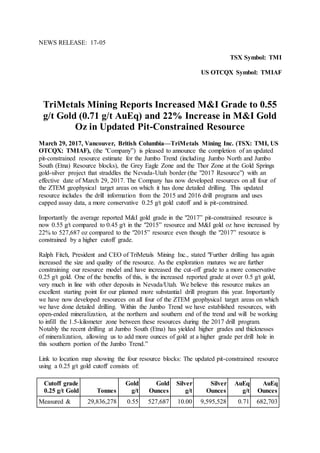
- 1. NEWS RELEASE: 17-05 TSX Symbol: TMI US OTCQX Symbol: TMIAF TriMetals Mining Reports Increased M&I Grade to 0.55 g/t Gold (0.71 g/t AuEq) and 22% Increase in M&I Gold Oz in Updated Pit-Constrained Resource March 29, 2017, Vancouver, British Columbia—TriMetals Mining Inc. (TSX: TMI, US OTCQX: TMIAF), (the "Company”) is pleased to announce the completion of an updated pit-constrained resource estimate for the Jumbo Trend (including Jumbo North and Jumbo South (Etna) Resource blocks), the Grey Eagle Zone and the Thor Zone at the Gold Springs gold-silver project that straddles the Nevada-Utah border (the "2017 Resource”) with an effective date of March 29, 2017. The Company has now developed resources on all four of the ZTEM geophysical target areas on which it has done detailed drilling. This updated resource includes the drill information from the 2015 and 2016 drill programs and uses capped assay data, a more conservative 0.25 g/t gold cutoff and is pit-constrained. Importantly the average reported M&I gold grade in the "2017” pit-constrained resource is now 0.55 g/t compared to 0.45 g/t in the "2015” resource and M&I gold oz have increased by 22% to 527,687 oz compared to the "2015” resource even though the "2017” resource is constrained by a higher cutoff grade. Ralph Fitch, President and CEO of TriMetals Mining Inc., stated "Further drilling has again increased the size and quality of the resource. As the exploration matures we are further constraining our resource model and have increased the cut-off grade to a more conservative 0.25 g/t gold. One of the benefits of this, is the increased reported grade at over 0.5 g/t gold, very much in line with other deposits in Nevada/Utah. We believe this resource makes an excellent starting point for our planned more substantial drill program this year. Importantly we have now developed resources on all four of the ZTEM geophysical target areas on which we have done detailed drilling. Within the Jumbo Trend we have established resources, with open-ended mineralization, at the northern and southern end of the trend and will be working to infill the 1.5-kilometer zone between these resources during the 2017 drill program. Notably the recent drilling at Jumbo South (Etna) has yielded higher grades and thicknesses of mineralization, allowing us to add more ounces of gold at a higher grade per drill hole in this southern portion of the Jumbo Trend.” Link to location map showing the four resource blocks: The updated pit-constrained resource using a 0.25 g/t gold cutoff consists of: Cutoff grade 0.25 g/t Gold Tonnes Gold g/t Gold Ounces Silver g/t Silver Ounces AuEq g/t AuEq Ounces Measured & 29,836,278 0.55 527,687 10.00 9,595,528 0.71 682,703
- 2. Indicated Inferred 4,660,203 0.46 69,484 6.49 972,708 0.57 85,198 Gold Equivalent (AuEq) uses a gold/silver ratio 61.9 and have not been adjusted for metallurgical recoveries. The Inferred resource is in addition to the measured and indicated resource. Numbers have been rounded, which may lead to some numbers not adding up exactly. The majority of the resource is located in the Jumbo Trend which consists of the resource blocks Jumbo North and Jumbo South (Etna): Jumbo Trend Resource - Jumbo North and Jumbo South (Etna) Utah Category Area Tonnage Gold Silver AuEq Tonnes (000) g/t Oz (000) g/t Oz (000) g/t Oz (000) M&I Jumbo N 16,994 0.50 271 12.12 6,623 0.69 378 M&I Jumbo S (Etna) 5,312 0.61 104 6.51 1,111 0.71 122 Total 22,306 0.52 375 10.79 7,735 0.70 500 Inferred Jumbo N 2,328 0.45 34 7.25 542 0.57 43 Inferred Jumbo S (Etna) 1,435 0.50 23 5.27 243 0.58 27 Total 3,763 0.47 57 6.49 786 0.58 70 Gold Equivalent (AuEq) uses a gold/silver ratio 61.9 and have not been adjusted for metallurgical recoveries. The Inferred resource is in addition to the measured and indicated resource. Numbers have been rounded, which may lead to some numbers not adding up exactly. The remaining resource lies on the Nevada side of the project and consists of two separate areas, the Thor Zone in the middle of the property and the Grey Eagle towards the NW corner of the property: Grey Eagle and Thor Resource Nevada Category Area Tonnage Gold Silver AuEq Tonnes (000) g/t Oz (000) g/t Oz (000) g/t Oz (000) M&I Grey Eagle 7,175 0.62 142 7.17 1,654 0.73 169
- 3. Grey Eagle and Thor Resource Nevada Category Area Tonnage Gold Silver AuEq Tonnes (000) g/t Oz (000) g/t Oz (000) g/t Oz (000) M&I Thor 355 0.96 11 18.15 207 1.25 14 Total 7,531 0.63 153 7.69 1,861 0.76 183 Inferred Grey Eagle 875 0.43 12 6.37 179 0.53 15 Inferred Thor 23 0.63 0 11.10 8 0.81 1 Total 898 0.43 13 6.49 187 0.54 16 Gold Equivalent (AuEq) uses a gold/silver ratio 61.9 and have not been adjusted for metallurgical recoveries. The Inferred resource is in addition to the measured and indicated resource. Numbers have been rounded, which may lead to some numbers not adding up exactly. This pit-constrained model uses a 0.25 g/t gold cut-off grade compared to 0.2 g/t gold cutoff grade used in the 2015 resource. An additional 97,000 oz of gold (M&I) and 85,000 oz of gold (Inferred) were estimated outside the pit-constrained model. It is expected that the majority of these ounces will become part of the resource with further drilling because the resource areas are open to expansion down-dip and along strike. The 2017 Resource is an update of the estimate used in the 2015 Preliminary Economic Assessment ("PEA") (see TMI News Releases dated June 3, 2015 and August 12, 2015) and includes the assay information from 32 additional reverse circulation (RC) drill holes at Jumbo North, 8 additional RC holes at Jumbo South (Etna) and 11 additional RC holes at Thor. All resources are open to expansion at depth and along strike. To compare the 2015 Geologic Resource to the present geologic resource on a similar basis we need to look at the 2017 Geologic Resource using a 0.2 g/t gold cutoff-grade and look at the 2015 resource using a gold/silver ratio, for gold equivalent calculation, of 61.9. The accompanying table demonstrates that on this basis the M&I geologic resources have increased quite substantially, by 327 thousand AuEq oz of a similar grade. Gold Springs Resource Estimate – IDP* Geologic Resource by Category 0.20 grams/tonne cutoff Category Gold Silver Gold Eq (ratio 61.9) g/t Oz (000) g/t Oz (000) g/t Oz (000)
- 4. Gold Springs Resource Estimate – IDP* Geologic Resource by Category 0.20 grams/tonne cutoff Category Gold Silver Gold Eq (ratio 61.9) g/t Oz (000) g/t Oz (000) g/t Oz (000) 2017 Geologic Resource Measured + Indicated 0.46 704 8.44 12,831 0.60 911 Inferred 0.41 184 5.70 2,579 0.50 225 2015 Geologic Resource Measured + Indicated 0.45 434 9.62 9,296 0.60 584 Inferred 0.34 225 6.87 4,613 0.45 300 Difference ( 2017 resource minus 2015 resource) Measured + Indicated 0.01 270 (1.18) 3,535 (0.00) 327 Inferred 0.07 (41) (1.17) (2,034) 0.05 (74) *Inverse distance to a power (IDP) For comparison purposes only, a cut-off grade of 0.20 g/t Au and a gold/silver ratio, for gold equivalent calculation, of 61.9 is used in this table for both the 2015 and 2017 Resources. Numbers have been rounded, which may lead to some numbers not adding up exactly. The following tables show the details of the 2017 Updated Resource: Gold Springs Resource Estimate - IDP Pit Constrained Resource by Category 0.25 grams/tonne cutoff Resourc e Categor y $1500 Au Area Tonnage Au Ag TONNES (000) G/ T GRAMS (000) OZ (000) G/T GRAMS (000) OZ (000) Measur ed Grey Eagle 2,835 0.6 5 1,840 59 7.26 20,581 662 Jumbo N 8,448 0.5 3 4,444 143 13.2 5 111,933 3,599 Jumbo S 2,098 0.6 1,347 43 6.91 14,496 466
- 5. Gold Springs Resource Estimate - IDP Pit Constrained Resource by Category 0.25 grams/tonne cutoff Resourc e Categor y $1500 Au Area Tonnage Au Ag TONNES (000) G/ T GRAMS (000) OZ (000) G/T GRAMS (000) OZ (000) (Etna) 4 Thor 210 0.9 9 208 7 19.0 0 3,985 128 Total 13,591 0.5 8 7,839 252 11.1 1 150,995 4,855 Indicate d Grey Eagle 4,340 0.5 9 2,580 83 7.11 30,852 992 Jumbo N 8,546 0.4 7 3,985 128 11.0 1 94,076 3,025 Jumbo S (Etna) 3,214 0.5 8 1,875 60 6.24 20,067 645 Thor 145 0.9 2 134 4 16.9 3 2,461 79 Total 16,245 0.5 3 8,574 276 9.08 147,456 4,741 Measur ed + Indicate d Grey Eagle 7,175 0.6 2 4,420 142 7.17 51,433 1,654 Jumbo N 16,994 0.5 0 8,429 271 12.1 2 206,009 6,623 Jumbo S (Etna) 5,312 0.6 1 3,222 104 6.51 34,562 1,111 Thor 355 0.9 6 342 11 18.1 5 6,446 207 Total 29,836 0.5 5 16,413 528 10.0 0 298,450 9,596 Inferre d Grey Eagle 875 0.4 3 376 12 6.37 5,569 179 Jumbo N 2,328 0.4 5 1,057 34 7.25 16,869 542
- 6. Gold Springs Resource Estimate - IDP Pit Constrained Resource by Category 0.25 grams/tonne cutoff Resourc e Categor y $1500 Au Area Tonnage Au Ag TONNES (000) G/ T GRAMS (000) OZ (000) G/T GRAMS (000) OZ (000) Jumbo S (Etna) 1,435 0.5 0 714 23 5.27 7,564 243 Thor 23 0.6 3 14 0 11.1 0 251 8 Total 4,660 0.4 6 2,161 69 6.49 30,254 973 Gold Springs Resource Estimate - IDP Geologic Resource by Category 0.25 grams/tonne cutoff Resourc e Categor y Geologic Area Tonnage Au Ag TONNES (000) G/ T GRAMS (000) OZ (000) G/T GRAMS (000) OZ (000) Measur ed Grey Eagle 2,871 0.6 5 1,854 60 7.22 20,723 666 Jumbo N 9,384 0.5 1 4,831 155 12.6 1 118,375 3,806 Jumbo S (Etna) 2,223 0.6 2 1,389 45 6.70 14,886 479 Thor 1,075 0.6 9 744 24 11.0 2 11,851 381 Total 15,554 0.5 7 8,818 284 10.6 6 165,834 5,332 Indicate d Grey Eagle 4,835 0.5 7 2,773 89 6.74 32,565 1,047 Jumbo N 10,709 0.4 5 4,860 156 10.0 9 108,025 3,473
- 7. Gold Springs Resource Estimate - IDP Geologic Resource by Category 0.25 grams/tonne cutoff Resourc e Categor y Geologic Area Tonnage Au Ag TONNES (000) G/ T GRAMS (000) OZ (000) G/T GRAMS (000) OZ (000) Jumbo S (Etna) 3,736 0.5 5 2,054 66 5.90 22,022 708 Thor 1,457 0.6 4 936 30 8.45 12,316 396 Total 20,736 0.5 1 10,623 342 8.44 174,928 5,624 Measur ed + Indicate d Grey Eagle 7,706 0.6 0 4,626 149 6.92 53,287 1,713 Jumbo N 20,093 0.4 8 9,691 312 11.2 7 226,400 7,279 Jumbo S (Etna) 5,959 0.5 8 3,444 111 6.19 36,908 1,187 Thor 2,532 0.6 6 1,680 54 9.55 24,167 777 Total 36,290 0.5 4 19,441 625 9.39 340,763 10,956 Inferre d Grey Eagle 1,637 0.4 1 663 21 5.03 8,243 265 Jumbo N 4,860 0.4 3 2,085 67 6.83 33,188 1,067 Jumbo S (Etna) 1,834 0.4 7 861 28 5.05 9,257 298 Thor 1,639 0.7 3 1,192 38 7.80 12,779 411 Total 9,971 0.4 8 4,801 154 6.37 63,467 2,041
- 8. For comparative purposes the Resource is also shown below using the same 0.2 g/t gold cut- off as was used in the 2015 PEA. Gold Springs Resource Estimate - IDP Pit Constrained Resource by Category 0.20 grams/tonne cutoff Resourc e Categor y $1500 Au Area Tonnage Au Ag TONNES (000) G/ T GRAMS (000) OZ (000) G/T GRAMS (000) OZ (000) Measur ed Grey Eagle 3,303 0.5 9 1,945 63 6.85 22,640 728 Jumbo N 10,826 0.4 6 4,975 160 11.9 2 129,077 4,150 Jumbo S (Etna) 2,675 0.5 5 1,477 47 6.22 16,637 535 Thor 222 0.9 5 210 7 18.1 6 4,033 130 Total 17,026 0.5 1 8,607 277 10.1 2 172,387 5,542 Indicate d Grey Eagle 4,953 0.5 5 2,717 87 6.74 33,370 1,073 Jumbo N 11,280 0.4 1 4,595 148 9.93 111,972 3,600 Jumbo S (Etna) 4,368 0.4 9 2,134 69 5.58 24,354 783 Thor 150 0.9 0 135 4 16.4 8 2,474 80 Total 20,751 0.4 6 9,581 308 8.30 172,169 5,535 Measur ed + Indicate d Grey Eagle 8,255 0.5 6 4,662 150 6.78 56,010 1,801 Jumbo N 22,106 0.4 3 9,570 308 10.9 0 241,049 7,750 Jumbo S (Etna) 7,043 0.5 1 3,611 116 5.82 40,991 1,318 Thor 372 0.9 345 11 17.4 6,506 209
- 9. Gold Springs Resource Estimate - IDP Pit Constrained Resource by Category 0.20 grams/tonne cutoff Resourc e Categor y $1500 Au Area Tonnage Au Ag TONNES (000) G/ T GRAMS (000) OZ (000) G/T GRAMS (000) OZ (000) 3 9 Total 37,777 0.4 8 18,188 585 9.12 344,556 11,078 Inferre d Grey Eagle 1,013 0.4 0 407 13 6.12 6,197 199 Jumbo N 3,068 0.4 0 1,223 39 6.73 20,638 664 Jumbo S (Etna) 2,013 0.4 2 846 27 4.82 9,695 312 Thor 24 0.6 1 15 0 10.5 9 253 8 Total 6,117 0.4 1 2,490 80 6.01 36,784 1,183 Gold Springs Resource Estimate - IDP Geologic Resource by Category 0.20 grams/tonne cutoff Resourc e Categor y Geologic Area Tonnage Au Ag TONNES (000) G/ T GRAMS (000) OZ (000) G/T GRAMS (000) OZ (000) Measur ed Grey Eagle 3,368 0.5 8 1,965 63 6.80 22,903 736 Jumbo N 12,143 0.4 5 5,446 175 11.3 1 137,351 4,416 Jumbo S (Etna) 2,877 0.5 3 1,536 49 5.97 17,161 552 Thor 1,363 0.5 808 26 9.41 12,816 412
- 10. Gold Springs Resource Estimate - IDP Geologic Resource by Category 0.20 grams/tonne cutoff Resourc e Categor y Geologic Area Tonnage Au Ag TONNES (000) G/ T GRAMS (000) OZ (000) G/T GRAMS (000) OZ (000) 9 Total 19,750 0.4 9 9,755 314 9.63 190,232 6,116 Indicate d Grey Eagle 5,751 0.5 2 2,977 96 6.30 36,239 1,165 Jumbo N 14,566 0.3 9 5,722 184 9.04 131,651 4,233 Jumbo S (Etna) 5,264 0.4 6 2,397 77 5.18 27,265 877 Thor 1,949 0.5 4 1,045 34 7.03 13,706 441 Total 27,530 0.4 4 12,141 390 7.59 208,861 6,715 Measur ed + Indicate d Grey Eagle 9,119 0.5 4 4,941 159 6.49 59,142 1,901 Jumbo N 26,710 0.4 2 11,168 359 10.0 7 269,002 8,649 Jumbo S (Etna) 8,141 0.4 8 3,933 126 5.46 44,427 1,428 Thor 3,312 0.5 6 1,854 60 8.01 26,522 853 Total 47,281 0.4 6 21,896 704 8.44 399,093 12,831 Inferre d Grey Eagle 2,193 0.3 6 787 25 4.81 10,559 339 Jumbo N 6,773 0.3 7 2,514 81 6.34 42,916 1,380 Jumbo S (Etna) 2,731 0.3 9 1,063 34 4.48 12,224 393
- 11. Gold Springs Resource Estimate - IDP Geologic Resource by Category 0.20 grams/tonne cutoff Resourc e Categor y Geologic Area Tonnage Au Ag TONNES (000) G/ T GRAMS (000) OZ (000) G/T GRAMS (000) OZ (000) Thor 2,374 0.5 7 1,354 44 6.11 14,500 466 Total 14,070 0.4 1 5,717 184 5.70 80,199 2,579 Global Resource Engineering (GRE) estimated the mineral resources for each of the four mineral deposits within Gold Springs, the Jumbo Trend including Jumbo North and Jumbo South (Etna), Grey Eagle and Thor, by constructing a geologic model representing the mineralized zones within each deposit including statistically and geostatistically analyzing the drill hole data. This information was used to define the parameters used to estimate gold and silver grades into the 3-dimensional block model. Three types of algorithms were used to estimate grade for both gold and silver within each block model: Geologic solid models of the mineralized zones in each deposit were created in Leapfrog and the grade for those solids was estimated using inverse distance to the 2.5 power (ID2.5) for Jumbo N, Jumbo S (Etna), and Thor, and inverse distance cubed (ID3) for Grey Eagle in 2015, ordinary kriging (OK), and nearest neighbor (NN) algorithms using Techbase and Micromodel. The results from each method were very similar, validating the estimate. The inverse distance to a power (IDP) estimate is most comparable to prior estimates, is the preferred estimate, and is reported here. The data used for the estimation includes the following: The drill holes in the Jumbo North area total 17,229.91 metres, and the channels total 161.87 metres. There are 9,813 gold and silver assay data values in the Jumbo North database. The drill holes in the Jumbo South (Etna) area total 2,917.16 metres, and the channels total 329.19 metres. There are 2,071 gold and silver assay data values in the Etna database. The drill holes in the Thor area total 2,890.03 metres. There are 1,233 gold and silver assay data values in the Thor database. The data includes 94 exploration holes and trenches in the Grey Eagle deposit totaling 12,401 metres. Within the Grey Eagle, deposit, there are 6,906 gold sample results. The geologic solid model utilized a block model with 5 metre by 5 metre by 5 metre blocks (xyz) and the geological interpretation of the mineralized envelope to isolate the mineralized domain from non-mineralized rock and to control estimation of gold and silver near known faults. An inverse distance 2.5 algorithm was used with a minimum of 2 drill holes.
- 12. GRE classified the Mineral Resource as Measured with an average distance of less than 25 meters from drill holes, Indicated with an average distance of 25 to 50 metres from holes, and Inferred with an average distance between 50 metres and 100 meters. GRE is not aware of any legal, political, environmental, or other risks that could materially affect the potential development of the mineral resources at Gold Springs. The Technical Report, including the 2017 Resource, is near completion and will be filed on SEDAR on March 31, 2017, Gold Equivalence:AuEq* was calculated using a gold/silver ratio of 61.9 and has not been adjusted for metallurgical recoveries. Qualified Person The Mineral Resource has been prepared in accordance with the Canadian Institute of Mining, Metallurgy and Petroleum (CIM), CIM Standards on Mineral Resources and Reserves, Definitions and Guidelines prepared by the CIM Standing Committee on Reserve Definitions and adopted by the CIM by Ms. Terre Lane, Principal Mining Engineer for Global Resource Engineering, Mr. Kevin Gunesch, Principal Mining Engineer for Global Resource Engineering and Mr. Kurt Katsura, Consulting Geologist, all Qualified Professionals as defined in National Instrument 43-101 Standards of Disclosure for Mineral Projects (NI 43-101), and are "independent” of the Company as defined in NI 43-101, and all have reviewed and approved the technical information regarding the resource estimate in this release. TMI Assays were performed in Sparks, Nevada by Bureau Veritas Mineral Laboratories, an ISO 9001:2000 Certified laboratory. Cautionary Statement on Mineral Resources This news release uses the term ‘measured resources’, ‘indicated resources’ and 'inferred resources' which are terms recognized and required by Canadian regulations (under National Instrument 43-101 Standards of Disclosure for Mineral Projects), however, such terms are not defined terms under SEC Industry Guide 7 and are not permitted to be used in reports and registration statements filed with the United States Securities and Exchange Commission. Investors are cautioned not to assume that any part or all of the mineral deposits in these categories will be upgraded or converted into ‘reserves’ as defined under NI 43-101. Mineral resources that are not mineral reserves, do not have demonstrated economic viability. In addition, 'inferred resources' have a great amount of uncertainty as to their existence, and economic and legal feasibility. It cannot be assumed that an inferred resource will be upgraded to a higher category. Under Canadian rules, estimates of inferred resources may not form the basis of feasibility or pre-feasibility studies, or economic studies except for preliminary economic assessment as defined under NI 43-101. Investors are cautioned not to assume that part or all of an inferred resource exists, or is economically or legally mineable. About TriMetals Mining Inc. TriMetals Mining Inc. is a growth focused mineral exploration company creating value through the exploration and development of the near surface, Gold Springs gold-silver project in mining friendly Nevada and Utah in the U.S.A.
- 13. The Company’s approach to business combines the team’s track record of discovery and advancement of large projects, key operational and process expertise, and a focus on community relations and sustainable development. Management has extensive experience in the global exploration and mining industry. The Company’s common shares and Class B shares are listed on the Toronto Stock Exchange under the symbols "TMI” and "TMI.B” and the common shares and Class B shares also trade on the OTCQX market under the symbol "TMIAF” and "TMIBF”. Note that the Class B shares have no interest in the properties or assets of the Company. The Class B shares are only entitled collectively to 85% of the net cash, if any, (after deducting all costs, taxes and expenses and the third-party funder's portion thereof) received by TMI from award or settlement in relation to the Company’s subsidiary South American Silver Limited’s arbitration proceeding against Bolivia for the expropriation of the Malku Khota project in 2012. Additional information related to TriMetals Mining Inc. is available at www.trimetalsmining.com and on SEDAR at www.sedar.com. Forward-looking Statements Certain statements contained herein constitute "forward-looking statements”. Forward- looking statements look into the future and provide an opinion as to the effect of certain events and trends on the business. Forward-looking statements may include words such as "further”, "target”, "expansion”, "believe”, "planned”, "open”, "will”, "become”, "expected” and similar expressions. Information concerning mineral resource estimates and the interpretation of drill, metallurgical testing and other exploration results may also be considered forward-looking statements as such information constitutes a prediction of what mineralization might be found to be present if and when a mining project is actually developed. These forward- looking statements are based on current expectations and entail various risks and uncertainties. Actual results may materially differ from expectations, if known and unknown risks or uncertainties affect our business, or if our estimates or assumptions prove inaccurate. Factors that could cause results or events to differ materially from current expectations expressed or implied by the forward-looking statements, include, but are not limited to, possible variations in mineral resources, grade, metal prices; any delay in the completion by the independent qualified persons of the NI 43-101 compliant technical report supporting the new resource estimate for Gold Springs; availability of sufficient financing to fund planned or further required work in a timely manner and on acceptable terms; changes in project parameters as plans continue to be refined; failure of equipment or processes to operate as anticipated; regulatory, environmental and other risks of the mining industry more fully described in the Company’s Annual Information Form and continuous disclosure documents which are available on SEDAR at www.sedar.com. The assumptions made in developing the forward-looking statements include: the accuracy of current resource estimates and the interpretation of drill, metallurgical testing and other exploration results; the timely receipt of required permits for the Gold Springs project; the continuing support for mining by local governments in Nevada and Utah; the availability of equipment and qualified personnel to advance the Gold Springs project; execution of the Company’s existing plans and further exploration and development programs for Gold Springs, which may change due to changes in the views of the Company or if new information arises which makes it prudent to change such plans or programs; and the timely completion by the independent qualified persons of a NI 43-101 compliant technical report supporting the resource estimate by March 31, 2017.
- 14. Readers are cautioned not to place undue reliance on the forward-looking statements contained in this news release. Except as required by law, the Company assumes no obligation to update or revise any forward-looking statement, whether as a result of new information, future events or any other reason. Unless otherwise indicated, forward-looking statements in this news release describe the Company’s expectations as of March 29, 2017. TriMetals Mining Inc. Contact: