1. “Gold and Rare Earths – a good combination?”
In Focus: Edition 14
March 10, 2010
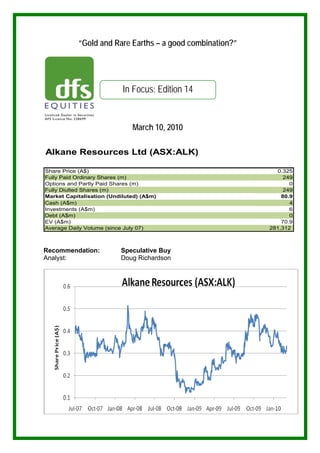
Alkane Resources Ltd (ASX:ALK)
Share Price (A$) 0.325
Fully Paid Ordinary Shares (m) 249
Options and Partly Paid Shares (m) 0
Fully Diulted Shares (m) 249
Market Capitalisation (Undiluted) (A$m) 80.9
Cash (A$m) 4
Investments (A$m) 6
Debt (A$m) 0
EV (A$m) 70.9
Average Daily Volume (since July 07) 281,312
Recommendation: Speculative Buy
Analyst: Doug Richardson
2. Major Shareholders (m) (%)
Abbotsleigh Pty Ltd (Director - Ian Gandel) 70.4 28.42%
Merrill Lynch (Aust) Nominees Pty Ltd 15.8 6.32%
ANZ Nominees Ltd 12.5 5.00%
National Nominees Ltd 9.2 3.69%
JP Morgan Nominees Aust Ltd 7.6 3.04%
Directors/Management
Board Management
John Dunlop (Chairman) Ian Chalmers Managing Director
Ian Chalmers Lindsay Colless CFO and Joint Secretary
Ian Cornelius Karen Brown Joint Secretary
Anthony Lethlean Terry Ransted Chief Geologist
Ian Gandel
Key Projects Control Metal JV Partner Process Location Status
Tomingley Gold Project (TGP) 100% Gold na OC & UG NSW DFS Commenced
Dubbo Zirconia Project (DZP) 100% Rare Earths na OC NSW DFS Commenced
McPhillamys Gold and Orange Districts 25% Gold Newmont OC & UG NSW BFS Commencing
Wellington Project 100% Copper na OC NSW Mid Exploration
Alkane Resources Ltd (ALK) is a multi commodity exploration company (and previously miner) focusing on
gold and rare earth projects in the Central Western regions of New South Wales (NSW), approximately
400kms northwest of Sydney. ALK has previous experience in developing the Peak Hill Gold Mine and is
now focused on the Tomingley Gold Project (TPG) with a current resource of 840,000 ounces (oz) of gold
(Au). A Joint Venture (JV) with one of the world’s largest gold producers Newmont Australia Limited (NAL)
exists at McPhillamys near Orange, with deep gold intercepts recently being drilled.
ALK also has the Dubbo Zirconia Project (DZP), located 30kms south of Dubbo, potentially becoming one
of the world’s most advanced zirconium, niobium, yttrium and rare earth productions and is based upon a
world class reserve.
Figure 1: Prospect locations for ALK, located around the Central Western NSW towns of Dubbo and Orange.
3. Projects:
Tomingley Gold Project (TPG)
Tomingley Gold Project - Resource
Deposit Tonnes (million) Grade (g/t) Ounces
Wyoming 1 6.5 2.5 520,842
Wyoming 3 0.8 2.0 54,013
Caloma 4.1 2.1 274,792
Total 11.4 2.3 849,647
The 100% owned TPG currently has an 840,000oz Au resource within three deposits – Wyoming 1 & 3
and Caloma. A Definitive Feasibility Study (DFS) for the development of the Project with a potential of
50k-60k oz Au production pa, is in progress and is expected to be completed by mid 2010.
The initial base model for TPG comprises three open pit mines and production will be through a
conventional CIL (carbon in leach) gold recovery circuit at a rate of around 0.75-1Mt pa of ore and for a
mine of life of 6-8 years with the potential target of extending to 10 years. The open pit model has recently
been expanded to include future underground operations, as some underground intercepts include
66m@19.5g/t at Wyoming 1 and 5m@30.4g/t at Caloma.
Existing infrastructure exists in the region of the Project however the Caloma Deposit and the proposed
treatment plant is split by the Newell Highway thus capital costs for items such as an underpass for
underneath the highway will need to be factored in. This underpass would cost approximately A$2.5m and
would include an allowance for A$0.35m to move optic cables for national grid communications. These
costs have come in much higher than originally forecast.
Water supply is also an issue for the region as it forms part of the Murray-Darling River Catchment and
thus an option to acquire part of the existing production licence on the Macquarie River Aquifer (near
Narromine) has been agreed, meaning that a 45km pipeline (cost of A$5m) will need to be constructed to
the mine site. Power could be supplied from the grid at Peak Hill some 20kms to the south of the mine site
At present, the opex costs per oz for TPG is targeted at A$750-$800. This may appear on the high side
compared to cash costs from other Australian gold producers such as Avoca Resources (AVO:ASX)
however the margin is healthy at current gold prices of US$1130oz (A$1255oz). Forward selling of gold
would be targeted by ALK once the resource is further defined in terms of tonnage and classification. Cap
ex costs could be in the range of A$50m-$60m including the infrastructure required as previous
mentioned. No accommodation or camps are required as workers can be sourced from Dubbo,
Narromine, Parkes and Forbes. Pre-existing water permits exist, and natural gas pipelines exist and there
is a railway 5km west of the TPG.
4. Figure 2: Site layout for TPG including Wyoming 1 & 3 and Caloma. Note - it cuts through the Newell Highway.
Because of the additional capital costs for the underpass and pipelines, ALK may look to the TPG for
additional ore to extend the life and generate more favourable returns. To do this, assessment of any
underground mining potential is in progress, particularly at the Wyoming 1 deposit that currently shows a
sub-pit resource of 145koz of Au contained in 1.3Mt of ore with a grading of 3.7g/t at a cut off of 2g/t. The
Caloma sub pit resource has not been defined at this time though mineralised zones do exist to at least
200m below the open pit. The target of 120koz has been earmarked by the company for this underground
5. zone. Diamond drilling at Caloma will occur in the following weeks to scope the underground potential at
the site.
Based on these underground regions, the total TPG could potentially extend the life of the mine to 10
years.
Additional air core drilling has also been commissioned at Caloma to test target areas approximately 250m
south from the planned Caloma open pit and 500m to the east to assess the potential for further pittable
ore. Recent results from ALK show 43 Air Core (AC) drill holes have been completed at the new South
Caloma target. Best results of this recent drilling include:
42m@2.25g/t gold from 27m (including 15m@4.3g/t from 39m and 6m@4.36g/t from 63m);
11m@8.36g/t from 57m;
12m@3.86g/t from 39m.
The Environmental Assessment on the Project is close to completion and will be lodged with NSW
Government for approval.
Orange District Exploration Joint Venture (ODEJV) & McPhillamys Project
In an announcement recently (2 March 2010) NAL have elected to increase their interest in the ODEJV to
75% by completing a Bankable Feasibility Study (BFS) on the McPhillamys Project. NAL is a subsidiary of
the US based Newmont Mining Corporation (NEM:NYSE).
Newmont will cover all exploration and costs up to and including the BFS.
The ODEJV includes the Molong and Moorilda tenements located near the town of Orange, adjacent to
Newcrest Mining Ltd’s Cadia Valley Operations
Figure 3: Location of Gold prospects in the Orange District, notably McPhillamys and other JV’s with
Newmont.
6. NAL will sole fund all expenditures to complete the BFS and there is no time constraints to finalise
this study. At ALK’s election, NAL can earn a further 5% interest (taking their stake to 80%) by securing
funding for ALK’s share of any capital costs for the development.
Several AC, RC (Reverse Circulation) and core drilling programs have identified a large gold mineralised
system within volcanics that comprises a +0.5g/t gold mineralised envelope extending over a north-south
strike of at least 600m with widths up to 200m. Higher grade gold within the central sector of the deposit
has associated copper mineralisation which may also have economic potential.
The best gold intercepts to date include:
123m@1.96g/t Au and 0.085%Cu from the surface;
264m@2.41g/t Au from 193m;
224m@1.16g/t Au and 0.082%Cu from 207m;
366m@1.86g/t Au and 0.076%Cu from 134m (including 109m@4.07g/t Au)
Below 650m, mineralisation has been intersected and remains open.
Figure 4: Cross section of McPhillamys, with Newmont now earning 75% as it enters BFS mode.
Further drilling and evaluation will be required to raise the conceptual exploration target to Identified
Mineral Resource status (currently is non-JORC compliant), however the resource potential that NAL have
run preliminary block models for resource compilation on the mineralised envelope and a conceptual
7. exploration target of 2M to 4M oz of gold and 50kt to 100kt of copper can be assigned to McPhillamys
at this stage.
McPhillamys potentially rates as one of the largest greenfields discoveries in Australian gold since 2005
when Tropicana (5M oz) was discovered in WA by Anglo Gold and Independence Group.
Further to existing finds at McPhillamys, regional exploration has drilled 78m@1.04g/t Au at Kings Plains 2
which is 2kms to the south of the main deposit.
Preliminary metallurgical testing on core samples indicated standard CIL recoveries of 86% to 91% and
further work will be programmed to expand on the CIL work and also examine the potential for gravity and
flotation recovery to include the copper mineralisation.
NAL are reviewing development models which includes various open pit scenarios and a possible
underground block cave mining concept. These studies will be expanded as part of the BFS program. As
an estimate, opex costs could reside in the A$700oz region.
The 2010 program and budget has to be yet to be fully decided for the ODEJV, but the program should
include further drill testing of the McPhillamys deposit at depth; drilling of regional targets; metallurgical
testing; and conceptual mine studies.
Dubbo Zirconia Project (Exotic Metals and Rare Earths)
The DZP is based upon a world class resource of the metals zirconium, hafnium, niobium, tantalum,
yttrium and rare earth elements. The deposit also contains significant uranium. Over several years
ALK has developed a flow sheet consisting of acid leaching followed by solvent extraction recovery and
refining (see next page) which can recover a variety of products which have expanding applications in
electronics, ceramics, catalysts, special alloys and glasses, fuel cells, special batteries and permanent
magnets, nuclear power and as environmental drying agents. Following an A$3.3M Commercial Ready
Grant from AusIndustry in 2006, the feasibility study was reactivated. The study includes the construction
and operation of a Demonstration Pilot Plant (DPP), and a development commitment is anticipated late
2010.
The Total Current Resource of 73.2Mt is as follows:
Measured (from surface to 55m depth):
35.7Mt grading of 1.96% Zr02(Zirconia), 0.04%HfO2(Hafnium), 0.46% Nb2O5 (Niobium), 0.03% Ta2O5(Tantalum) , 0.14% Y2O3,
0.75% REO (Rare Earth Oxides) and 0.014% U3O8(Uranium Oxide)
Inferred Resource (from 55m-100m depth):
37.5Mt at similar grades
* It should be noted that although DZP contains 23Mlbs (10,200t) of U3O8 at the lower grade of 140ppm U3O8,
production and mining of uranium is currently prohibited in NSW.
8. Figure 5: Flow Sheet for the DZP – outlining processing methods for the exotic metals and rare earth
concentrates.
The DPP as been operating at the laboratory facilities of ANSTO Minerals at Lucas Heights in southern
Sydney since early 2008 to trial engineering and process innovations to check specific aspects of the flow
sheet and to prove recoveries of yttrium and rare earths. This flow sheet separates the Light Rare Earths
Elements (LREE – lanthanum, cerium, neodymium) from the yttrium and Heavy Rare Earth Elements
(HREE – terbium, dysprosium and erbium). Samples of these LREE and HREE were recovered from the
plant and early analysis confirms favourable distribution to date. The defined resource (for all stated
metals) at DZP is large enough for open pit mining for a lifespan of close to 100 years.
The next process for the DPP is to provide engineering data for capex and opex estimates. Data from this
process and any possible letters of intent from future customers (off takes) will be incorporated in the
current DFS. If a development decision is agreed to, then production could occur around mid 2012.
Initially, the processing plant would target 400ktpa of ore from the open pit deposit. Processing (opex)
costs are to be determined, with an estimate of A$160t a possibility with sales revenue of A$300t. Capex
costs for the processing plant could be as high as A$180m. Recovery rates on the rare earths would be
around 70% but higher rates are expected for the zirconium products. Recovery rates for rare earths are
around 50%-55% from Chinese deposits.
Our Senior Analyst at DFS Equities, Miles Byrne, has previously provided an insight into the Rare Earth
market, focusing on two ASX listed companies, Lynas Corporation (LYC:ASX) and Arafura Resources
(ARU:ASX).
The following section outlines the usages of metals that the DZP contains:
Zirconium: drying agent in paints, primer coat of vehicle metalwork, ceramic pigments, engineering
ceramics, auto catalysts, electronics, solid oxide fuel cells, fuel rods in nuclear power plants, special alloys
and glass.
Hafnium: control rods for nuclear reactors, alloys, next generation microprocessors
Niobium: special alloys and glasses, steel strengthening.
Yttrium: phosphors in TV and computer screens, lasers and compact fluoro lights (energy efficient bulbs),
stabilisers in ceramics.
Rare earths: catalysts, lasers, permanent magnets/rechargeable batteries particularly for hybrid vehicle
motors, phosphors, fertilisers, speciality glasses.
9. Figure 6: Some applications of rare earth oxides – Source: Arafura Resources.
Increased demand from many of the metals is driven by environmental legislation to ensure emissions
minimisation and energy efficiency.
To provide you with an example of the importance of rare earths in guiding the globe to more energy
efficient measures, the motor for a Toyota Prius (perhaps the most recognised hybrid vehicle) contains
some 65 pounds of rare earths. A wind turbine contains over 300 pounds of rare earths (for a standard
3MW output windmill). Therefore, with the push to these sorts of vehicles and alternative energy
measures, the materials to make these innovations need to come from somewhere – rare earths.
Other uses for rare earths include popular electronics and technology including mobile phones, plasma
televisions, IPods and new media players. Also, many military uses such as radar, sonar and missiles can
be comprised from these materials.
Figure 7: Chemical periodic table delineating the 16 rare earth elements (REE): the
lanthanides, La through Lu, plus Y, whose geochemical behaviour is virtually identical to
that of the heavier lanthanides. Source (United States Geological Survey). The elements are:
Lanthanum (La), Cerium (Ce), Praseodymium (Pr), Neodymium (Nd), Samarium (Sm), Europium (Eu),
Gadolinium (Gd), Terbium (Tb), Dysprosium (Dy), Holmium (Ho), Erbium (Er), Thulium (Th), Ytterbium (Yb),
Lutetium (Lu), Yttrium (Y)
10. China corners the global rare earth production market with approximately 95% market share. The
Chinese Government realise the importance of these strategic materials and late last year announced that
exports of rare earths will be dramatically reduced. As a result, the scramble for rare earths has begun. It
should be noted that the Chinese rare earth deposits are relatively low in grade and recovery mining rates
are also low, hence we have seen Chinese interest in higher grade rare earth projects in Australia such as
Mt Weld (owned by LYC) and Nolans Bore (ARU). In the USA, Mountain Pass is a significant deposit
currently owned by investment bank Goldman Sachs, but the US Federal Government perhaps should
consider putting in an offer to stock up on strategic supplies.
Below is a useful table comparing the tonnage of these unique metals between the three listed Australian
companies:
La2O3 CeO3 Pr6O11 Nd2O3 Sm2O3 Eu2O3 Gd2O3 Tb4O7 Dy2O3 Y2O3 Total REO (tonnes)
ALK 107,055 201,483 21,960 77,409 13,725 549 11,529 1,647 10,980 86,742 533,079
LYC 298,007 575,831 62,926 198,276 26,120 7,124 10,686 1,187 2,375 3,562 1,186,093
ARU 156,954 405,535 51,752 181,558 20,362 4,242 10,181 848 2,545 12,726 846,703
Table 1: Tonnages of individual rare earth oxides contained in the DZP (ALK), Mt Weld (LYC) and Nolans
Bore (ARU).
Wellington Project (Copper)
Elsewhere within the central west region of NSW, Alkane has defined a low grade 2.09Mt@0.99% Cu
Indicated Resource which is being reviewed for its development potential at Galwadgere within the
Wellington Project, and several other advanced exploration projects with encouraging drill intercepts. New
exploration targets have been identified at several other locations.
Other Projects / Investments
In Western Australia, ALK holds 5M shares (6%) of listed iron ore explorer BC Iron Limited (BCI:ASX) and
a diluting 23% residual interest in a nickel sulphide joint venture with Xstrata Nickel (Jubilee) near
Leinster.
Cash and Recent Corporate Activity:
As at Feb 2010, ALK held A$4m in cash and the other liquid asset the company holds is the A$6m
investment (5M shares at approx. A$1.30 per share) in BCI. ALK held over 9m shares in BCI but sold
down mid last year to continue their studies and drilling at TPG. If the company continues to sell down the
BCI stake, sufficient cash (A$10m) should see them through to at least the end of the calendar year and
perhaps a quarter or two beyond. NAL’s key role in driving the ODEJV allows ALK to continue its push to
have TPG and DZP closer to production should the feasibility studies at McPhillamys prove positive.
Director Tony Lethlean also is a director of Helmsec Global Capital, thus ALK appears to have suitable
capital sources should they need to raise funds through a placement if it is required.
11. Last Quarterly
Reconciliation of Cash Current Quarter Previous Quarter
31/12/2009 30/09/2009
Cash on hand at bank 163,000 929,000
Deposits at Call 4,416,000 4,870,000
Bank Overdraft
Other Term Deposit - -
Total 4,579,000 5,799,000
Operating Activites
Receipts from product sales & debtors 8,000
Receipts from interest 44,000
Payments for exploration & evaluation -1,200,000
Payments for development -31,000
Payments for Production
Payments for Admin -32,000
Net Operating Cash Flows -1,211,000
Net Investing Cash Flows -3,000
Net Financing Cash Flows -6,000
NET INCREASE (DECREASE) in CASH HELD -1,220,000
Estimated outflow next Qtr
Exploration and Evaluation 1,500,000
Development
Total 1,500,000
Options:
No options exist for ALK.
Financial Analysis:
Remembering if NAL fund capital costs for the Project, ALK will still have a 20% interest. Using 2.5M oz of
gold as a guide, 500k oz could possibly be in line for ALK. Assuming a gold price of anything over
US$1,000oz, net margins should provide good cash flow for ALK. Using US$750oz as a guide for cash
(opex) costs, ALK could be looking at EBIT of around US$125m over a 10 year mine life, considerable for
a company this size if it is not required to fund capex costs.
The other point worth noting is NAL could provide an offer to ALK for the remaining 20% interest, so that
ALK could use the funds to further their TGP, copper or rare earth projects. Any amount that NAL would
offer is pure speculation, but it could be as high as A$75m.
As no DFS is available at present for any of the three projects, estimates in costs and margins are simply
that. Good margins appear to be evident on all projects if current metal prices remain stable or increase,
making the projects attractive.
Liquidity:
The average daily volume since 30 June 2007 is 281,000. The stock is relatively tightly held due to the
major shareholdings by director Ian Gandel. The stock appears to trade in patches, whereby volume may
reach above 400k for several consecutive days, then will significantly ease off.
Due to the small market capitalisation there is no weighting in major indices on the Australian Stock
Exchange.
Recent Corporate Related News
As mentioned above, NAL have increased their stake in the ODEJV to 75% after deciding to take the
McPhillamys Project to the BFS stage. An important point to note is NAL can increase the stake further to
80% at the election of ALK, provided NAL fund all capital costs for the Project.
Summary / Investment Comment
Appears to be in the right sectors at the moment with gold and the strategic rare earth market. However
the company may want to speed the DFS process up as these projects have been in waiting for quite
some time. The gold price rally of recent quarters has allowed the company to become more aggressive
in its approach towards TGP.
13. “Low PE and useful Dividend Yield”
In Focus: Edition 16
June 30, 2010
Mortgage Choice Limited (ASX:MOC)
Share Price (A$) 1.125
Fully Paid Ordinary Shares (m) 119.6
Options and Partly Paid Shares (m) 2.5
Fully Diulted Shares (m) 122.1
Market Capitalisation (Undiluted) (A$m) 134.6
Cash (A$m) 6.4
Price Earnings Ratio 9.4
Dividend Yield (%) 9.8%
Average Daily Volume (since July 07) 171,770
Recommendation: Moderate Buy
Analyst: Doug Richardson
14. Major Shareholders (m) (%)
Count Financial Limited (COU:ASX) 20.6 17.23%
R G Higgins & Ochoa Pty Ltd (Director) 15.2 12.73%
FMR Corp & Fidelity International Ltd 13.3 11.09%
Colonial First State Invst Ltd (CBA) 9.7 8.13%
INVESCO Australia Ltd 6.0 4.99%
Directors/Management
Board Management
Peter Ritchie (Chairman) Michael Russell Chief Executive Officer
Peter Higgins Susan Mitchell Chief Financial Officer
Rod Higgins
Steve Jermyn
Deborah Ralston
Sean Clancy
Mortgage Choice Limited (MOC) operates a mortgage broking franchise network which comprises
approximately 350 franchises located throughout Australia. MOC's brokers advise borrowers on the range
of home loan products available, assist them in the selection of products that are suitable to their needs
and submit loan applications on their behalf. The Company is focused on residential lending for owner-
occupiers and investors, and originates home loans on behalf of a panel of 22 lenders.
MOC provides support and services to its Franchise network in the form of training, marketing, advertising,
back-office support, lead generation and information technology. Under a Franchise agreement, a
Franchisee has the right to use the Mortgage Choice brand name and systems in a defined marketing
territory. Some Franchisees also employ additional brokers within their business. MOC and its
Franchisees share origination and trailing commissions paid by lenders which are based on the value of
loans originated by the Franchisees.
The Franchisee:
The franchise owners are effectively self employed, purchasing a franchise that gives access to a
designated location or marketing area to conduct the business of mortgage broking. Mortgage broking is a
service offered to clients to introduce, facilitate and organise finance for purchasing property or for finance
to be secured against property. In the case of MOC, the main focus is in residential mortgages, although a
small portion of the business model involves commercial mortgages.
Franchise owners depending on their initial capital structure and level of business activity can operate from
shopfront locations, commercial office locations or from the comfort of their own home. The latter is least
expensive to operate, however for branding and marketing purposes, the franchisor (MOC) would prefer to
see as many shop front locations as possible.
15. Advertising and Marketing:
At a corporate or franchisor level, MOC conduct regular radio and television advertising campaigns and
look to cover various advertising in home and lifestyle magazines and sponsor and participate in various
exhibitions such as property and wedding expos. The level of expenditure on advertising would be much
lower than that of John Symonds’ Aussie Home Loans (AHL), however, unlike AHL, MOC is not part
owned by major banking institutions such as the Commonwealth Bank, and thus does not have
expenditure budgets in the vicinity of AHL. The other major difference between MOC and AHL is that
MOC do not have any of their own mortgage products, whereas AHL can ‘sell’ their own mortgage product
to clients.
At an individual franchisee level, advertisements in local publications such as newspapers and flyers,
participation in community based events and sponsorship of local sporting or recreation teams usually
depicts the scope of advertising and marketing. The majority of business for established franchisees is
generated from repeat business or simply ‘word of mouth’/referral that normally is the strongest and least
expensive form of lead generation a franchisee can attest to.
Multiple franchise owners can exist in a particular MOC marketing area. For example, the inner west
suburb of Balmain in Sydney, has four franchisees (three have a shopfront or commercial office) operating
in the marketing region. Regions are divided geographically based on demographic data and finance data
from the Australian Bureau of Statistics (ABS). Localities or regions with a high population and a high
percentage of dwellings under finance, would expect to see an increased number of Mortgage Choice
franchises. There are many instances whereby multiple marketing areas can be serviced by the one
franchisee, who has decided to branch out and potential increase business.
The Process:
After deciding to contact MOC via an informal referral / word of mouth or perhaps an advertisement,
potential customers would meet or talk with an individual mortgage broker at MOC. The broker may be an
employee (such as a loan consultant) of a MOC franchise, or the broker could be the owner of the
franchise. All MOC brokers undergo training with the franchisor and the extensive program covering the
Certificate in Mortgage Lending is considered one of the more vigorous and comprehensive in the
industry. All brokers after completion of the training become members of the Mortgage & Finance
Association of Australia (MFAA) and must hold mandatory professional and liability insurance.
The broker initially qualifies the potential client with as many lenders as possible, but this is dependent on
the clients income, savings, expenses, credit history, etc. The interview process is similar to a normal
home loan application with a major lender at a branch. The purpose of the broker is to assist the client by
attempting to find the suitable debt financing product based on client needs and preferences. The MOC
broker is paid a commission once the loan has settled with the particular lender chosen. The individual
broker commission is not determined by the lender chosen as the franchisee receives the rate of
commission from the franchisor.
Lender Coverage:
The lender spread that the MOC model has exposure to, is considered reasonable with representation
amongst the main participants of the Australian residential lending industry. All major four lenders: ANZ,
CBA, NAB and WBC are represented as are leading regional lenders and building societies.
16. Commission Rates Received:
MOC is paid varying amounts of commission income once a loan is settled (known as an ‘upfront’
commission) and then also paid an annual income based on the amount of debt that the client has with
each individual lender (known as ‘trailing’ commission).
Upfronts
Whilst the rates of commission do vary from lender to lender, an upfront commission rate of approximately
0.55%-0.60% of the loan amount is paid by the lender to MOC. The major four banks pay 0.5%, with a
handful of the small lenders paying slightly above that, thus pushing up the average. To put this into
context, If MOC generates over $800m in new business/loans for the month, the franchisor will be paid
$4.24m.
The overall trend in upfront commissions has shown that lenders have scaled back the rates of
commissions, but most lenders have introduced volume and quality bonus schemes, whereby if an
aggregator or broking house introduces enough business each month, a commission bonus will be paid.
With the introduction of online applications to eliminate paperwork, lenders also look to reward brokers
accordingly if paperwork is reduced and the quality of loan submissions are of high quality.
Trails
Again the trend for trailing commissions has been to the downside, but it appears there has been a plateau
in recent years. Some of the main lenders such as the CBA and NAB are introducing a no trail policy for
the first year the loan has been drawn down, however sharply ramp up the trail to 25 basis points
(0.25%pa) after the first 3-4 years. The majority of lenders on the panel however, are paying 0.15%pa in
the first year, increasing that level to 20-25 bps. The removal of the trail for the first year by some banks is
an attempt to halt the broker from ‘churning’ the client loan away from the newly introduced lender and
entice the broker to keep the business relationship for the longer term by offering higher trail rates in the
third to fifth year of the loan.
Commission Rates Paid:
The major expenses to any franchise model of course are the payments to the individual franchisees or
business owners. MOC have close to 350 franchisees at varying levels of operation. There are some
foundation business owners still operating under the model with prominent loan book balances that take
up the majority of the franchise payments. Similarly, multiple franchise owners would also be taking a
large portion of franchise payments.
Upfronts
Every six months, MOC review the commission rates paid to franchisees based on the level and changes
of commissions received from the lenders.
Generally, franchisee payment levels for upfront commissions are broken down to three categories based
on the dollar amount of loans settled for the month. For example, a franchise that settles over $1.5m
worth of monthly business would receive a payout close to the 50bps that the franchisor receives from the
lender. A franchisee who is not quite as successful for the month may only receive around 35-40bps.
Trails
MOC on a quarterly basis, uses an indexation method to determine its trail rates to its franchisees. Again,
foundation and multiple owners would be major the recipients of the trail fees. Various internal hurdles as
with the upfronts, are in place for the trail payments. These hurdles are moved each quarter based on
indexation and trail rates that each lender pays MOC.
17. With the majority of the business written with the major lenders, the average trail commission received by
MOC would be between the 0.12%-0.18%pa. Lenders such as CBA have dragged down this rate as they
do not offer trail in the first 12 months.
Figure 1: Break down of lenders utilised by Mortgage Choice since July 2007. Source: MOC presentation
Feb 2010 (pg 17)
Approximately two years ago, it appears the trail model for franchisees on average was tweaked to
generally favour the franchisor, but this was done also in response to the lenders reducing their trail
payments to brokers and mortgage originators. The franchisor essentially has drawn a ‘line in the sand’
and for any new business written or refinanced by franchisees since the restructure, the franchisee
receives the reduced levels of trail commission. These low levels are based on rolling average hurdles for
loan dollar amounts settled.
With a loan book at 31 Dec 2009 of $37.7b and having increased by 9.6% since the same period 12
months earlier, the margin MOC makes on its trail is the key driver for the profit for the company. The
franchisor appears to be protecting its margin rather well.
Housing Statistics and Finance:
Recent statistics from the Australian Bureau of Statistics (ABS) are shown below for financing property
acquisitions.
1HFY10 new housing finance was up 23% compared to the same period last year, although 2HFY10 was
expected to see a fall off and the diagrams below clearly show this.
18. The increases in the latter part of 2009 CY for finance on homes can be attributed to low unemployment
levels, an undersupply of housing and hence low rental vacancy rates, strong population growth and birth
rates, government grants and stamp duty offers and increase in consumer confidence post the Global
Economic Downturn (GED).
The tapering off in housing finance commitments in the recent two quarters are clearly a result of rising
interest rates. The Reserve Bank of Australia appear to have put interest rates on hold for the time being
and many market economists are now possibly factoring in a cut to the official cash rate later this year if
inflation remains in check.
Value of dwelling commitments, Total No. of dwelling commitments, Owner
dwellings occupied housing
Figure 2: Source: ABS Table 5609 and relevant data April 2010.
Financial Analysis:
Key Numbers 1H FY09 1H FY10 % change
Net profit After Tax (NPAT) $6.4m $7.8m Up 21.9%
Loan Book $34.4b $37.7b Up 9.6%
Loan Settlements $4.1b $4.8b Up 17.1%
EPS 5.4c 6.5c Up 20.4%
DPS 4.75c 5.5c Up 15.8%
MOC produced solid numbers as can been seen above for the first half of the 2010 FY, but NPAT is
expected to be around $7m for the second half ending today. The dividend could be around the 5c mark
for the same period. As the loan book continues to increase at near or current rates, confidence is
maintained in earnings given the margins between franchisor and franchisee.
19. Figure 3: Relatively stable earnings despite a fall in the share of the mortgage market.
NPAT remains relatively stable and was sustained during the GED from late 2008 through to mid 2009.
The trend in NPAT appears to be in a tight range, but given it has occurred with a drop off in market share
(of the domestic home loan market) there is scope for improvement.
Cash and Recent Corporate Activity:
Cash at 31 Dec 2009 was $6.4m and is expected to be rather stable. Dividends payable is not expected
to alter cash balance significantly given the relative stable earnings.
No major corporate activity of late. Count Financial Group (ASX:COU) maintain their 17.23% ownership
in the company after increasing their stake in 2007/08. Potential of a takeover is evident as the COU
model of financial advice through accountants may be altered with the change in the way financial
advisors will be paid from 1 July 2012, thus reducing potential future earnings. A need to diversify
revenue, may lead to COU targeting MOC.
In November last year, MOC announced a small acquisition of mortgage aggregator Loankit. Mortgage
aggregators are businesses that have mortgage brokers, accountants, financial advisors, etc linked to
them who can lodge loans with varying institutions. The assets of Loankit included information technology
platforms, loan books and contracts with 50 mortgage brokers.
The launch into the loan aggregation market will operate completely independent of the franchise business
and is an example of MOC’s future diversification strategy.
In the past 2-3 years, MOC has also branched into offering life and income protection, by allowing brokers
to offer these products to clients when they decided to take out a mortgage. Leasing and personal finance
is another area that MOC have branched into; however the revenue generated from these activities are
insignificant to date and are expected to remain so for some time. Commercial mortgages and deposit
bonds are two further income sources, but again with minimal impact on earnings.
20. Options:
Number Strike Price Expiry Listed Potential Cash
2,500,000 $ 0.760 01/05/2019 No $ 1,900,000
There are no listed options for MOC, but the table above shows that 2.5m options (to mainly Directors) are
currently ‘in the money’ potentially providing the company with $1.9m in cash if exercised.
Dividend History:
One of the most attractive aspects of this company has been the dividends paid. Below is a table
depicting the recent history of the dividends and also it is noted that dividends are paid reasonably fast
(within 3 weeks) post the ex-dividend date. Dividends in the past have been fully franked and would be
expected to continue in this fashion.
Dividends
Ex Date Franked (%) Amount (cps) Paid Date Post Days
1/03/2010 100% 5.5 22/03/2010 21
26/08/2009 100% 5.5 16/09/2009 21
2/03/2009 100% 4.75 23/03/2009 21
25/08/2008 100% 8 15/09/2008 21
26/02/2008 100% 6 18/03/2008 21
27/08/2007 100% 8.5 18/09/2007 22
Dividends have been paid from the operating activities and no debt financing has been sourced for any
such payments.
Liquidity:
The average daily volume since 30 June 2007 is 171,770. It’s a level that is not overly liquid, but the stock
does trade in patches of volume.
MOC holds a minor weighting of 0.01% in the ASX All Ordinaries Index.
Board and Management:
The Chairman of the Board is Peter Ritchie who is also Deputy Chairman of Seven Network and
previously was Managing Director of McDonald’s Australia from 1974 to 1995 and was also Chairman
from 1995 to 2000, thus has experience in one of the world leading franchises. Peter was a Director of
Westpac Banking Corporation (WBC) from 1993 to 2002 thus experience in the banking and lending
market compliments the franchise experience.
Brothers Rod and Peter Higgins co-founded MOC and have many years experience in industries such as
finance, commercial and residential property.
Mike Russell was appointed Chief Executive Officer in April last year. Mike was Managing Director of
Choice Aggregation Services for 5 years before it was acquired by Challenger Financial Services. He has
previous experience at ANZ Banking Group and also spent 8 years as a self employed business
entrepreneur, thus has experience that can relate to being a MOC franchisee.