Transcend Automation is the Authorized distributor of Canary Labs for their products in India.We distribute/Market/Promote/Integrate their products for customers in India.
RLS Prototype ETL | Vision and Scope DocumentRyan Casey
The document outlines plans for a Row Level Security (RLS) prototype ETL project at TricorBraun. It will load security tables from Active Directory using PowerShell scripts to enable RLS on Microsoft Applications and reports. The project will create scripts to load user entitlements and security attributes from AD into staging tables to define access levels at the total company, division, region or customer level for testing RLS functionality. It requires coordination between IT and HR to determine dynamic access levels from employee data, and outlines deliverables, approach, clarifications and processes for completing the project.
SSRS RLS Prototype | Vision and Scope Document Ryan Casey
The document provides a vision and scope for a prototype project to implement row level security (RLS) in SQL Server Reporting Services (SSRS) reports. The prototype will apply RLS to a daily gross profit report using an entitlement table to filter data at the division, region, or customer level for each user. The deliverable will be a functional RLS prototype for SSRS using sample data and entitlement configuration by April 18th.
Business Intelligence for users - SharperlightMichell8240
1) Sharperlight provides live access to data across an entire organization, regardless of where the data is stored or what platform it's on, through a single reporting and business intelligence solution.
2) It extends access to SAP Business One data and other third party applications and data sources.
3) The solution includes modules for querying, reporting, Excel integration, and publishing reports to the web.
CXAIR is a next generation business intelligence tool that utilizes search technology to assemble data for querying and reporting. It allows users to query data using natural language searches and provides rapid filtering, visualization, and drill-down capabilities. CXAIR stores data at the transaction level for flexibility and performance while also including powerful security features.
This tutorial covers the topics of introduction to business intelligence with examples of BI scenarios and touches upon ETL(Extract, Transform and Load) operations using SSIS on SQL 2005 & 2008 and using DTS on SQL 2000. It contains introductions to crystal reports and SSRS. It compares Data warehouse and OLAP Cube. This tutorial concludes with topics on Data Mining and Dashboards.
Example of the BI application technology comparison based on customer needs and application capabilities performed by DWApplications.
This is one of 3 deliverables in the free BI Roadmap Assessment provided by DWApplications.
- BI application technology comparison
- Current and future state assessment
- Timeline, resource and implementation plan
If you are interested in a free BI roadmap assessment
Contact: scott.mitchell@dwapplications.com
Bharath B has over 8 years of experience in business intelligence and data warehousing solutions using Microsoft technologies such as SQL Server, Power BI, SSAS, SSIS, and SSRS. He has extensive experience designing, developing, testing, and deploying ETL processes, data modeling, and reports. His most recent roles include senior software engineer positions at Accenture and other companies where he contributed to projects in various industries including transportation, energy, and insurance.
DataLyzer Spectrum is stand-alone statistical process control (SPC) software that automates data collection, charting, and analysis. It allows data entry from various sources and displays control charts in real-time. The software produces sophisticated analysis with minimal user interaction. It has been developed since the late 1970s and was one of the first commercial SPC and measurement system analysis software packages.
BI 101 Presentation and examples of some of my work. Background information on Business Intelligence; BI Tool and Vendor Analysis; Current/Upcoming technology we are exploring and hope to leverage in the near future
SAP Crystal Server 2011 features include guided data exploration powered by SAP BusinessObjects Explorer, a unified user interface, simplified data access through semantic layers, and a new report design tool optimized for universe access. It provides a common experience for searching, exploring, reporting, and visualizing business data without needing assistance from IT.
Microsoft SQL Server Reporting Services (SSRS) allows users to create, manage, and view reports. It includes components like data sources, datasets, reports, output formats, delivery targets, and a metadata database. Reports can be authored in Visual Studio and deployed to a report server. When executed, the report server retrieves data from the data source, processes the report definition, and delivers outputs like HTML, Excel, PDF etc. to users on demand or via scheduled subscriptions.
The document describes TEKLABZ Network Engineer® Reporting Engine, a solution that allows users to access, analyze, and share network data across an organization. It provides predefined report templates, a guided report builder, interactive dashboards, and security controls. This helps businesses make informed decisions, improve performance tracking, and gain a competitive advantage with access to real-time network information.
AnalytiX DS Unified Software Platform for enterprise data mapping, governance and code automation manage data, metadata, data mappings and integration processes through the system development life-cycle (SDLC) process, enabling governance, automation transparency and lineage of the data in a single unified platform for data integration professionals
SQL Server Reporting Services (SSRS) is a reporting tool that allows users to create and view reports. It includes components like the Report Server, Report Builder, and Report Manager. When a user requests a report, the SSRS server retrieves data from sources, merges it with the report definition, and returns the generated report to the client. Reports in SSRS can be designed using Visual Studio and include things like datasets, parameters, charts, and expressions. Security and permissions are managed through roles and role assignments that control access to report content.
Unified Enterprise Data Mapping, Governance & Automation PlatformAnalytiX DS
The AnalytiX DS Unified Platform is an all-in-one platform to integrate Enterprise Metadata Management,data governance, and code automation into a single, comprehensive product suite to automate manual processes and truly accelerate the delivery of integration projects.
This document provides an overview of Microsoft SQL Server Reporting Services. It discusses developing reports using datasets, report design, parameters, deployment and management. Reporting Services allows generating reports from various data sources and integrating them into web and Windows applications. It also covers administration, caching, subscriptions and security.
Introduction to microsoft sql server 2008 r2Eduardo Castro
In this presentation we review the new features in SQL 2008 R2.
Regards,
Ing. Eduardo Castro Martinez, PhD
http://comunidadwindows.org
http://ecastrom.blogspot.com
Hovitaga Data Visualizer is a lightweight solution for real-time OLAP analysis and data visualization primarily for SAP systems. It can present data with a pivot grids, maps, charts, gauges, treemaps and lists. Dashboards can be created with drag and drop which may gather data from different systems to give decision makers stunning interfaces to have an overview of key business data at one place.
This paper gives an overview of the product.
This resume summarizes Rahul's experience working as a MicroStrategy developer for 7+ years. He has extensive experience building projects, reports, dashboards and other business intelligence tools using MicroStrategy software. Rahul also has experience installing, configuring and tuning MicroStrategy to optimize performance. His roles have involved requirements gathering, report design, testing and working with data teams to integrate data.
User can run queries via MicroStrategy’s visual interface without the need to write unfamiliar HiveQL or MapReduce scripts. In essence, any user, without programming skill in Hadoop, can ask questions against vast volumes of structured and unstructured data to gain valuable business insights.
Basics & Intro to SQL Server Reporting Services: Sql Server Ssrs 2008 R2Bala Subra
SQL Server Reporting Services provides reporting capabilities through traditional and interactive reports. It offers a scalable and manageable server infrastructure that integrates with SharePoint, Office applications, and browsers. The platform supports structured data like relational, hierarchical, and multidimensional data. SQL Server Reporting Services supports the full reporting lifecycle including authoring, management, and delivery of reports.
Microsoft Reporting Dashboarding and visual Analytics January 2016DesignMind
As of early 2016, Power BI added new updates which improve formatting and visualizations in addition to changes and improvements to in the Report Authoring functions. Other new features include a Preview Feature, improved data tables, an optimized Home ribbon layout, new data modeling, more options to control data connectivity. Microsoft is targeting business analysts with the updated features, and says you can “bring your data to life with Power BI and Excel".
SQL Server Reporting Services (SSRS) is a platform for developing, managing, and viewing reports. It includes tools for report development, a report server for management and viewing, and integrates with SharePoint. SSRS uses a multi-tier architecture with data, application, and server tiers. The server tier includes processor components that handle report execution and delivery. SSRS supports the full reporting lifecycle from development through management to user access.
Reporting and Business Insight BrochureRamzi Qaqish
This document describes TEKLABZ Network Engineer Reporting Engine, a solution for accessing and analyzing network data from within the Ericsson Network Engineer application. It enables creation of customizable reports from network data through a guided process. Pre-built report templates are provided for common use cases like bill of quantities, cabinet utilization, and work order progress. Reports can be viewed individually or published to dashboards for interactive monitoring of key performance indicators. The reporting engine integrates securely with Network Engineer's user permissions and roles.
This document provides an overview of Microsoft Business Intelligence tools including SQL Server Integration Services (SSIS), SQL Server Analysis Services (SSAS), and SQL Server Reporting Services (SSRS). It discusses how these tools are used to extract, transform, and load data from various sources into a centralized data warehouse for analysis and reporting. It also provides brief descriptions of the key features and functions of each tool in the reporting development lifecycle.
- SSRS with SQL Server 2008 R2 introduced several new features including improved data visualization, enhanced report design tools, support for additional data sources, and better collaboration and sharing capabilities.
- The user interface in Report Manager and Report Builder was simplified and enhanced with features like an AJAX report viewer and support for rotating text and additional chart types.
- Developers have additional tools for building reports including new lookup functions, calculating aggregates of aggregates, and publishing report parts to a gallery. Data can now be retrieved from SQL Azure, Parallel Data Warehouse, and SharePoint lists.
- Shared datasets and cache refresh plans improve performance and maintainability. Reports can also be rendered as Atom feeds for consumption in tools like Excel 2010
CXAIR is a next generation business intelligence tool that utilizes search technology to assemble data for querying and reporting. It allows users to query data using natural language searches and provides rapid filtering, visualization, drilling down and cross-tabulation of data from multiple sources. CXAIR also features secure dashboards and reports that can be customized and published for groups.
NLS Quest - BI Suite is a complete business intelligence solution that facilitates data integration, reporting, analysis, and dashboard setup through easy access to an organization's electronically stored data extracted in real-time. It provides flexible, reliable reporting and extractions through a drag-and-drop interface with high-level security and no modifications to the host database. The main components include N-Bridge for data extraction, reporting and dashboard designers, a data analysis engine, and a report server.
StreamAnalytix 2.0 is a multi-engine streaming analytics platform that allows users to deploy multiple streaming engines depending on their use case requirements. It features an easy to use drag-and-drop UI, support for predictive analytics, machine learning, and real-time dashboards. The platform provides a level of abstraction that gives customers flexibility in choosing the best streaming engine for their needs.
FineReport is a ‘professional, simple and flexible’ enterprise reporting software developed by FanRuan Software Co., Ltd., architecturally designed based on “No-code development” concept.
With FineReport, users can design complex reports and build a Decision-making Platform with drag-and-drop elements.
FineReport is a leading reporting software brand in China with the largest domestic market share and widespread clients in various in various industries and departments.
Here's updated and lite version of FineReport 10.0 Product Brochure!
StreamAnalytix 2.0 is a real-time data analytics platform that offers multi-engine support, allowing users to choose the best streaming engine for their use case. It provides an easy drag-and-drop UI and supports technologies like Spark Streaming, Kafka, and Storm. StreamAnalytix enables enterprises to analyze and respond to events in real time at big data scale.
Transcend Automation is the Authorized Distributors of Kepware Suite of OPC Products in India. We Market/Promote/Integrate their products for customers in India.
The document describes AnalytiX Mapping Manager, a software tool that manages metadata and automates the data mapping process. It has three core modules - Resource Manager, System Manager, and Mapping Manager. Key features include creating and versioning data mappings using a drag-and-drop interface, generating ETL jobs, managing projects and resources, and providing data lineage analysis and impact reports. Optional add-on modules provide additional integration and reporting capabilities.
iCAN is an effective tool for organizing and managing information. The solution automatically generates accurate, up-to-date documentation. It ensures project success by keeping track of the latest version of a change, and aids in production management by allowing your team to rapidly audit and analyze any significant problems or trends.
Easily imports your current Operations information using the components that are already incorporated into your environment (TWS, Control-M, CA-7, JCL,CFT, CICS, etc.)
Enabling Next Gen Analytics with Azure Data Lake and StreamSetsStreamsets Inc.
This document discusses enabling next generation analytics with Azure Data Lake. It provides definitions of big data and discusses how big data is a cornerstone of Cortana Intelligence. It also discusses challenges with big data like obtaining skills and determining value. The document then discusses Azure HDInsight and how it provides a cloud Spark and Hadoop service. It also discusses StreamSets and how it can be used for data movement and deployment on Azure VM or local machine. Finally, it discusses a use case of StreamSets at a major bank to move data from on-premise to Azure Data Lake and consolidate migration tools.
RUGGEDCOM REFLEX is a substation HMI solution that provides remote monitoring and control of substation operations. It supports protocols for devices decades old and modern IEDs. REFLEX incorporates enterprise data through its SQL architecture. It offers features like single line diagrams, alarm handling, historian logging, custom graphics, rapid deployment through templates, and scalability through clustering. Security includes encryption, authentication, and integration with Active Directory.
Streaming Data and Stream Processing with Apache Kafkaconfluent
Apache Kafka is an open-source streaming platform that can be used to build real-time data pipelines and streaming applications. It addresses challenges with diverse data sets arriving at increasing rates. The document discusses how Apache Kafka can help with challenges around data integration, stream processing, and managing streaming platforms at scale. It also outlines key features of Apache Kafka like the Kafka Connect API for data integration, the Kafka Streams API for stream processing, and Confluent Control Center for monitoring and management.
This document discusses various tools used for business analysis including reporting tools, managed query tools, executive information system tools, OLAP tools, data mining tools, and application development tools. It provides details on specific tools like Cognos Impromptu, Cactus, and FOCUS Fusion.
Delivering the power of data using Spring Cloud DataFlow and DataStax Enterpr...VMware Tanzu
This document discusses using Spring Cloud Data Flow and DataStax Enterprise to provide app developers insight into app performance. It summarizes DataStax Enterprise as an integrated platform for multi-model databases including key-value, tabular, JSON and graph models to support transactional, search and analytics workloads. It also discusses using Spring Cloud Data Flow to define and orchestrate data pipelines to source, process, analyze and flow data to downstream processes leveraging DataStax Enterprise.
The document describes Experion HS, a software platform for human-machine interfaces and supervisory control from Honeywell. Experion HS builds on Honeywell's existing Experion PKS platform to provide an affordable solution for smaller operations. It offers standard displays, intuitive navigation, powerful trending capabilities, and integrated hardware and software to support a range of applications from oil and gas to food and beverage. Experion HS can efficiently meet the needs of small to medium applications through its robust and customizable features.
This document contains a summary of Raj Ganesh Subramanian's work experience and qualifications. He has over 5 years of experience in data warehousing, ETL development, and database management. He has extensive experience with Informatica PowerCenter and has worked on projects for clients such as GE Transportation, GE Aviation, and IGATE Technologies. He has expertise in Oracle, SQL Server, Informatica, Unix scripting, and reporting tools such as Spotfire, Tableau, and Cognos.
The document discusses streaming data analytics and Hitachi's Streaming Data Platform (HSDP). HSDP is a real-time streaming software solution that can analyze massive amounts of data as it is generated in real-time. It allows businesses to gain valuable insights from data in motion and make timely decisions. HSDP is highly scalable, adaptable across industries, and can integrate with open source technologies. It enables use cases like real-time analytics, capturing perishable insights, and analyzing data distributed across locations and time.
The document discusses streaming data analytics and Hitachi's Streaming Data Platform (HSDP). HSDP is a real-time streaming software solution that can analyze massive amounts of data as it is generated in real-time. It allows businesses to gain valuable insights from data in motion and make timely decisions. HSDP is highly scalable, adaptable across industries, and can integrate with open source technologies. It enables use cases like real-time analytics, capturing perishable insights, and distributed analysis across geo-locations as data is born distributed.
Taking AI to the Next Level in Manufacturing.pdfssuserfac0301
Read Taking AI to the Next Level in Manufacturing to gain insights on AI adoption in the manufacturing industry, such as:
1. How quickly AI is being implemented in manufacturing.
2. Which barriers stand in the way of AI adoption.
3. How data quality and governance form the backbone of AI.
4. Organizational processes and structures that may inhibit effective AI adoption.
6. Ideas and approaches to help build your organization's AI strategy.
5th LF Energy Power Grid Model Meet-up SlidesDanBrown980551
5th Power Grid Model Meet-up
It is with great pleasure that we extend to you an invitation to the 5th Power Grid Model Meet-up, scheduled for 6th June 2024. This event will adopt a hybrid format, allowing participants to join us either through an online Mircosoft Teams session or in person at TU/e located at Den Dolech 2, Eindhoven, Netherlands. The meet-up will be hosted by Eindhoven University of Technology (TU/e), a research university specializing in engineering science & technology.
Power Grid Model
The global energy transition is placing new and unprecedented demands on Distribution System Operators (DSOs). Alongside upgrades to grid capacity, processes such as digitization, capacity optimization, and congestion management are becoming vital for delivering reliable services.
Power Grid Model is an open source project from Linux Foundation Energy and provides a calculation engine that is increasingly essential for DSOs. It offers a standards-based foundation enabling real-time power systems analysis, simulations of electrical power grids, and sophisticated what-if analysis. In addition, it enables in-depth studies and analysis of the electrical power grid’s behavior and performance. This comprehensive model incorporates essential factors such as power generation capacity, electrical losses, voltage levels, power flows, and system stability.
Power Grid Model is currently being applied in a wide variety of use cases, including grid planning, expansion, reliability, and congestion studies. It can also help in analyzing the impact of renewable energy integration, assessing the effects of disturbances or faults, and developing strategies for grid control and optimization.
What to expect
For the upcoming meetup we are organizing, we have an exciting lineup of activities planned:
-Insightful presentations covering two practical applications of the Power Grid Model.
-An update on the latest advancements in Power Grid -Model technology during the first and second quarters of 2024.
-An interactive brainstorming session to discuss and propose new feature requests.
-An opportunity to connect with fellow Power Grid Model enthusiasts and users.
Northern Engraving | Nameplate Manufacturing Process - 2024Northern Engraving
Manufacturing custom quality metal nameplates and badges involves several standard operations. Processes include sheet prep, lithography, screening, coating, punch press and inspection. All decoration is completed in the flat sheet with adhesive and tooling operations following. The possibilities for creating unique durable nameplates are endless. How will you create your brand identity? We can help!
"Choosing proper type of scaling", Olena SyrotaFwdays
Imagine an IoT processing system that is already quite mature and production-ready and for which client coverage is growing and scaling and performance aspects are life and death questions. The system has Redis, MongoDB, and stream processing based on ksqldb. In this talk, firstly, we will analyze scaling approaches and then select the proper ones for our system.
The Microsoft 365 Migration Tutorial For Beginner.pptxoperationspcvita
This presentation will help you understand the power of Microsoft 365. However, we have mentioned every productivity app included in Office 365. Additionally, we have suggested the migration situation related to Office 365 and how we can help you.
You can also read: https://www.systoolsgroup.com/updates/office-365-tenant-to-tenant-migration-step-by-step-complete-guide/
LF Energy Webinar: Carbon Data Specifications: Mechanisms to Improve Data Acc...DanBrown980551
This LF Energy webinar took place June 20, 2024. It featured:
-Alex Thornton, LF Energy
-Hallie Cramer, Google
-Daniel Roesler, UtilityAPI
-Henry Richardson, WattTime
In response to the urgency and scale required to effectively address climate change, open source solutions offer significant potential for driving innovation and progress. Currently, there is a growing demand for standardization and interoperability in energy data and modeling. Open source standards and specifications within the energy sector can also alleviate challenges associated with data fragmentation, transparency, and accessibility. At the same time, it is crucial to consider privacy and security concerns throughout the development of open source platforms.
This webinar will delve into the motivations behind establishing LF Energy’s Carbon Data Specification Consortium. It will provide an overview of the draft specifications and the ongoing progress made by the respective working groups.
Three primary specifications will be discussed:
-Discovery and client registration, emphasizing transparent processes and secure and private access
-Customer data, centering around customer tariffs, bills, energy usage, and full consumption disclosure
-Power systems data, focusing on grid data, inclusive of transmission and distribution networks, generation, intergrid power flows, and market settlement data
zkStudyClub - LatticeFold: A Lattice-based Folding Scheme and its Application...Alex Pruden
Folding is a recent technique for building efficient recursive SNARKs. Several elegant folding protocols have been proposed, such as Nova, Supernova, Hypernova, Protostar, and others. However, all of them rely on an additively homomorphic commitment scheme based on discrete log, and are therefore not post-quantum secure. In this work we present LatticeFold, the first lattice-based folding protocol based on the Module SIS problem. This folding protocol naturally leads to an efficient recursive lattice-based SNARK and an efficient PCD scheme. LatticeFold supports folding low-degree relations, such as R1CS, as well as high-degree relations, such as CCS. The key challenge is to construct a secure folding protocol that works with the Ajtai commitment scheme. The difficulty, is ensuring that extracted witnesses are low norm through many rounds of folding. We present a novel technique using the sumcheck protocol to ensure that extracted witnesses are always low norm no matter how many rounds of folding are used. Our evaluation of the final proof system suggests that it is as performant as Hypernova, while providing post-quantum security.
Paper Link: https://eprint.iacr.org/2024/257
In the realm of cybersecurity, offensive security practices act as a critical shield. By simulating real-world attacks in a controlled environment, these techniques expose vulnerabilities before malicious actors can exploit them. This proactive approach allows manufacturers to identify and fix weaknesses, significantly enhancing system security.
This presentation delves into the development of a system designed to mimic Galileo's Open Service signal using software-defined radio (SDR) technology. We'll begin with a foundational overview of both Global Navigation Satellite Systems (GNSS) and the intricacies of digital signal processing.
The presentation culminates in a live demonstration. We'll showcase the manipulation of Galileo's Open Service pilot signal, simulating an attack on various software and hardware systems. This practical demonstration serves to highlight the potential consequences of unaddressed vulnerabilities, emphasizing the importance of offensive security practices in safeguarding critical infrastructure.
inQuba Webinar Mastering Customer Journey Management with Dr Graham HillLizaNolte
HERE IS YOUR WEBINAR CONTENT! 'Mastering Customer Journey Management with Dr. Graham Hill'. We hope you find the webinar recording both insightful and enjoyable.
In this webinar, we explored essential aspects of Customer Journey Management and personalization. Here’s a summary of the key insights and topics discussed:
Key Takeaways:
Understanding the Customer Journey: Dr. Hill emphasized the importance of mapping and understanding the complete customer journey to identify touchpoints and opportunities for improvement.
Personalization Strategies: We discussed how to leverage data and insights to create personalized experiences that resonate with customers.
Technology Integration: Insights were shared on how inQuba’s advanced technology can streamline customer interactions and drive operational efficiency.
Conversational agents, or chatbots, are increasingly used to access all sorts of services using natural language. While open-domain chatbots - like ChatGPT - can converse on any topic, task-oriented chatbots - the focus of this paper - are designed for specific tasks, like booking a flight, obtaining customer support, or setting an appointment. Like any other software, task-oriented chatbots need to be properly tested, usually by defining and executing test scenarios (i.e., sequences of user-chatbot interactions). However, there is currently a lack of methods to quantify the completeness and strength of such test scenarios, which can lead to low-quality tests, and hence to buggy chatbots.
To fill this gap, we propose adapting mutation testing (MuT) for task-oriented chatbots. To this end, we introduce a set of mutation operators that emulate faults in chatbot designs, an architecture that enables MuT on chatbots built using heterogeneous technologies, and a practical realisation as an Eclipse plugin. Moreover, we evaluate the applicability, effectiveness and efficiency of our approach on open-source chatbots, with promising results.
Connector Corner: Seamlessly power UiPath Apps, GenAI with prebuilt connectorsDianaGray10
Join us to learn how UiPath Apps can directly and easily interact with prebuilt connectors via Integration Service--including Salesforce, ServiceNow, Open GenAI, and more.
The best part is you can achieve this without building a custom workflow! Say goodbye to the hassle of using separate automations to call APIs. By seamlessly integrating within App Studio, you can now easily streamline your workflow, while gaining direct access to our Connector Catalog of popular applications.
We’ll discuss and demo the benefits of UiPath Apps and connectors including:
Creating a compelling user experience for any software, without the limitations of APIs.
Accelerating the app creation process, saving time and effort
Enjoying high-performance CRUD (create, read, update, delete) operations, for
seamless data management.
Speakers:
Russell Alfeche, Technology Leader, RPA at qBotic and UiPath MVP
Charlie Greenberg, host
Introduction of Cybersecurity with OSS at Code Europe 2024Hiroshi SHIBATA
I develop the Ruby programming language, RubyGems, and Bundler, which are package managers for Ruby. Today, I will introduce how to enhance the security of your application using open-source software (OSS) examples from Ruby and RubyGems.
The first topic is CVE (Common Vulnerabilities and Exposures). I have published CVEs many times. But what exactly is a CVE? I'll provide a basic understanding of CVEs and explain how to detect and handle vulnerabilities in OSS.
Next, let's discuss package managers. Package managers play a critical role in the OSS ecosystem. I'll explain how to manage library dependencies in your application.
I'll share insights into how the Ruby and RubyGems core team works to keep our ecosystem safe. By the end of this talk, you'll have a better understanding of how to safeguard your code.
Discover top-tier mobile app development services, offering innovative solutions for iOS and Android. Enhance your business with custom, user-friendly mobile applications.
How information systems are built or acquired puts information, which is what they should be about, in a secondary place. Our language adapted accordingly, and we no longer talk about information systems but applications. Applications evolved in a way to break data into diverse fragments, tightly coupled with applications and expensive to integrate. The result is technical debt, which is re-paid by taking even bigger "loans", resulting in an ever-increasing technical debt. Software engineering and procurement practices work in sync with market forces to maintain this trend. This talk demonstrates how natural this situation is. The question is: can something be done to reverse the trend?
"Scaling RAG Applications to serve millions of users", Kevin GoedeckeFwdays
How we managed to grow and scale a RAG application from zero to thousands of users in 7 months. Lessons from technical challenges around managing high load for LLMs, RAGs and Vector databases.
"Scaling RAG Applications to serve millions of users", Kevin Goedecke
Transcend Automation Canary Lab Products
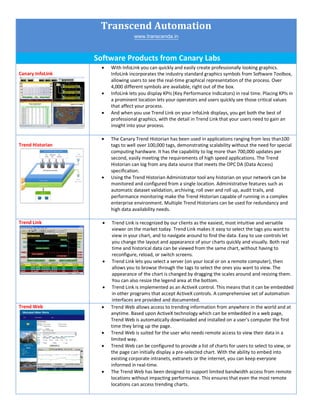
1. Transcend Automation
www.transcenda.in
Software Products from Canary Labs
With InfoLink you can quickly and easily create professionally looking graphics.
Canary InfoLink InfoLink incorporates the industry standard graphics symbols from Software Toolbox,
allowing users to see the real-time graphical representation of the process. Over
4,000 different symbols are available, right out of the box.
InfoLink lets you display KPIs (Key Performance Indicators) in real time. Placing KPIs in
a prominent location lets your operators and users quickly see those critical values
that affect your process.
And when you use Trend Link on your InfoLink displays, you get both the best of
professional graphics, with the detail in Trend Link that your users need to gain an
insight into your process.
The Canary Trend Historian has been used in applications ranging from less than100
Trend Historian tags to well over 100,000 tags, demonstrating scalability without the need for special
computing hardware. It has the capability to log more than 700,000 updates per
second, easily meeting the requirements of high speed applications. The Trend
Historian can log from any data source that meets the OPC DA (Data Access)
specification.
Using the Trend Historian Administrator tool any historian on your network can be
monitored and configured from a single location. Administrative features such as
automatic dataset validation, archiving, roll over and roll up, audit trails, and
performance monitoring make the Trend Historian capable of running in a complex
enterprise environment. Multiple Trend Historians can be used for redundancy and
high data availability needs.
Trend Link Trend Link is recognized by our clients as the easiest, most intuitive and versatile
viewer on the market today. Trend Link makes it easy to select the tags you want to
view in your chart, and to navigate around to find the data. Easy to use controls let
you change the layout and appearance of your charts quickly and visually. Both real
time and historical data can be viewed from the same chart, without having to
reconfigure, reload, or switch screens.
Trend Link lets you select a server (on your local or on a remote computer), then
allows you to browse through the tags to select the ones you want to view. The
appearance of the chart is changed by dragging the scales around and resizing them.
You can also resize the legend area at the bottom.
Trend Link is implemented as an ActiveX control. This means that it can be embedded
in other programs that accept ActiveX controls. A comprehensive set of automation
interfaces are provided and documented.
Trend Web Trend Web allows access to trending information from anywhere in the world and at
anytime. Based upon ActiveX technology which can be embedded in a web page,
Trend Web is automatically downloaded and installed on a user's computer the first
time they bring up the page.
Trend Web is suited for the user who needs remote access to view their data in a
limited way.
Trend Web can be configured to provide a list of charts for users to select to view, or
the page can initially display a pre-selected chart. With the ability to embed into
existing corporate intranets, extranets or the internet, you can keep everyone
informed in real-time.
The Trend Web has been designed to support limited bandwidth access from remote
locations without impacting performance. This ensures that even the most remote
locations can access trending charts.