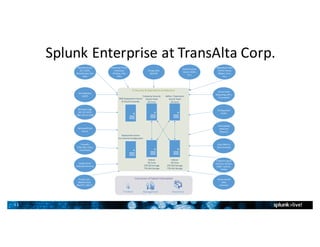
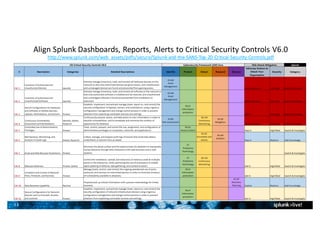
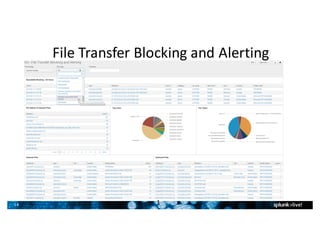
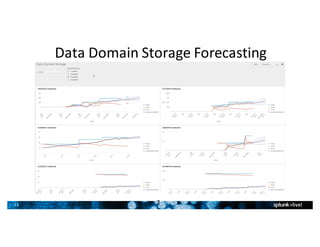
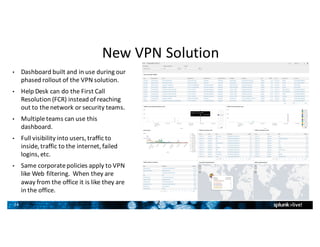
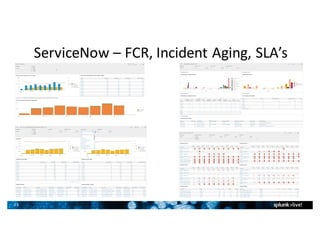
Copyright	 ©	2015	Splunk	Inc.
Single	Pane	of	Glass	for	Security	
and	Operational	Intelligence
2
Kent	Farries,	Sr.	Systems	
Analyst,	Security	
Intelligence	&	Analytics
3
Agenda
• Introduction	&	Background
• Architecture	&	Data	Sources
• Security	Operations
• Infrastructure	Operations
• DevOps
• What’s	Next
• Q&A
4
TransAlta	Overview
• Over	one	hundred	years	of	power	generation
• Wind,	hydro,	solar,	natural	gas,	coal
• Clean	Power	Transition	Underway
• Operations	in	Canada,	U.S.	and	Australia
• Well	respected	power	generator	and	wholesale	marketer	of	electricity
• IT	Security	Team	based	in	Calgary	with	SOC	outsourced
5
My	Background	and	Role
• I	have	been	with	TransAlta	for	16	Years	in	various	roles	over	the	years.		
Desktop,	Server,	 Manager,	Architect.		Currently	Focused	on	Security	and	
Operational	Intelligence.
• We	are	dedicated	to	the	protection	of	TransAlta’s	computing	infrastructure	
while	enabling	a	safe	computing	landscape	where	the	people	of	TransAlta	can	
conduct	business	efficiently.
• Favorite	Splunk	t-shirt
• I	like	big	data	and	I	cannot	lie.
• Interesting	fun	fact	about	me
• I	was	a	video	game	champion	in	1982	and	you	can	find	me	listed	in	IMDB	for	the	
Chasing	Ghosts	Documentary	as	well	as	on	the	Twin	Galaxies	gaming	site.
6
How	We	Got	Started
• Previous	SIEM:	ArcSight	−	since	2009	
• Difficult	for	team	of	certified	professionals	to	get	value	out	of	tool
• Impossible	to	do	advanced	correlations
• Encountered	staffing	challenges	in	the	2013-2014	timeframe
• Talented	SIEM	team	struggled	to	build	actionable	dashboards,	reports,	
alerts
7
Enter	Splunk
• Splunk	introduced	to	our	DevOps	&	IT	Security	teams
• 2	month	POC		– brought	in	more	data	sources	than	was	possible	in	3	years	with	previous	SIEM
• Presented	to	management	– identified	immediate	value	for	IT	Security	and	DevOps
• Purchased	Splunk	in	December	2014,	went	live	in	production	Q1	2015
• Fast	time	to	value		– all	without	any	training.		Training	is	needed	for	advanced	deployments.
• Two	staff	now	support	Splunk	part-time
• 18	billion	events	per	month
• 100GB/day	currently,	moving	to	150GB/day	by	Q3	2016
• Over	30	threat	feeds	are	used	in	SecOps and	the	Enterprise	Security	Application
8
Broad	Use	Cases
• IT	Security,	IT	operations	and	DevOps	today
• Ability	to	combine	security	and	operational	information	with	relative	ease
• Significantly	reduce	investigation	phase	for	security	and	operational	issues
• Approximately	200	to	300	use	case	line	items	translate	into	high	level		dashboards	
• 10-12	key	security	use	cases	that	fall	into	these	high	level	categories
ê Incident	Investigations	&	Forensics
ê Security	&	Compliance	Reporting
ê Real-Time	Monitoring	of	Known	Threats
ê Detect	Unknown	Threats
ê Insider	Threat
9
Wide-ranging	Benefits
• Answer	questions	we	have	and	questions	we	had	not	thought	to	ask	yet
• Faster	forensic	analysis
• Analysts	speed	time	to	resolution
• Reduce	cross	functional	team	questions.		Provide	relevant	information	in	one	place.
• Trending	reports	drive	business	decisions
• Created	elaborate	new	use	cases	we	only	dreamt	of	in	the	past	
ê Reconnaissance	events	on	our	perimeter	firewalls	or	DMZ	firewall	detected,	Splunk	
adds	the	IP	to	a	Dynamic	Block	list	in	our	Firewall.		Splunk creates	a	corresponding	
ticket	in	ServiceNow.		This	can	be	done	for	Brute	force	style	attacks	against	SFTP	
servers	or	Web	Servers	as	well.
ê Move	from	basic	SIEM	to	enriching	the	results	with	our	Identity	Information,	
Internal	Locations,	Geolocations,	and	more.
10
Legacy	SIEM	vs	SIEM	with	Data	Enrichment
11
Splunk	Enterprise	at	TransAlta	Corp.
Consumers	of	Splunk	Information
IT	Security	&	Operations	Architecture
Enterprise	Security
Search	Head
28	Cores
AdHoc	/	Operations
Search	Head
28	Cores
Indexer
28	Cores
2TB	SSD	Storage
7TB	SAS	Storage
Indexer
28	Cores
2TB	SSD	Storage
7TB	SAS	Storage
Windows	Logs
(AD,	IIS,	DHCP,	
DNS,	Device-USB)
Anti-Malware
(SCEP)
Vulnerability	
Detection
(Nessus)
Service	Now	
(Reporting,	KPI’s,	
Correlation)
Firewalls
(Palo	Alto,	Cisco,	
CheckPoint)
Threat	Lists,	
Blacklist	Data
(Bad	IP’s,	C&C’s)
Configuration	
Audits
Operational	Data
(Performance,	
Allegro,	Error,	
etc.)
Remote	Access
(F5,	CISCO,	
DirectAccess,	Palo	
Alto)
Unstructured	
Data
(Varonis)
Advanced	Threat	
Protection
(FireEye,	Palo	
Alto)
Cloud	Services
(Azure,	O365,	
etc.)
Energy	Data
(SCADA)
ExecutivesIT	Admin Management
Deployment	Server
For	Internal	Configuration
DMZ	Deployment	Server
&	Cloud	Forwarder
Endpoint	Logs	&	
Forensics	(Scripts,	
EMET,	Sysmon,	
SCCM)
Honeywell	Card	
Access
Syslog	Server	
(Network	Devices)
Store	Metrics
(Data	Domain)
12
Security	Dashboards
13
Align	Splunk	Dashboards,	Reports,	Alerts	to	Critical	Security	Controls	V6.0
http://www.splunk.com/web_assets/pdfs/secure/Splunk-and-the-SANS-Top-20-Critical-Security-Controls.pdf
14
File	Transfer	Blocking	and	Alerting
1
4
15
Office	365	– Exchange	Online	Protection
1
5
16
Exploit	Kits	Blocking	Trends
1
6
17
FireEye	Alerts	and	Drilldown
1
7
18
SCEP	Antivirus
1
8
19
Blocking	Threats
1
9
20
User	Investigation
2
0
21
Operations	Dashboards
2
1
22
SaaS	Analysis
2
2
23
Data	Domain	Storage	Forecasting
2
3
24
New	VPN	Solution
• Dashboard	built	and	in	use	during	our	
phased	rollout	of	the	VPN	solution.
• Help	Desk	can	do	the	First	Call	
Resolution	(FCR)	instead	of	reaching	
out	to	the	network	or	security	teams.
• Multiple	teams	can	use	this	
dashboard.
• Full	visibility	into	users,	traffic	to	
inside,	traffic	to	the	internet,	failed	
logins,	etc.
• Same	corporate	policies	apply	to	VPN	
like	Web	filtering.		When	they	are	
away	from	the	office	it	is	like	they	are	
in	the	office.
2
4
25
ServiceNow – FCR,	Incident	Aging,	SLA’s
26
DevOps	Dashboards
2
6
27
DevOps	Team
• IT	Trading	&	Marketing	team	use	Splunk	daily	to	monitor	
our	Energy	Trading	Risk	Management	(ETRM)	system
• Helped	deliver	multi-million	dollar	system	in	2015	with	
many	components	including	cloud	under	tight	timelines
• Actively	used	for	
– Production	monitoring,	alerting,	and	investigations	
with	dashboards
– A/B	testing	analysis	with	reports
– Application	development	with	SPL	searches
• Telemetry	generated	and	enriched	using	data	from
– Windows	performance	and	event	logs
– IIS	web	logs
– Third-party	application	performance	and	logs,	
including	custom	instrumentation
– Other	external	sources
28
• Service	Optimization
• One	“helper”	application	consuming	halfof	system	network	data
• Approximately	1	TB/day	(across	all	environments)
• Application	didn’t	even	use	the	data!
• Helper	and	service	optimized,	server	and	network	load	significantly	reduced
DevOps	Team
One	service	generating	
majority	of	network	traffic
29
• Energy	Trade	Valuation	Optimization
• Trades	must	be	valued	by	ETRM	system	for	daily	report	generation
• Splunk	dashboard	highlights	valuations	taking	longer	than	expected	duration
• Impacts	ability	of	on-time	delivery	of	report
• Below,	two	long-duration	trade	valuations	investigated	
• Trade	properties	adjusted	to	decrease	duration	required	to	calculate	value
• Report	also	used	for	
• Trending	analysis	
• QA	(A/B	testing)
• Development
DevOps	Team
Long	duration	
valuation	outliers
30
What’s	Next?
3
0
31
What’s	Next	– Part	1
• Deploy	Endpoint	Detection	solution	built	around	free	tools	and	the	Splunk	Forwarder	for	
approximately	3,000	systems
• Designed	to	be	part	of	our	Windows	10	rollout	which	is	underway
Data	to	Collect Some	Benefits
Windows	Event	Logs Operational Events	&	Increased	Accuracy	for	Account	Logins
Proactive	Troubleshooting
Software	Restrictions	monitoring
EMET Event	Log	Data
Device	Logs	for	USB Flash	Drives	being	used	and	time	inserted.		Correlate	to	events.
Local	Users	and	Groups Compliance,	Audit,	Security
SCCM	Logs Enhance	deployment	tool	(SCCM)	reporting	and	troubleshooting	capabilities
SysmonLogs On-demand	forensics	using	Sysmom.		Forwarder	install	has	configs.
Autoruns Output Check	over	100	startup	locations	for	software	against	50+	antivirus	engines.
Dedup SHA	hashes	and	compare	to	virus	total	or	other	source	like	CCIRC	IOC’s
Find	unsanctioned	programs	by	whitelisting	valid	SHA	hashes	in	a	lookup.
PowerShell Custom	scripts	for	more	accurate	reporting
32
First	Concept	of	Endpoint	Dashboard
33
What’s	Next	– Part	2
• Splunk	reports	embedded	into	SharePoint
• Security	Awareness
• SharePoint	team	site	usage	by	department,	manager,	user
• ServiceNow integration	for	creating	tickets
• Palo	Alto	integration	for	managing	dynamic	block	lists	from	Splunk
• Remove	network	team	from	doing	this	
• SOC	or	IT	Security	can	immediately	add	a	bad	URL	or	IP	to	block	list
• Enhance	dashboards,	reports	and	alerts	based	on	summary	index	and	data	models
• NERC	(North	American	Electric	Reliability	Corporation)	Compliance
• Used	to	monitor	OT	Networks	&	Systems	which	includes	security	and	operational	data
• Additional	data	sources
• Azure,	Azure	OMS,	VMWare,	SCOM,	EMC	Storage,	other	cloud	services,etc.
•
34
Top	Takeaways
• Setup	a	POC
• Easy	to	onboard	data	and	do	basic	searches
• Fast	time	to	see	value
• Have	an	SE	help	you	build	our	key	use	cases.		We	did	ours	in	a	couple	of	days.
• You’ll	see	the	magic	and	value	of	Splunk	quickly,	it	still	amazes	us	1	½	year	later.
• Think	building	blocks.		You	learn	a	little	and	build	on	it	and	reuse	what	you	have	learned.		You	
will	be	amazed	what	you	can	do.		Boss	asks	for	something	and	before	he	gets	back	to	his	desk	it	
is	done	in	a	lot	of	cases.
• Ease	of	use	versus	other	solutions
• More	than	just	a	SIEM,	can	do	so	much	more	and	benefits	extend	to	multiple	teams	
including	the	business.
• BI	tools	can’t	replace	Splunk	and	were	not	designed	too.
• Splunk	has	become	an	indispensable	tool/solution.
35
Recap
• If	you	heard	that	Splunk	is	expensive	take	another	look.		Splunk	is	a	disrupter	if	you	want	it	to	be.
• Look	for	opportunities	to	swap	technologies	to	offset	the	cost
• Get	a	bare	bones	Vulnerability	Assessment	tool	and	with	Splunk	you	can	get	the	correlation	and	all	the	fancy	
dashboards	at	a	fraction	of	the	price	with	a	good	portion	of	the	functionality.
• Concerned	about	SaaS	apps	and	Shadow	IT?		If	your	NGFW	has	the	capability	like	Palo	Alto	you	can	Splunk	
the	data	and	enrich	it	with	your	Identity	information	for	basically	free.
• Splunk	your	Storage	and	you	might	be	surprised	to	find	new	cost	saving	opportunities.
• Savings	or	cost	avoidance	for	us	are	100K	to	over	1	Million	depending	on	your	math.		Splunk	has	displaced	
existing	technologies	and	future	purchases	at	TransAlta.		Simplification	was	an	added	value	for	Support	
Teams.
• Ransomware is	everywhere	and	here	is	where	Splunk	can	help
• Use	Splunk	to	analyze	your	logs	and	then	implement	preventative	measures
• If	you	have	a	NGFW	implement	GeoBlocking,	File	Blocking,	Dynamic	Block	Lists
• If	you	have	Office	365	&	EOP	implement	blocking	for	ZIP	files,	Executable	content,	and	Geo	Locations.		Bring	
in	the	logs	into	Splunk	using	Remote	PowerShell.
• Use	Group	Policy	to	lock	down	the	Macros	in	Office.		Office	2016	has	a	new	option	which	helps	a	lot.
• Implement	Software	Restrictions	and/or	AppLocker.
36
Q&A
• Contact	Information
• E-Mail:	Kent_Farries@transalta.com
• You	can	find	me	on	LinkedIn
• If	you	want	a	copy	of	Splunk	&	the	Critical	Security	Controls	V6.0	
mapping	just	e-mail	me	and	I	will	send	you	a	copy.		
• It’s	important	to	have	collaboration	and	sharing	in	our	community	as	we	all	
operate	with	limited	resources	and	our	list	of	adversaries	or	business	challenges	
are	increasing	like	never	before.
• If	you	would	like	to	discuss	further	come	and	see	me	during	the	break
Thank	You

Transalta Customer Presentation

Editor's Notes

  • #11 From previous slide. This is one use case we only dreamed of building with our previous SIEM. We enrich the data with our Active Directory information like identity and location.
  • #12 Purchased 100GB/Day to start for the first year with volumes mostly between 50-70GB/Day. Licensed for 200GB now for the second year and now we are 90-100GB with 150GB by Q3, 2016. 1 Year of data 3TB used on SSD’s for hot storage 5TB used on SAS for cold storage 12TB available after 1 year. We have over 20 data sources.
  • #14 This slide shows how we align Splunk to the 20 Critical Security Controls. Search & Investigate, Add Knowledge, Monitor & Alert, Report & Analyze.
  • #15 Used to streamline analyst searching and researching an incident. Enhance Firewall Rules Change User behavior
  • #16 We started to block ZIP files as most Ransomware hides javascript files inside. We analyzed the data and noticed that EOP would not stop 100% or even close as the .js (Java Script) files are changed in almost every ZIP file. We also block executable content so those Office files (Word) with Macros will be blocked.
  • #17 Based on this information we can see what it trying to get in. We are using this information to see how we can better tune our firewall to block these. E.g. using the continue feature in Palo Alto.
  • #18 Security Analysts can see browsing history from our Palo Alto firewall without going into other tools. We can also see the file names can in certain cases be very valuable during the incident response process.
  • #19 Security Analysts can see browsing history from our Palo Alto firewall without going into other tools. We can also see the file names. We analyze each instance to see where we can enhance our protection technologies or security awareness program
  • #20 15 to 20 Million a day are blocked. We use dashboards like this to see how effective our new controls are that we are putting in place. We analyze the data in Splunk, recommend and then make changes, and then repeat the process.
  • #21 The initial conversation with management or the business and the follow up reporting would take days. We have reduced this to minutes. Further details are provided in other dashboards if justified. We just provided them this screen shot for the given user(s).
  • #23 These tools can cost well over 50K and would not have our key internal data like Employee Type, Manager, Department, location. We enrich this data from Palo Alto with our Active Directory information.
  • #24 Helped save my boss a bunch of money since he no longer needed to buy additional storage and could see our whole landscape. He could run his own predictions.
  • #25 We already have a full Dashboard that we give to your Help Desk to they can do the First Call Resolution (FCR) instead of reaching out to the network or security teams.
  • #26 ServiceNow was to go to production and we found out at the last minute that the dashboards within ServiceNow did not meet our operational teams requirements for reporting. Basically the solution was not like our old Remedy dashboard which were heavily customized. We built these out over a couple of weeks. Toughest part was understand the ServiceNow data. Splunk and team saved the day!!!
  • #28 IT Trading & Marketing team use Splunk daily to monitor our Energy Trading Risk Management (ETRM) system Helped deliver multi-million dollar system in 2015 with many components including cloud under tight timelines Actively used for Production monitoring, alerting, and investigations with dashboards A/B testing analysis with reports Application development with SPL searches Telemetry generated and enriched using data from Windows perfmon and event logs IIS web logs Application perform and logs, including custom instrumentation Other external sources
  • #29 Service Optimization One “helper” application consuming half of system network data Approximately 1 TB/day (across all environments) Application didn’t even use the data! Helper and service optimized, server and network load significantly reduced
  • #30 Valuation Optimization Highlight areas where performance is Valuations were investigated and slight changes to properties made to decrease time needed for overall valuation process to complete Report used for trending analysis and QA (A/B testing)
  • #32 Provide more information to the team so we can make an informed decision around what additional tools or technologies we might need to protect our company. Endpoint Detection and Response solutions are still in the Gold Rush days based on Gartner’s Endpoint report. Do we need Exploit Prevention? Do we need to do a better job on patching? We could go an spend money now on a product but would that be money well spent. This solution is very beneficial and would be complementary to any other solution that we might purchase.
  • #33 We will have multiple Dashboards and the data collected by Splunk will be correlated into many other dashboard like we do with Web traffic. Whitelist the startup programs. Show only systems that deviate from our standards. Whitelist the running applications and processes. Show only systems that deviate from our standards. Monitor USB access to see if how big of a problem we might have and if we need sanctioned USB drives in Corporate or just block access via GPO for mass media. On demand forensics with sysmon. We have the configuration setup in the Splunk Forwarder so just install with deployment tool of choice. SCCM, GPO, psexec. Compare any startup programs against over 50 AntiVirus engines.
  • #34 Summer students have started to use Splunk. They create a report and imbed it into SharePoint for the owners of a given site to see. We have many jobs and are not dedicated to security. When we have time we will bring in these other source. Most of these are low cost from a Splunk licensing perspective.