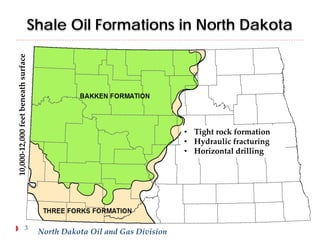
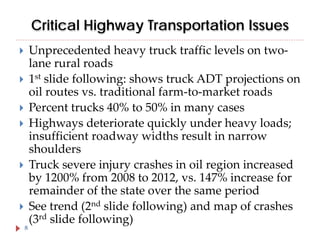
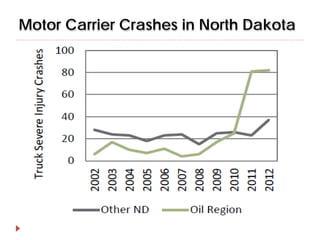
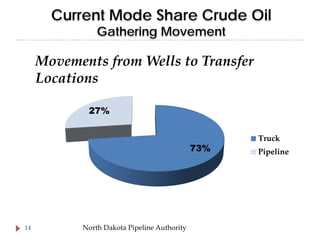
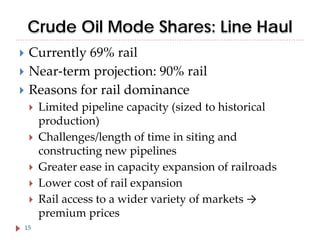
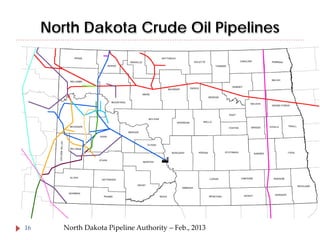
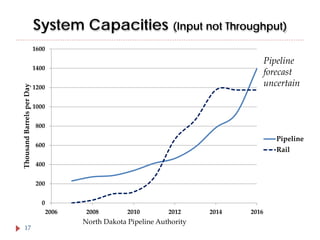
Traffic Growth and
Transportation Safety in the
Bakken Oil Producing
Region
Denver Tolliver
Upper Great Plains Transportation Institute
North Dakota State University
1
Introduction


Director: Upper Great Plains Transportation Institute
(UGPTI), North Dakota State University



Director: Mountain-Plains Consortium (MPC),
Region 8 University Transportation Center (NDSU)



Consortium member: Small Urban & Rural
Livability UTC (Montana State U.); NTI

• UGPTI’s Lakewood CO center develops/updates
FMCSA software: (1) inspection apps: e.g., Aspen, ISS,
QC; (2) investigative apps: e.g. , CAPRI, CDLIS Access,
UFA, CaseRite
2
10,000-12,000 feet beneath surface

Shale Oil Formations in North Dakota

3

• Tight rock formation
• Hydraulic fracturing
• Horizontal drilling

North Dakota Oil and Gas Division
Horizontal versus Vertical Wells

8-12 horizontal
wells per 1,280
acre spacing unit

Vertical Well
4

Horizontal Well
Production Trends and Potential
ND is producing roughly 1 million barrels of oil per
day (BOPD)
Production may increase to 1.6 million BOPD
Dept. of Mineral Resources projects 10-14 billion
barrels of technically recoverable reserves
Industry projections (e.g., Continental Resources) are
much higher—e.g., 20+ billion barrels
Continental Resources estimates in-place oil reserves
of 900 billion barrels
60,000 new wells will be drilled over next 20-30 years
See following production charts








5
Annual Oil Production: North Dakota
300

Million barrels

250

200

150

100

50

0

1950
6

1960

1970

1980

1990

2000

2010

North Dakota is second leading state in oil production
Number of Oil Wells: North Dakota
90
80

Hundreds of Wells

70
60
50
40
30
20
10
1990
7

1995

2000

2005

2010

Currently: 10,000+ producing wells

2015
Critical Highway Transportation Issues








8

Unprecedented heavy truck traffic levels on twolane rural roads
1st slide following: shows truck ADT projections on
oil routes vs. traditional farm-to-market roads
Percent trucks 40% to 50% in many cases
Highways deteriorate quickly under heavy loads;
insufficient roadway widths result in narrow
shoulders
Truck severe injury crashes in oil region increased
by 1200% from 2008 to 2012, vs. 147% increase for
remainder of the state over the same period
See trend (2nd slide following) and map of crashes
(3rd slide following)
Avg. Projected Truck ADT on County Roads for Three
Heavily Impacted Oil Counties (with Control Case)

9

Slope County (not impacted by oil production) illustrates
traditional truck traffic levels
Motor Carrier Crashes in North Dakota
11
Materials and Product Flows


Inputs (e.g., sand, water, chemicals) move to well
site for hydraulic fracturing and production



Specialized equipment (drilling and workover rigs)
move to and from well site



1st slide following shows 2,300 drilling-related truck
trips per well



Outbound crude initially moves by truck to pipeline
or rail transfer location (2nd slide following); may
shift to small diameter pipe later in production
cycle



Outbound byproducts: e.g., salt water

12
Drilling Related Truck Movements per Well
Input or Byproduct
Water (Fresh)
Water (Waste): Out
Frac Tanks
Sand
Scoria/Gravel
Rig Equipment
Drilling Mud
Cement
Pipe
Other
13

Loaded Trucks
450
225
115
100
80
65
50
20
15
30

1,150
Loaded
Trucks

2,300
Loaded
and
Empty
Trucks
Current Mode Share Crude Oil
Gathering Movement

Movements from Wells to Transfer
Locations
27%

73%

14

North Dakota Pipeline Authority

Truck
Pipeline
Crude Oil Mode Shares: Line Haul




Currently 69% rail
Near-term projection: 90% rail
Reasons for rail dominance





15

Limited pipeline capacity (sized to historical
production)
Challenges/length of time in siting and
constructing new pipelines
Greater ease in capacity expansion of railroads
Lower cost of rail expansion
Rail access to a wider variety of markets →
premium prices
North Dakota Crude Oil Pipelines

16

North Dakota Pipeline Authority – Feb., 2013
System Capacities (Input not Throughput)
1600

Pipeline
forecast
uncertain

Thousand Barrels per Day

1400
1200
1000
800

Pipeline

600

Rail

400
200
0
2006

17

2008

2010

2012

North Dakota Pipeline Authority

2014

2016
Rail Movements







Shipments in multicar units or trainloads (e.g., 100+ cars)
Current share in ND ≈ 1,000 railcars per day
Equivalent to ten 100-car trains/day
If railroads maintain 70%+ share, could have 16-20
trainloads per day of crude oil at peak

Questions/potential issues

 Line capacity: other goods  Tankcar standards
 Transload capacity

 Accident exposure (train-miles)

 Service levels and priorities  Grade crossings
 Classification/placarding
18

 Risk assessment/routing
Hazmat Concerns




Bakken light crude: volatility and precise
chemical composition
Disposal of saltwater fracing mix
Reduction in flaring: leads to more natural gas
processing (LNG of CNG transport)


Fractionation: (NGLs)





Ethane (C2), Propane (C3), and Butane (C4)

Grade crossings: increasing truck and train traffic
at traditional low-volume crossings
Emergency preparedness and response


19

Pipeline spills
Train and truck movements through cities
ND Transportation Safety Advisory
Committee
Members









ND Highway Patrol
NDDOT
ND Emergency
Services
FHWA Division
FMCSA Division
FRA Division
 Chief Inspector
 Grade crossing
PHMSA Region
20

Missions







Gather input
Fact finding
Promote safety
Develop research and
technical assistance
work plan for
MPC/UGPTI
Leverage industry
resources

Traffic Growth and Transportation Safety in the Bakken Oil Producing Region

  • 1.
    Traffic Growth and TransportationSafety in the Bakken Oil Producing Region Denver Tolliver Upper Great Plains Transportation Institute North Dakota State University 1
  • 2.
    Introduction  Director: Upper GreatPlains Transportation Institute (UGPTI), North Dakota State University  Director: Mountain-Plains Consortium (MPC), Region 8 University Transportation Center (NDSU)  Consortium member: Small Urban & Rural Livability UTC (Montana State U.); NTI • UGPTI’s Lakewood CO center develops/updates FMCSA software: (1) inspection apps: e.g., Aspen, ISS, QC; (2) investigative apps: e.g. , CAPRI, CDLIS Access, UFA, CaseRite 2
  • 3.
    10,000-12,000 feet beneathsurface Shale Oil Formations in North Dakota 3 • Tight rock formation • Hydraulic fracturing • Horizontal drilling North Dakota Oil and Gas Division
  • 4.
    Horizontal versus VerticalWells 8-12 horizontal wells per 1,280 acre spacing unit Vertical Well 4 Horizontal Well
  • 5.
    Production Trends andPotential ND is producing roughly 1 million barrels of oil per day (BOPD) Production may increase to 1.6 million BOPD Dept. of Mineral Resources projects 10-14 billion barrels of technically recoverable reserves Industry projections (e.g., Continental Resources) are much higher—e.g., 20+ billion barrels Continental Resources estimates in-place oil reserves of 900 billion barrels 60,000 new wells will be drilled over next 20-30 years See following production charts        5
  • 6.
    Annual Oil Production:North Dakota 300 Million barrels 250 200 150 100 50 0 1950 6 1960 1970 1980 1990 2000 2010 North Dakota is second leading state in oil production
  • 7.
    Number of OilWells: North Dakota 90 80 Hundreds of Wells 70 60 50 40 30 20 10 1990 7 1995 2000 2005 2010 Currently: 10,000+ producing wells 2015
  • 8.
    Critical Highway TransportationIssues       8 Unprecedented heavy truck traffic levels on twolane rural roads 1st slide following: shows truck ADT projections on oil routes vs. traditional farm-to-market roads Percent trucks 40% to 50% in many cases Highways deteriorate quickly under heavy loads; insufficient roadway widths result in narrow shoulders Truck severe injury crashes in oil region increased by 1200% from 2008 to 2012, vs. 147% increase for remainder of the state over the same period See trend (2nd slide following) and map of crashes (3rd slide following)
  • 9.
    Avg. Projected TruckADT on County Roads for Three Heavily Impacted Oil Counties (with Control Case) 9 Slope County (not impacted by oil production) illustrates traditional truck traffic levels
  • 10.
    Motor Carrier Crashesin North Dakota
  • 11.
  • 12.
    Materials and ProductFlows  Inputs (e.g., sand, water, chemicals) move to well site for hydraulic fracturing and production  Specialized equipment (drilling and workover rigs) move to and from well site  1st slide following shows 2,300 drilling-related truck trips per well  Outbound crude initially moves by truck to pipeline or rail transfer location (2nd slide following); may shift to small diameter pipe later in production cycle  Outbound byproducts: e.g., salt water 12
  • 13.
    Drilling Related TruckMovements per Well Input or Byproduct Water (Fresh) Water (Waste): Out Frac Tanks Sand Scoria/Gravel Rig Equipment Drilling Mud Cement Pipe Other 13 Loaded Trucks 450 225 115 100 80 65 50 20 15 30 1,150 Loaded Trucks 2,300 Loaded and Empty Trucks
  • 14.
    Current Mode ShareCrude Oil Gathering Movement Movements from Wells to Transfer Locations 27% 73% 14 North Dakota Pipeline Authority Truck Pipeline
  • 15.
    Crude Oil ModeShares: Line Haul    Currently 69% rail Near-term projection: 90% rail Reasons for rail dominance      15 Limited pipeline capacity (sized to historical production) Challenges/length of time in siting and constructing new pipelines Greater ease in capacity expansion of railroads Lower cost of rail expansion Rail access to a wider variety of markets → premium prices
  • 16.
    North Dakota CrudeOil Pipelines 16 North Dakota Pipeline Authority – Feb., 2013
  • 17.
    System Capacities (Inputnot Throughput) 1600 Pipeline forecast uncertain Thousand Barrels per Day 1400 1200 1000 800 Pipeline 600 Rail 400 200 0 2006 17 2008 2010 2012 North Dakota Pipeline Authority 2014 2016
  • 18.
    Rail Movements      Shipments inmulticar units or trainloads (e.g., 100+ cars) Current share in ND ≈ 1,000 railcars per day Equivalent to ten 100-car trains/day If railroads maintain 70%+ share, could have 16-20 trainloads per day of crude oil at peak Questions/potential issues  Line capacity: other goods  Tankcar standards  Transload capacity  Accident exposure (train-miles)  Service levels and priorities  Grade crossings  Classification/placarding 18  Risk assessment/routing
  • 19.
    Hazmat Concerns    Bakken lightcrude: volatility and precise chemical composition Disposal of saltwater fracing mix Reduction in flaring: leads to more natural gas processing (LNG of CNG transport)  Fractionation: (NGLs)    Ethane (C2), Propane (C3), and Butane (C4) Grade crossings: increasing truck and train traffic at traditional low-volume crossings Emergency preparedness and response   19 Pipeline spills Train and truck movements through cities
  • 20.
    ND Transportation SafetyAdvisory Committee Members        ND Highway Patrol NDDOT ND Emergency Services FHWA Division FMCSA Division FRA Division  Chief Inspector  Grade crossing PHMSA Region 20 Missions      Gather input Fact finding Promote safety Develop research and technical assistance work plan for MPC/UGPTI Leverage industry resources