Finlight Research - Market Perspectives - Nov 2016
JDMR Overview 02-02-09
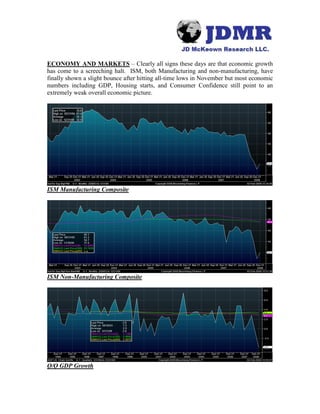
1. ECONOMY AND MARKETS – Clearly all signs these days are that economic growth
has come to a screeching halt. ISM, both Manufacturing and non-manufacturing, have
finally shown a slight bounce after hitting all-time lows in November but most economic
numbers including GDP, Housing starts, and Consumer Confidence still point to an
extremely weak overall economic picture.
ISM Manufacturing Composite
ISM Non-Manufacturing Composite
Q/Q GDP Growth
2. GDP growth collapsed in 4Q, falling 3.8% over 3Q. At this time last year, I argued that
whether we were in a recession, heading for recession, or on track to brush with
recession, the trend was clearly for slower economic growth and higher unemployment. I
predicted that this would no doubt lead to lower eps estimates and multiple contraction
which of course leads to lower stock prices. Now I make the argument that “worst case”
or at least a “really bad case” scenario is being assumed and stocks may have priced in
that assumption.
Fear and uncertainty are still relatively high. The VIX at the moment is registering in the
high 40’s after touching 90 just a few months ago. A far cry for the complacent readings
below 20 we saw around this time last year. Although it spiked again recently, it should
continue to fall back below its 200 day MA (approximately 36).
One Year VIX Chart
At the moment, we have a better grasp on things than we did just a few months ago.
Although things could no doubt get worse, it seems that some fear and uncertainty have
abated. Most likely, going forward, for better or worse, the resolution of many issues that
have plagued the market will begin to take shape. I acknowledge that things may get
worse before they get better but as the cloud of uncertainty lifts, we should have a better
idea of which direction we are headed, along with what actions the Fed, Treasury, and
new President, may have to take and the fear will further dissipate. Lower fear translates
to higher stock prices and as we have seen since late November, stocks have trended
higher.
COMMODITIES – All commodity futures curves are clearly in contango in both the
medium and long-term at the moment.
4. Corn futures thru 2012
The carry trade is now alive and well, once again leading suppliers to build inventories.
The replenishing of inventories will result in more demand in the short-term. For
example, refineries began to sell-off inventories when prices were at sky-high levels.
Now they look to replenish them at lower levels. They will continue to build until the
spot price plus the cost of carry approaches future prices. We will most likely see the
return of inflation concerns in the coming months. Likewise, Energy and Commodity
stocks should be one of the earliest sectors to recover.
POLITICS – For better or for worse, the political cloud of uncertainty that hung over the
markets in 2008 has at least been lifted. We now know who our President is and how he
might approach things going forward based on his recent action. Since the election,
Obama has continued to preach doom and gloom. Although it may be having a negative
impact on Consumer Confidence, he continues to put pressure on Congress, the Fed, the
Treasury, etc. to take emergency action through multiple stimulus plans.
In my opinion, Obama seems to be watching the markets with one eye somewhat
concerned about how his actions are received. Combined with the financial bailout and
an easing Fed, the likelihood of a deep recession or depression seems unlikely at this
point. We should see credit spreads come in as uncertainty and fear abates. Libor has
fallen to about 1.25% from close to 5% where it was for the mid-Oct meltdown.
5. LIBOR 1 year Chart
Again, how the Obama administration acts in the first few months may or may not be
exactly what the market wants to hear. However, the Obama has been quite visible and
vocal with pro-market and pro-stimulus comments that should go along way to reducing
fear and uncertainty which will eventually lead to a return to fundamentals.
Baltic Dry Index
The un-freezing of the credit markets have helped shipping rates recover a bit. The Baltic
Dry Index fell 94% in the late-summer and Fall 2008 before its recent recovery. It has
risen from a low of 663 on 12/4/08 to its current reading of 1070 or roughly 61%
STOCKS – As I mentioned, there has been a disconnect from market fundamentals for
the last few months. Valuations are meaningless in a world where panic and fear rule the
day. Think about it, what good is a PE ratio when the E is rapidly falling and could be
negative for several quarters? Last year at this time, GS traded at $220 or slightly below
10x the forward eps estimate of approximately $23. The argument was made by several
analysts that the stock was “cheap” because historically it trades in a PE range from 8-
15x next years’ eps. By mid-August, estimates were sliced to about $15.50 and yet the
6. PE was still about 10. It fell to 47 before its recent bounce! The 2009 estimate is about
$10.90 meaning the stock now trades at about 7x next years (2009) eps estimate. Is it
now “super cheap” or is there another 70% downside from here? Is it a buy or sell? Is
next years eps estimate even remotely reliable (especially when we don’t know how large
the “one-time” right-offs could be)?
The truth is… top-down and technical analysis are much more important at the
moment than traditional fundamental analysis. Anyone that understood the impact
that a credit crisis could have on a firm like GS that’s leveraged many, many times its
shareholders equity would have realized that eps would be much lower in 2008 most
likely. Hindsight is 20/20 of course but my point is that most traders have little or no
faith in valuations and fundamentals at the moment.
My view is that most traders are in “show me” mode. They want to see an upturn before
they call a bottom. We’ve had several upturns and re-tests over the past few months and
at the moment we have had a sharp sell-off.
Typically, a close above the 200 day MA would represent a “show me” signal. In fact, if
we do bounce from here we could get back to the 200 day MA in a hurry. In 1990 (a
comparable time-period in many ways), the S&P 500 peaked and then broke through the
200 day MA in mid-July. It continued downward before bottoming in mid-Oct. It then
raced up over 15% to touch its 200 day by the first week in Dec.
1990 Bear Market
In July 1998 (in the wake of the LT Capital meltdown), the market again peaked before
declining 22% and bottoming in early Oct. Then in just 10 trading days, it recovered
over 15% before hitting its 200 day MA.
7. 1998 Bear Market
Finally, in the most recent Bear market case, back in 2000, the S&P broke below its 200
day MA in Sept and fell 35% before bottoming a few days after Sept 11 2001, more than
1 year later. Then, by the first week in Dec, it again shot up close to 25% to touch its
moving average.
2000 – 2001 Bear Market
At current levels (01/30 close of 825 on the S&P 500) a move to 200 day MA (1250)
would represent a gain of over 35%. The question of course is do you wait for a 35%
move before taking action or is the potential move worth the risk, even if we haven’t put
in a bottom yet?
8. Current Bear Market
CONCLUSION - In the short-term, there are numerous indicators pointing toward the
formation of a bull rally. Liquidity provided to the markets through fiscal and monetary
stimulus will go a long way to quell fear amongst traders. Lower fear, as measured by
the VIX, correlates well with higher stock prices. Uncertainty revolving around political
events will no doubt be closer to resolution in the coming weeks which again lowers fear
levels. Heightened awareness to the economic and financial crisis’ by Obama, Congress,
and Fed officials will most likely lead to fiscal and monetary stimulus policies that will
help us avoid a 1930’s style depression. Taking that into consideration, I also look at my
favorite short-term indicator, which is sentiment. Most Bull/Bear surveys are close to 2
to 1, Bears vs. Bulls. Ned Davis Research reports a 39% Bulls in its latest sentiment
survey. This is up slightly from a 32% reading near the Oct 9 lows which was below the
35% reading at the 2002 low. Other contrarian indicators such as Demark and
Advance/Decline line (see separate note) also suggest a short-term over-sold condition.
Medium-term, the market should return to fundamentals. At that time valuation and
other traditional metrics will be more useful and give us a better sense of direction. Last
year at this time, Wall Street’s estimates for 2008 eps on the S&P 500 still looked for
close to double digit growth. Most estimates were in the $80-82 range. Using the 2007
year-end closing price, the forward PE was about 18. Now estimates have come down to
reflect a more realistic 4-5% growth rate. Assuming flat growth over this years estimate
gives us an estimate of $75.50 for 2009, suggesting a forward PE under 11. (Current
consensus estimates of $85 would give us a PE of about 9.5 but I think estimates need to
come down from 12-13% growth to low single digits at best.) A PE of 11 represents the
lower end of the historical range suggesting at current levels a argument for a “cheap”
market can be made. A return to fundamentals will most likely result in a continued
rally.
Long-term (3-6 months out) the crystal ball is still foggy. The flood of liquidity being
dumped on the market will no doubt be inflationary. We should see energy and food
prices begin to rise again and further squeeze the consumer. The dollar should again
retreat unless the Fed takes a hawkish stance and sharply raises rates at the first signs of
9. recovery, which is unlikely in my opinion. It took a while to break the US consumer, but
a taste of sky-high energy prices, the shutting down of the home ATM, and the very real
threat of job losses has finally scared them silly. Consumer confidence will take a while
to recover. I would expect to see further decline in consumer spending in 2009. It will
be a long and painful recovery for most retail names. I’ll go into more detail in my next
report where I’ll go over each individual sector and suggest several trade ideas to position
for the coming weeks and months.
-Jeff McKeown