Download to read offline


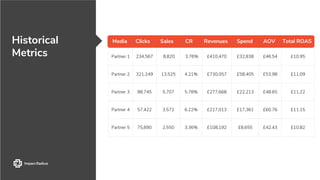
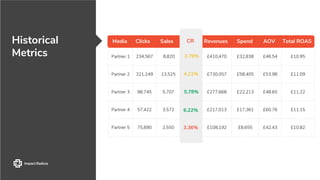
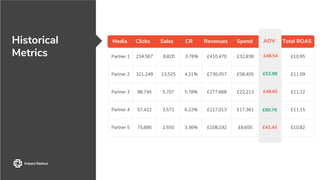
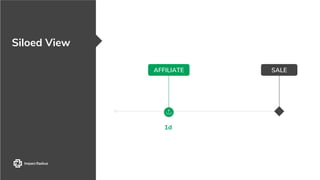
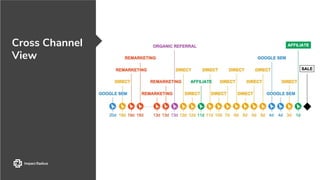

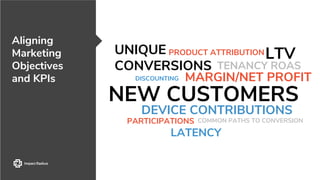
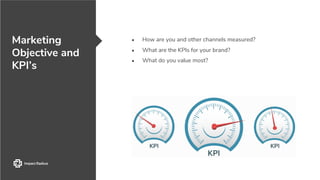
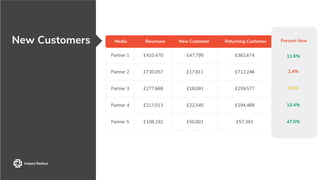
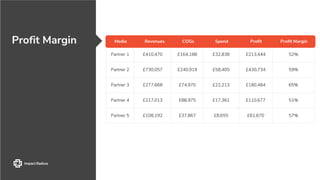
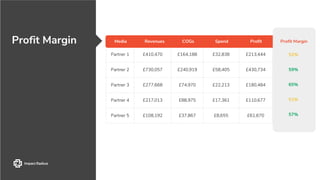
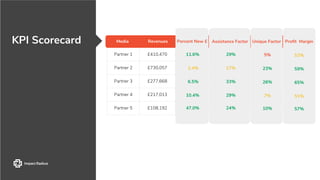
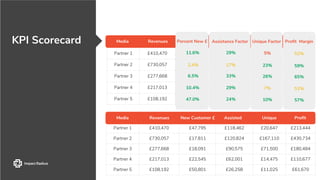


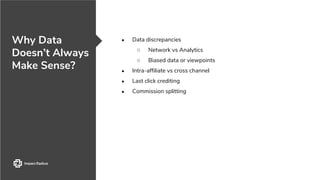

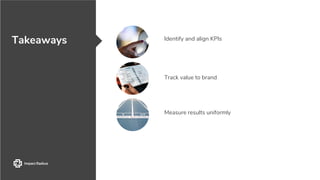
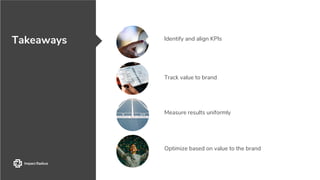


The document presents insights on advanced metrics and KPIs for performance marketing, discussing the necessity to move beyond traditional metrics to achieve a more holistic view. Key topics include the challenges of data discrepancies, the importance of aligning marketing objectives, and the need for uniform measurement of results. The content is aimed at helping marketers identify valuable contributions to brand performance and improve decision-making processes.


![[EN].CleverGroup Vietnam Profile 20251202](https://cdn.slidesharecdn.com/ss_thumbnails/en-260120091417-fe6f88ec-thumbnail.jpg?width=640&height=640&fit=bounds)


![[rokonz.com] Glossary of Semantic SEO Part-1.pdf](https://cdn.slidesharecdn.com/ss_thumbnails/rokonz-260123200456-440e4060-thumbnail.jpg?width=640&height=640&fit=bounds)

