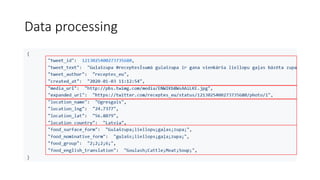
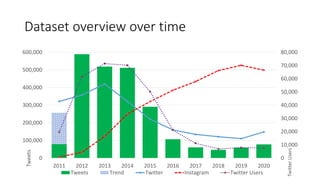
- This document summarizes a project that analyzes over 2.4 million Latvian language tweets related to food and eating collected since 2011.
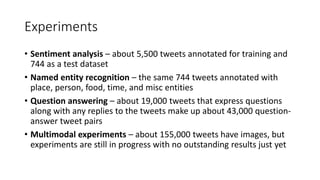
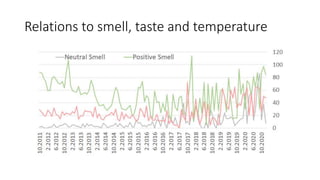
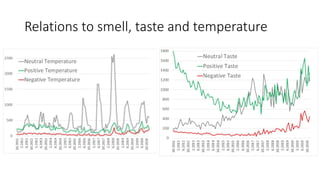
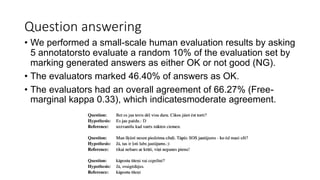
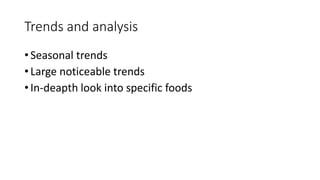
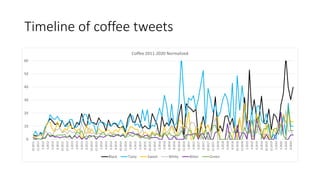
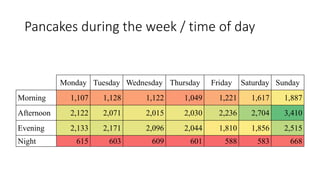
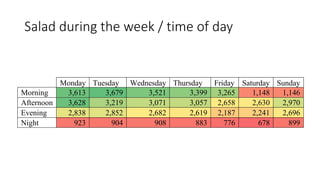
- The tweets have been annotated for sentiment, named entities, and question-answer pairs and analyzed to identify trends, seasonal patterns for foods, and relationships between foods and senses of smell, taste, and temperature.
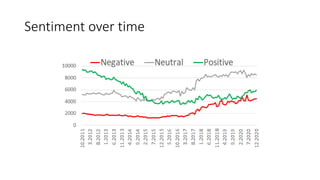
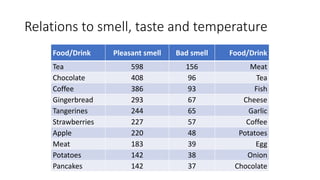
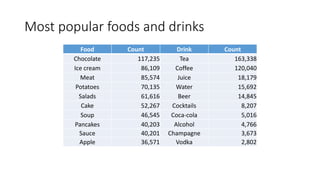
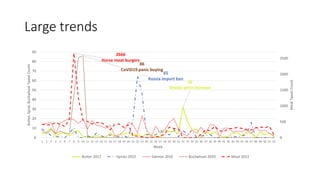
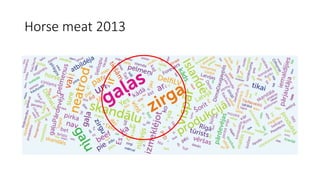
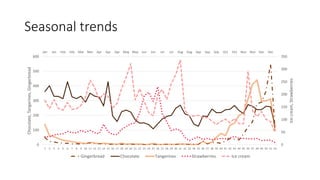
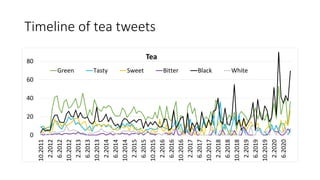
- Key findings include identifying popular foods and drinks mentioned over time, seasonal patterns for foods like chocolate and berries, and changing sentiment toward foods like meat detected on Twitter. Publications and code related to the project are available on GitHub.