Download as PDF, PPTX
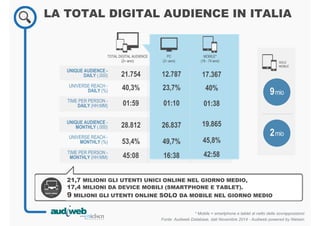
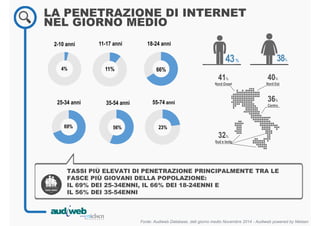
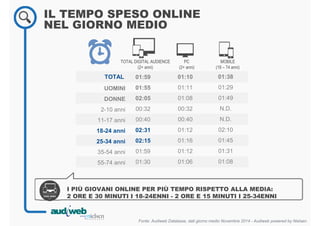

Nel novembre 2014, la total digital audience in Italia ha raggiunto 21,7 milioni di utenti unici online, con 17,4 milioni che si collegano tramite dispositivi mobili. Gli utenti più giovani, in particolare tra i 18 e i 34 anni, trascorrono significativamente più tempo online rispetto alla media. La penetrazione di Internet varia a livello regionale, con il Nord-Est e il Nord-Ovest che mostrano i tassi più elevati.


