Download as PDF, PPTX


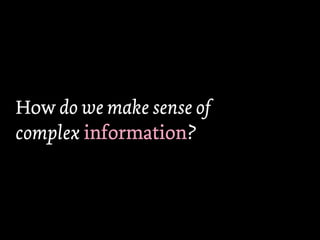
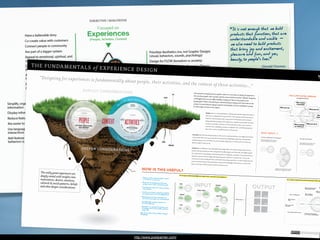
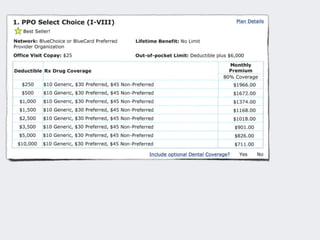
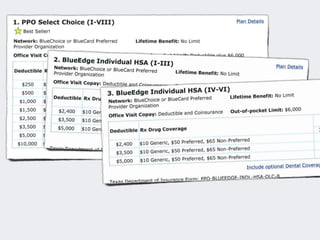
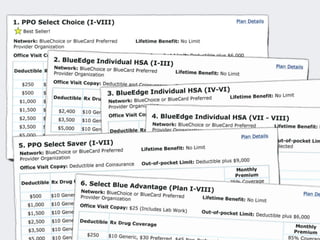
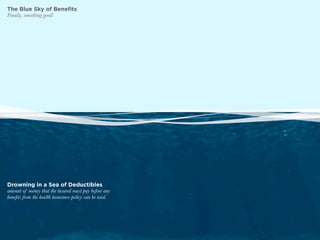

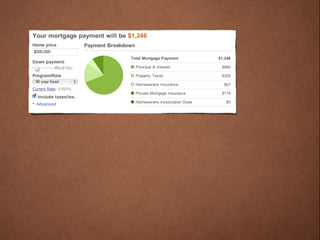
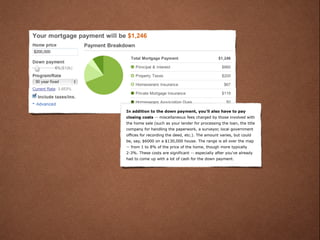
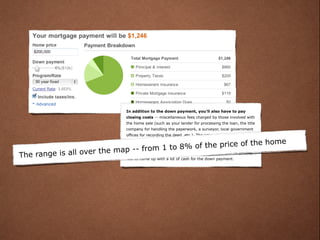
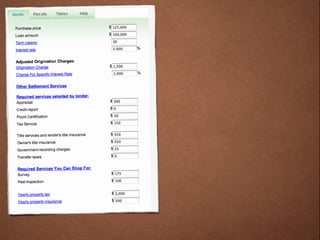
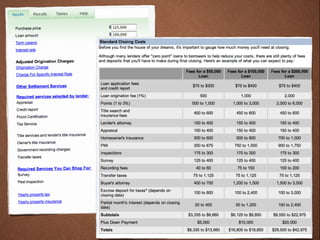


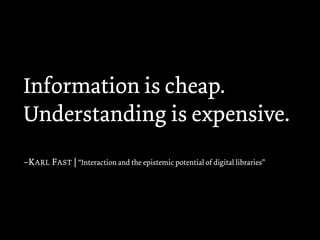
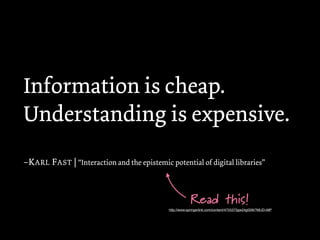

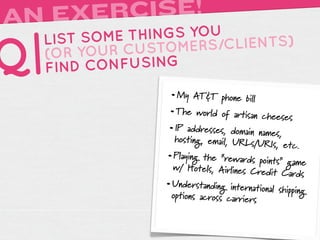
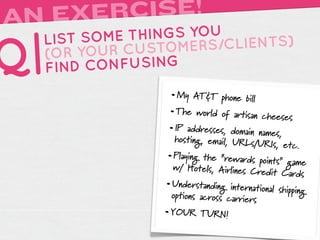
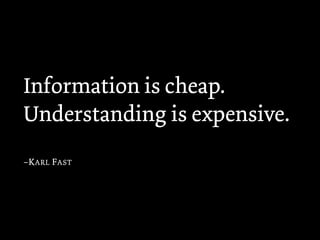
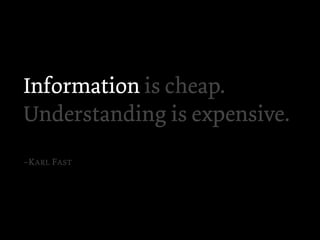


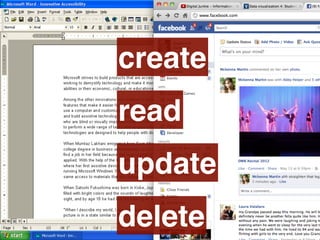
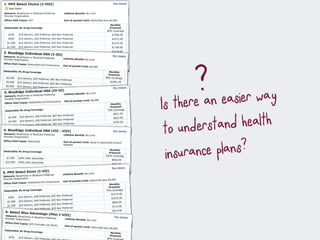

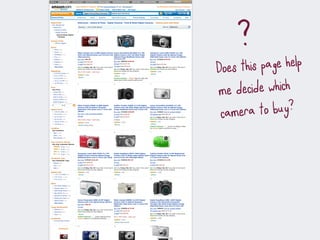


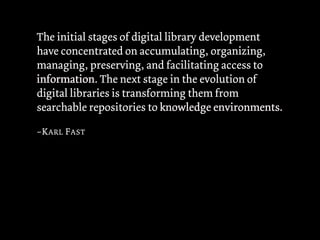
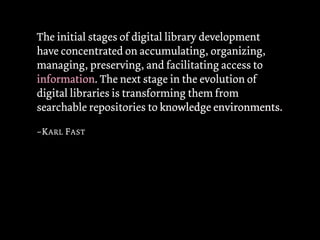
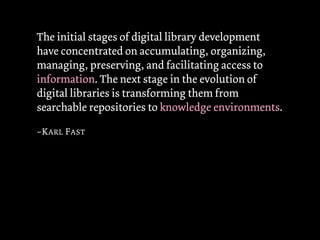
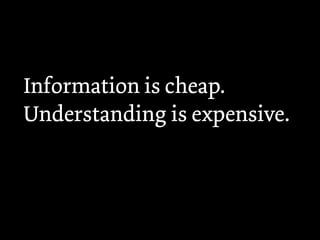
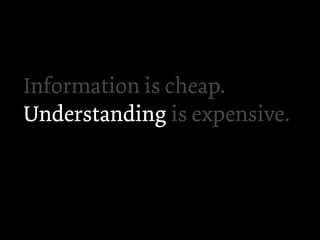


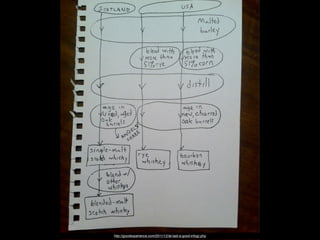
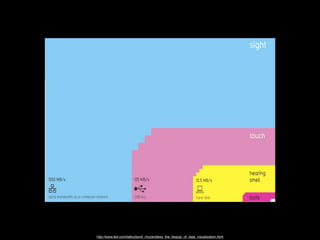


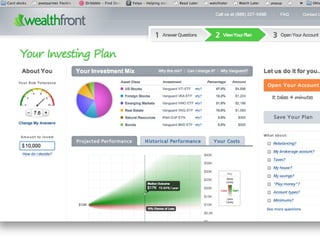
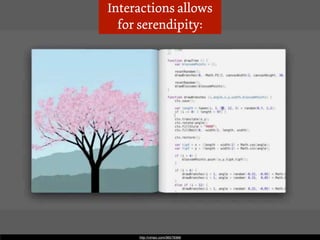

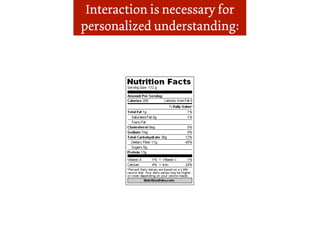
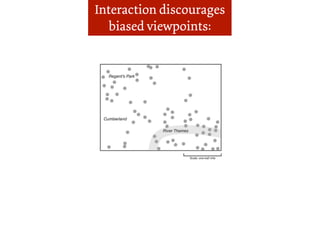


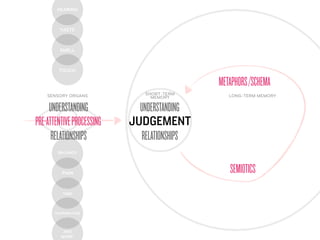
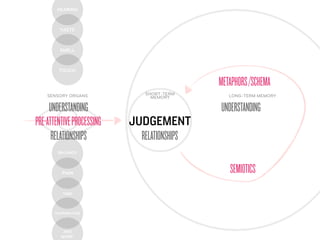


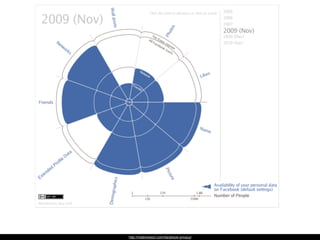
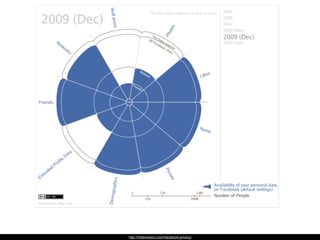
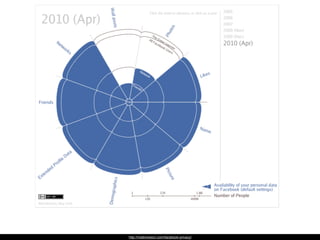


The document discusses strategies for transforming complex information into understanding through user experience design, focusing on improving customer interactions with brands. It highlights the challenges of making sense of health insurance plans, the need for better data visualization, and the role of personal experiences in shaping understanding. It emphasizes the importance of critical interaction and the evolution of digital libraries as knowledge environments rather than mere repositories of information.