This document contains 23 multiple choice questions about cost-volume-profit (CVP) analysis concepts such as break-even point, contribution margin, fixed and variable costs, operating leverage, and margin of safety. It tests understanding of how to calculate break-even point in units and dollars, the relationship between costs and volume, and assumptions of CVP analysis like constant prices and sales mix.
![348
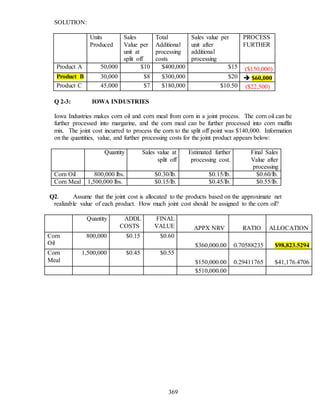
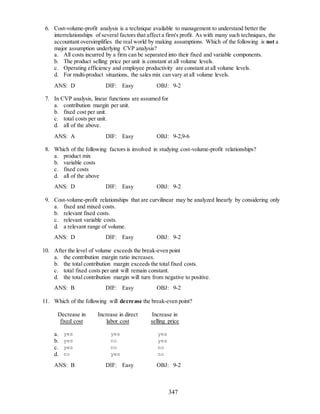
12. At the break-even point, fixed costs are always
a. less than the contribution margin.
b. equal to the contribution margin.
c. more than the contribution margin.
d. more than the variable cost.
ANS: B DIF: Easy OBJ: 9-2
13. The method of cost accounting that lends itself to break-even analysis is
a. variable.
b. standard.
c. absolute.
d. absorption.
ANS: A DIF: Easy OBJ: 9-2
14. Given the following notation, what is the break-even sales level in units?
SP = selling price per unit, FC = total fixed cost, VC = variable cost per unit
a. SP/(FC/VC)
b. FC/(VC/SP)
c. VC/(SP - FC)
d. FC/(SP - VC)
ANS: D DIF: Easy OBJ: 9-2
15. Consider the equation X = Sales - [(CM/Sales) (Sales)]. What is X?
a. net income
b. fixed costs
c. contribution margin
d. variable costs
ANS: D DIF: Moderate OBJ: 9-2
16. If a firm's net income does not change as its volume changes, the firm('s)
a. must be in the service industry.
b. must have no fixed costs.
c. sales price must equal $0.
d. sales price must equal its variable costs.
ANS: D DIF: Moderate OBJ: 9-2
17. Break-even analysis assumes over the relevant range that
a. total variable costs are linear.
b. fixed costs per unit are constant.
c. total variable costs are nonlinear.
d. total revenue is nonlinear.
ANS: A DIF: Easy OBJ: 9-2,9-6](https://image.slidesharecdn.com/tng-hp-trc-nghim-210702042752/85/T-ng-h-p-tr-c-nghi-m-6-320.jpg)
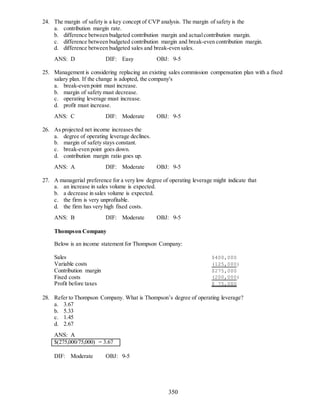
![368
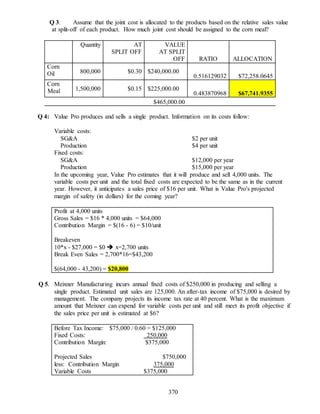
Fixed costs (200,000)
Profit $160,000
DIF: Moderate OBJ: 9-3
Castle Corporation
The following questions are based on the following data pertaining to two types of products
manufactured by Castle Corporation:
Per unit
Sales price Variable costs
Product Y $120 $ 70
Product Z $500 $200
Fixed costs total $300,000 annually. The expected mix in units is 60 percent for Product Y and 40
percent for Product Z.
10. Refer to Castle Corporation. How much is Castle’s break-even point sales in units?
ANS:
BEP units = FC/(unit SP - unit VC) or unit CM(UMC)
For multiple products, use the weighted CM with weights based on units of sales weights.
BEP = FC / [60% ($120 - $70) + 40% ($500 - $200)]
= $300,000/ ($30/u + $120/u) = 2,000 units
DIF: Moderate OBJ: 9-4
11. Refer to Castle Corporation. What is Castle’s break-even point in sales dollars?
ANS:
BEP dollars = FC/CMR
For multiple products, use weighted CMR with weights based on sales dollars as weights or sales mix.
Sales mix is 60 percent and 40 percent in units or in dollars.
Weighted average CMR = WACM/WASale
WACMR = [60% ($120 - $70) + 40% ($500 - $200)] ÷ (60% $120) + (40% $500)
WACMR = [$30 + $120] ÷ [$72 + $200] = .551
BEP sales = 2,000 $272 = $544,000
DIF: Moderate OBJ: 9-4
Q 1. Ritz Company makes three products from a joint input that have the following information:
Units
Produced
Sales Value per
unit at split off
Total Additional
processing costs
Sales value per unit after
additional processing
Product A 50,000 $10 $400,000 $15
Product B 30,000 $8 $300,000 $20
Product C 45,000 $7 $180,000 $10.50
The joint cost incurred to produce the three products to the split off point is $600,000. Which
products should be processed further?](https://image.slidesharecdn.com/tng-hp-trc-nghim-210702042752/85/T-ng-h-p-tr-c-nghi-m-26-320.jpg)