Download to read offline
![US 20l20l80059Al
(19) United States
(12) Patent Application Publication (10) Pub. No.: US 2012/0180059 A1
TRAVOSTINO et al. (43) Pub. Date: Jul. 12, 2012
(54) TIME-VALUE CURVES TO PROVIDE (60) Provisional application No. 60/721,757, ?led on Sep.
DYNAMIC QOS FOR TIME SENSITIVE FILE 29, 2005.
TRANSFERS
Publication Classi?cation
(75) Inventors: Franco TRAVOSTINO, Arlington, (51) Int. Cl.
MA (U S); Tal LAVIAN, Sunnyvale, G06F 9/50 (2006.01)
CA (US); Bruce SCHOFIELD, (52) us. Cl. ...................................................... .. 718/103
Tyngsboro, MA (U S); Inder
MONGA, Acton, MA (US) (57) ABSTRACT
_ A method and apparatus has been shoWn and described Which
(73) Asslgnee? ROCKSTAR BIDCO, LP, New alloWs Quality of Service to be controlled at a temporal
York: NY (Us) granularity. Time-value curves, generated for each task,
ensure that mission resources are utiliZed in a manner Which
(21) Appl. No.: 13/423,774 optimizes mission performance. It should be noted, hoWever,
that although the present invention has shoWn and described
(22) Filed; Man 19, 2012 the use of time-value curves as applied to mission Work?oW
tasks, the present invention is not limited to this application;
. . rather, it can be readily appreciated by one of skill in the art
Related U's' Apphcatlon Data that time-value curves may be used to optimize the delivery of
(63) Continuation of application No. 11/469,404, ?led on any resource I0 any Consumer by taking inIO aCCOunt the
Aug. 31, 2006, noW Pat. No. 8,146,090.
1
dynamic environment of the consumer and resource.
Command Center i
l
12 Goal to Scrvicc ->D1S°°V@Yy
_ Trnneln?nn llnit Ellglllt) and Q
. . Scheduler l0L MlSSlOll Resource
Manng r
- . Directory Execntton Constwnt
Engine 14 Analvzer E
n
it ‘ a
E_ . ll Trmlrr
£13m?" Execution 0 Poll“, Network Services Fedmm
” "mm" .' 4'Manaeo1tNSMl 1 -
Managct l_l:M) PM“? = »
7.2 v A 2,5
2K _ ll
Software Execution 0 Policy Network Services
Controlled ‘V ‘V Mmlagm'EM) Fngme i-lllanageMNSM] '
N?lmk Network 1 1E2 m m
Resource Manager Nelllttlk llelource &
. I, And Monitor, Software (MM) i
Controlled V ‘V
V ‘ I .‘t‘lVlUfls Network
"lrtualtzanonw Resource Manager Network Resource
_ c And Monitor
(NRM) Q ”
35 n l l E H.
, xrc'u on
L ‘LAN Federation llt'ntunlization 39
15 v v n
l, Him LAN LAN](https://image.slidesharecdn.com/us20120180059-141031122951-conversion-gate01/75/Time-value-curves-to-provide-dynamic-QoS-for-time-sensitive-file-transfers-1-2048.jpg)
![Patent Application Publication Jul. 12, 2012 Sheet 1 0f 14 US 2012/0180059 A1
1
Command Center 2
' t
17 Goal to Service _> DlSCOVeTY
— Tmrtolntinn Unit Ellgltl? and Q
. . Scheduler l0k Mrssron Resource
Manag r
. ‘ . Directory Executron Constrarnt
Engine 14 Analger M
]_
q r!
I _ Tender
ixsclttlon Execution 0 Policy Network SeWiCcS Federation 1
8 who” ManaoeMEM) E . (-ManageMNSM) ‘ ‘
U 22 ngmfi 26 l
2& l —| _ I
Software V Execmion 0 policy Network Servrces_
Controlled ‘V ‘V Manage?EM) Engine ‘Manage?NsMd
N L ' d 177 124 116 BlWUfli ~~ _ L,
Network Nt kR _ 2 M A
Resource Manager Azcmonitziome { SM —| ‘V
NRM 2s ’ 0 are -—~
(‘ ) _ Controlled " ‘V
d Network Network
VilmahmonZQ Resource Manager 1165mm
(NRM) E r 0111 or,
25 y t ‘ T990101” 127
L VLAN LAN Execution d 155mm] —
LAN Federation tirtnalizationm
25 u v u](https://image.slidesharecdn.com/us20120180059-141031122951-conversion-gate01/75/Time-value-curves-to-provide-dynamic-QoS-for-time-sensitive-file-transfers-2-2048.jpg)
![US 2012/0180059 A1
TIME-VALUE CURVES TO PROVIDE
DYNAMIC QOS FOR TIME SENSITIVE FILE
TRANSFERS
RELATED APPLICATIONS
[0001] This is a continuation patent application Which
claims priority to US. patent application Ser. No. 11/469,
404, ?led Aug. 31, 2006, entitled “TIME-VALUE CURVES
TO PROVIDE DYNAMIC QoS FOR TIME SENSITIVE
FILE TRANSFERS”, Which claims priority to US. Provi
sional PatentApplication No. 60/721,757 ?led Sep. 29, 2005,
the entirety of both of Which are incorporated herein by ref
erence.
STATEMENT REGARDING FEDERALLY
SPONSORED RESEARCH OR DEVELOPMENT
[0002] The US. Government has a paid-up license in the
invention and the right in limited circumstances to require the
patent oWner to license others on reasonable terms as pro
vided for by the terms of contact No. HR0011-05-0120
aWarded by DARPA/CMO.
FIELD OF THE INVENTION
[0003] This invention relates generally to resource manage
ment and more particularly to a method and apparatus for
generating and using time-value curves for resource manage
ment.
BACKGROUND OF THE INVENTION
[0004] The effectiveness of any mission is heavily reliant
upon the ability of an underlying infrastructure to respond to
the dynamic requirements of the mission. Typically missions
are layered upon an existing resource infrastructure such that
the mission becomes merely a set of tasks that is supported by
the infrastructure. Layering a mission upon an existing infra
structure typically mis-utiliZes key resources and increases
the dif?culty in detecting performance degradation or partial
failures that adversely affect the mission. Allocating speci?c
resources to a mission is technically challenging and error
prone. It Would be desirable to identify a mission architecture
Which Would overcome the problems of the prior art.
SUMMARY OF THE INVENTION
[0005] According to one aspect of the invention a method
of allocating a resource to a plurality of resource consumers
includes the step of generating a time-value curve de?ning a
temporally dynamic priority of a resource consumer over a
time period and using the time-value curve to allocate the
resource to the consumer over the time period. In one embodi
ment, the resource is communication bandWidth, and the
resource consumers include one or more tasks in a mission
Work?oW. Such an arrangement permits the scheduling, pre
empting and trade-off of bandWidth betWeen different mis
sion tasks to optimiZe deployment of mission tasks and con
comitantly optimiZe mission performance.
[0006] According to another aspect of the invention, a
method of allocating a resource to a plurality of resource
consumers includes the steps of generating a time value curve
for each one of a plurality of tasks in a Work?oW, the time
value curve de?ning a temporally dynamic quality of service
to be provided to the task.
Jul. 12, 2012
[0007] According to a further aspect of the invention, a
policy engine comprises generic task pro?le information and
time value curve generation logic operably coupled to receive
task speci?c information and to calculate a time-value curve
for the task using the generic task pro?le information and the
task speci?c information.
[0008] According to a further aspect of the invention, a
device comprising a computer readable medium accessible
by a resource allocator is described. The computer readable
medium stores a data structure comprising, for each one of a
plurality of enqueued tasks associated With the resource, a
time value curve de?ning a temporal priority to provide to the
associated task, the data structure being accessed by the
resource controller to control access to the resource. These
and other aspects of the invention Will be described With
regard to the attached ?gures.
BRIEF DESCRIPTION OF THE FIGURES
[0009] FIG. 1 is a block diagram of a mission architecture
in Which the present invention may be implemented;
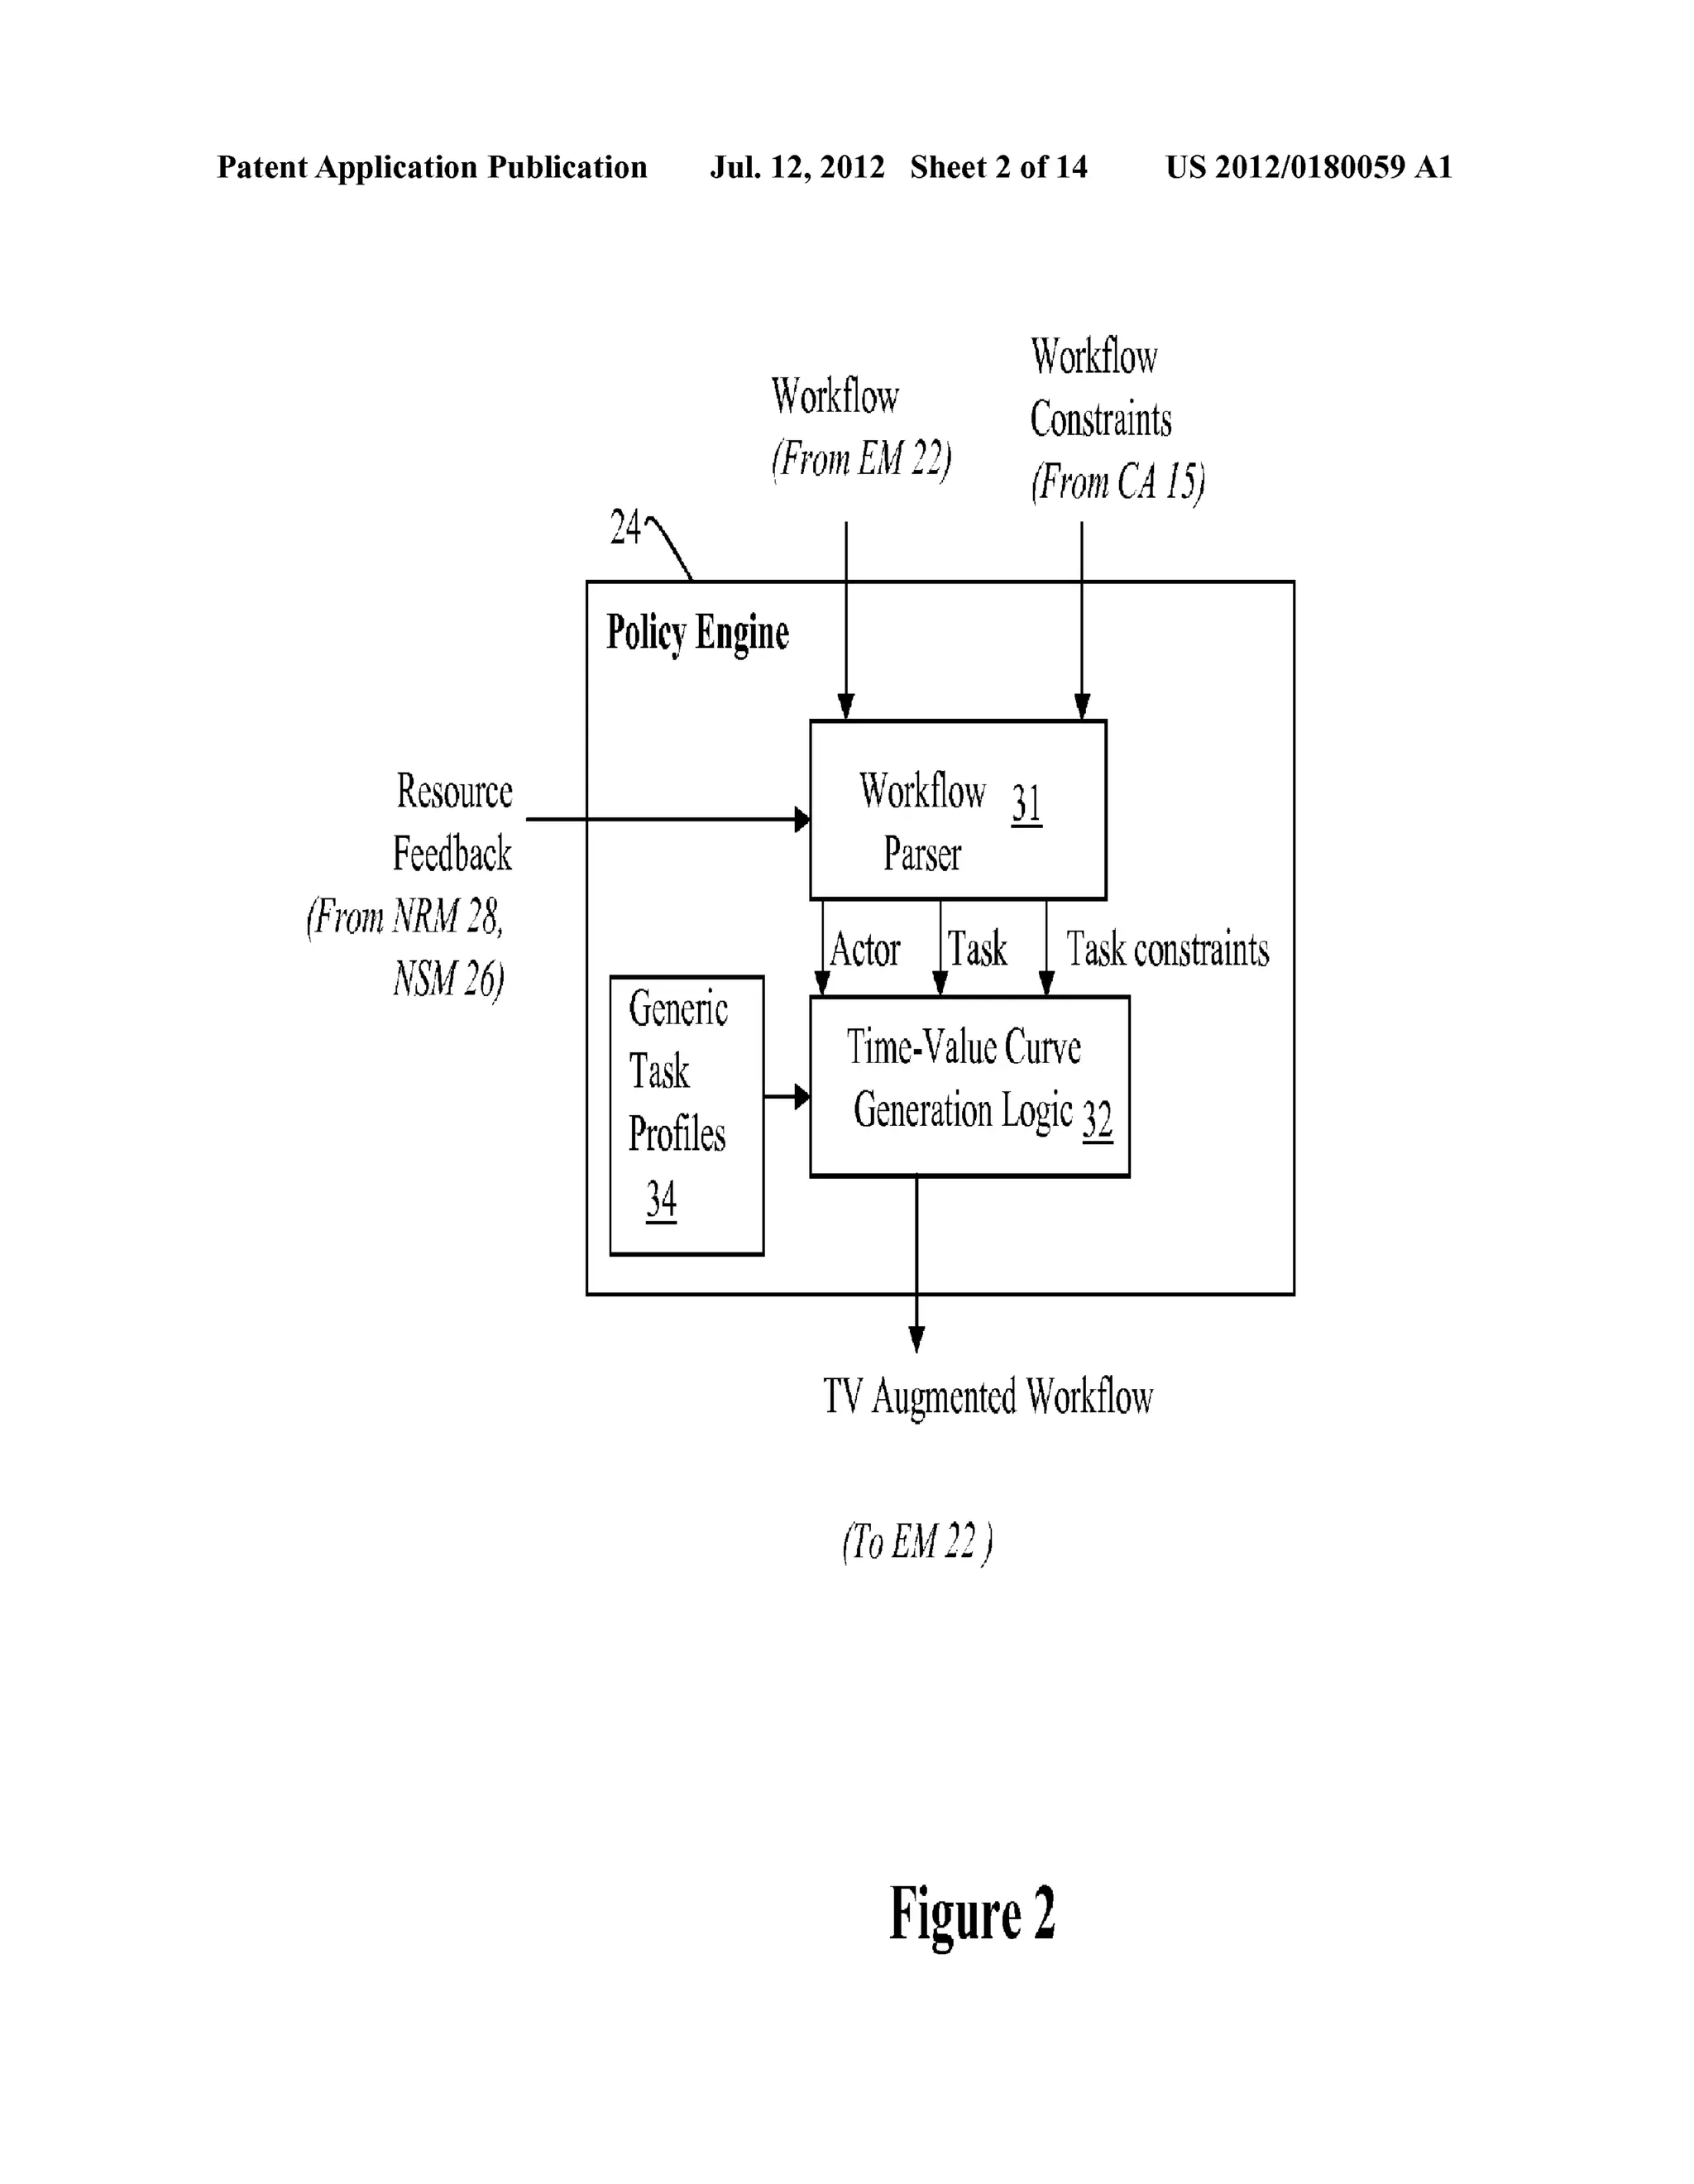
[0010] FIG. 2 is a block diagram illustrating several com
ponents that may be included in a policy engine to generate
time-value curves of the present invention;
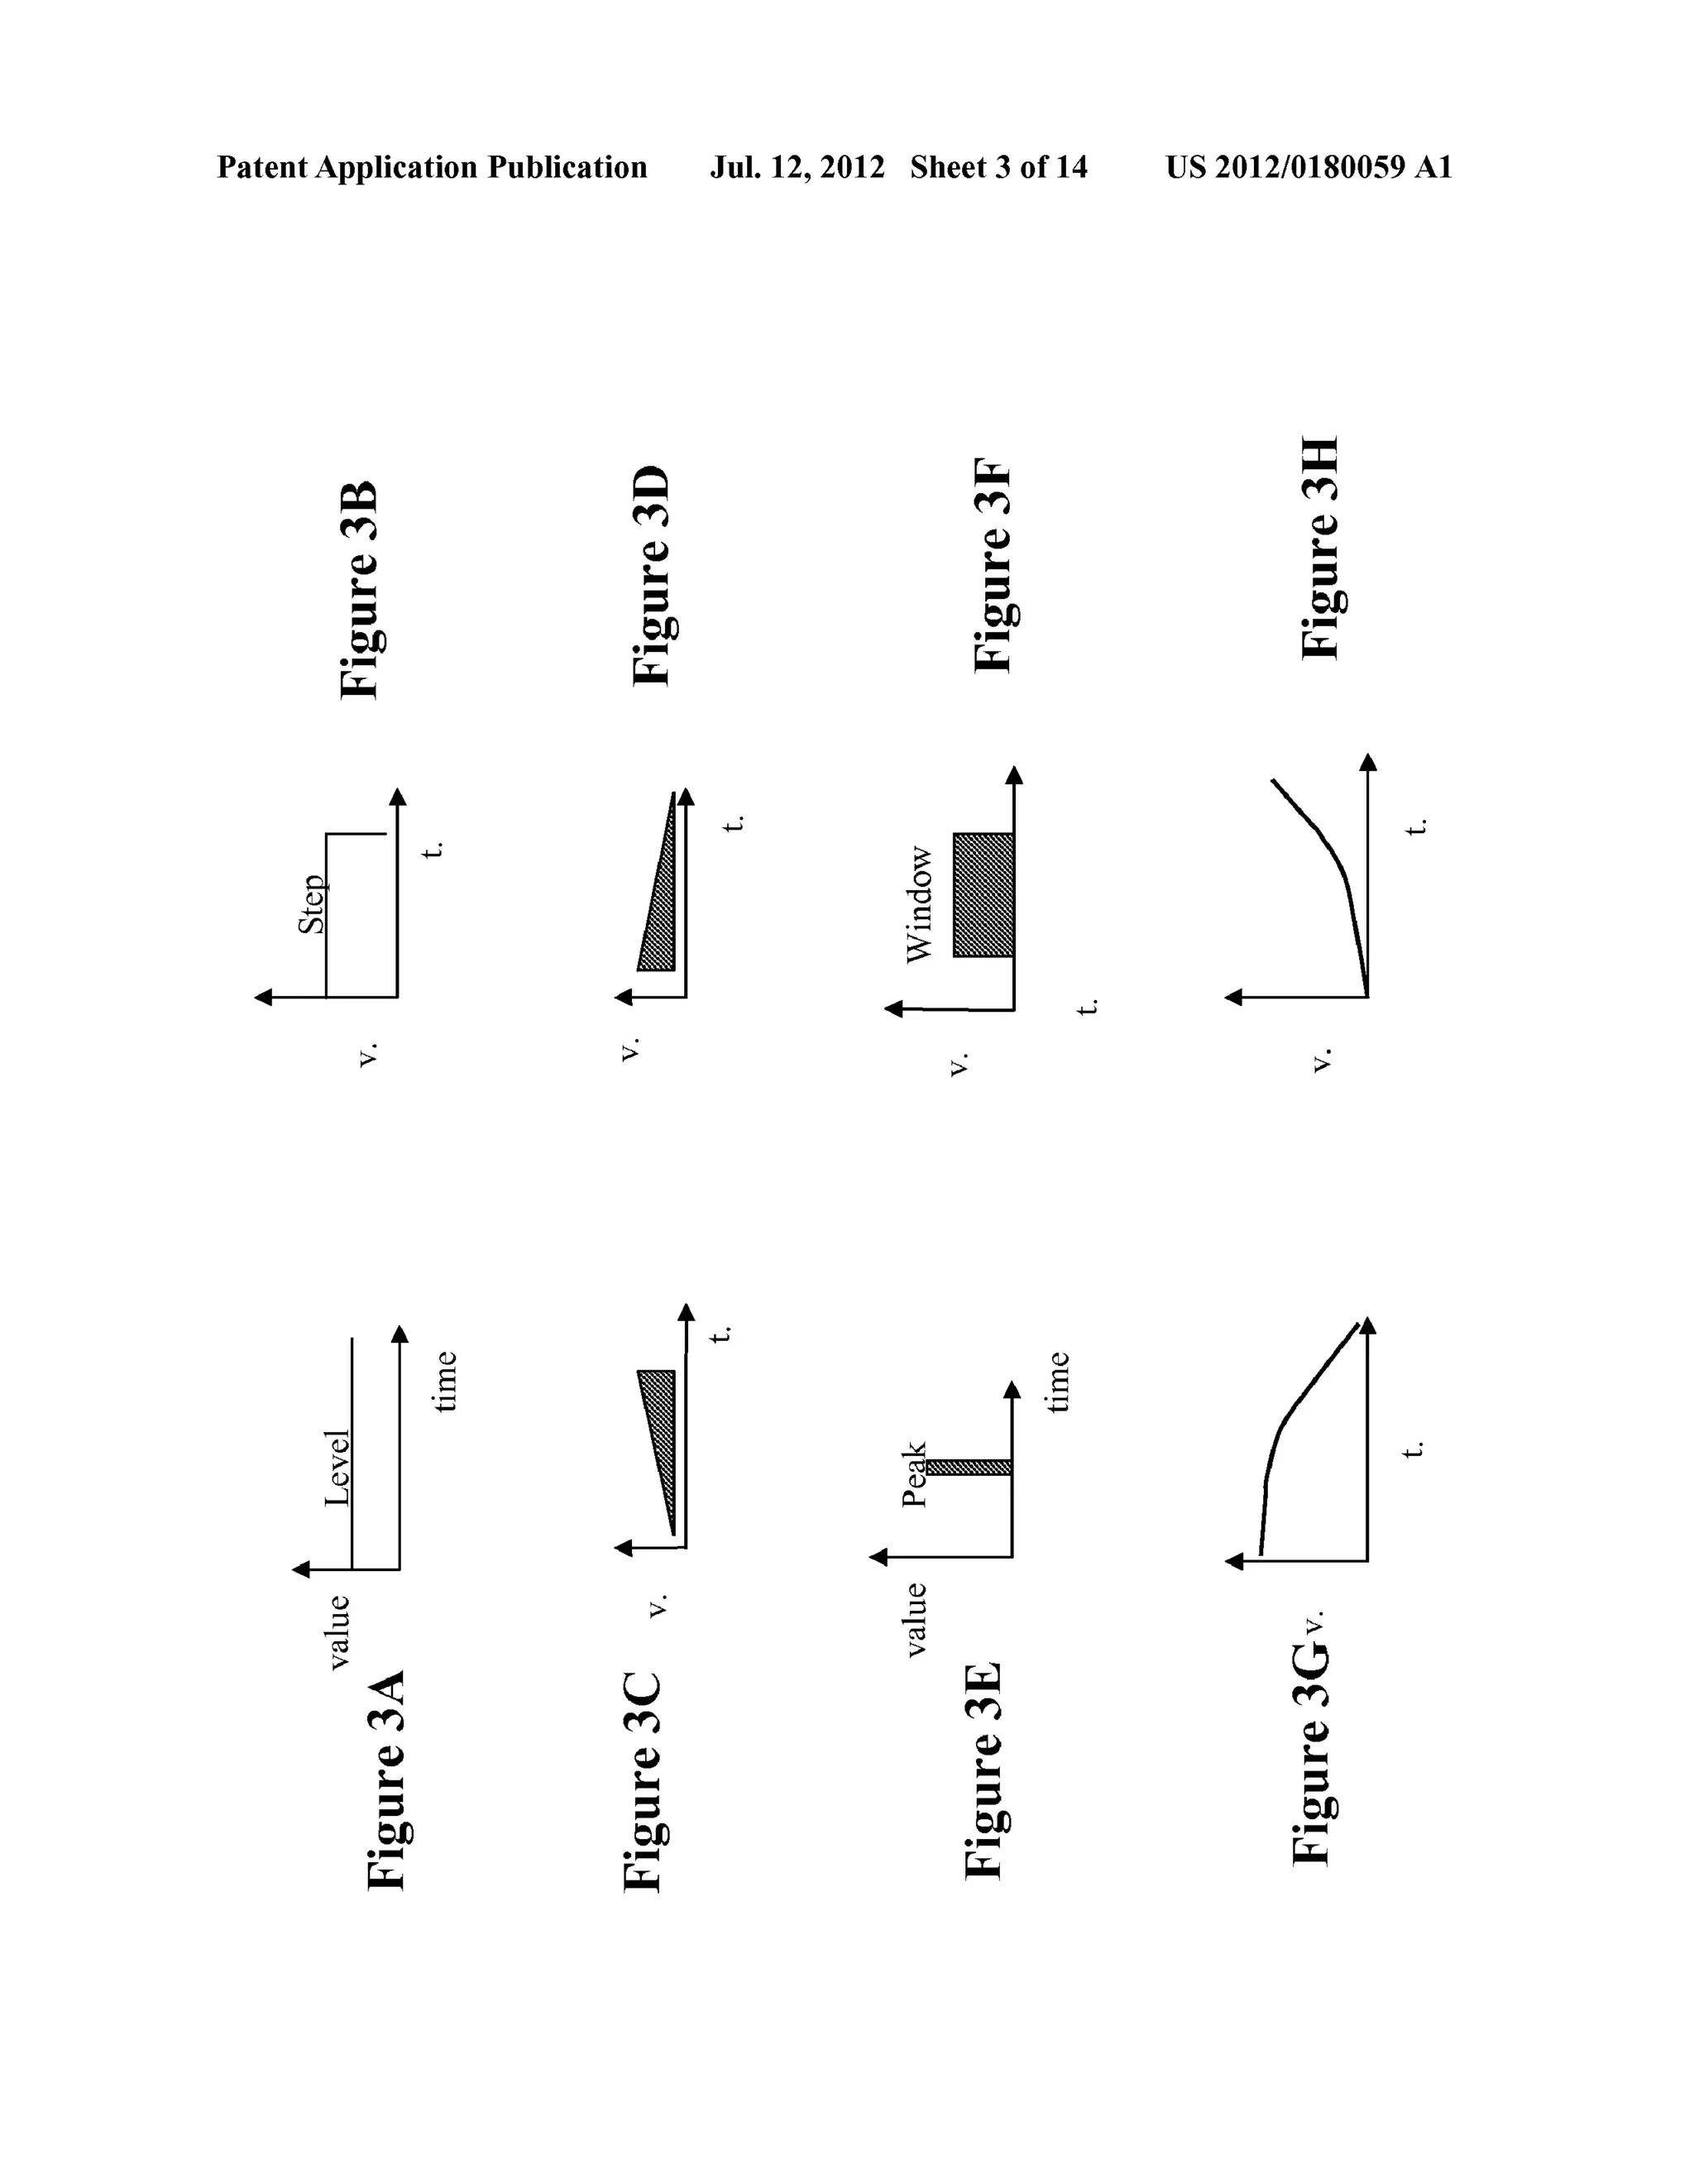
[0011] FIGS. 3A-3H are diagrams illustrating different
types of time-value curves that may used as a basis for time
curve generation by a policy engine of the present invention;
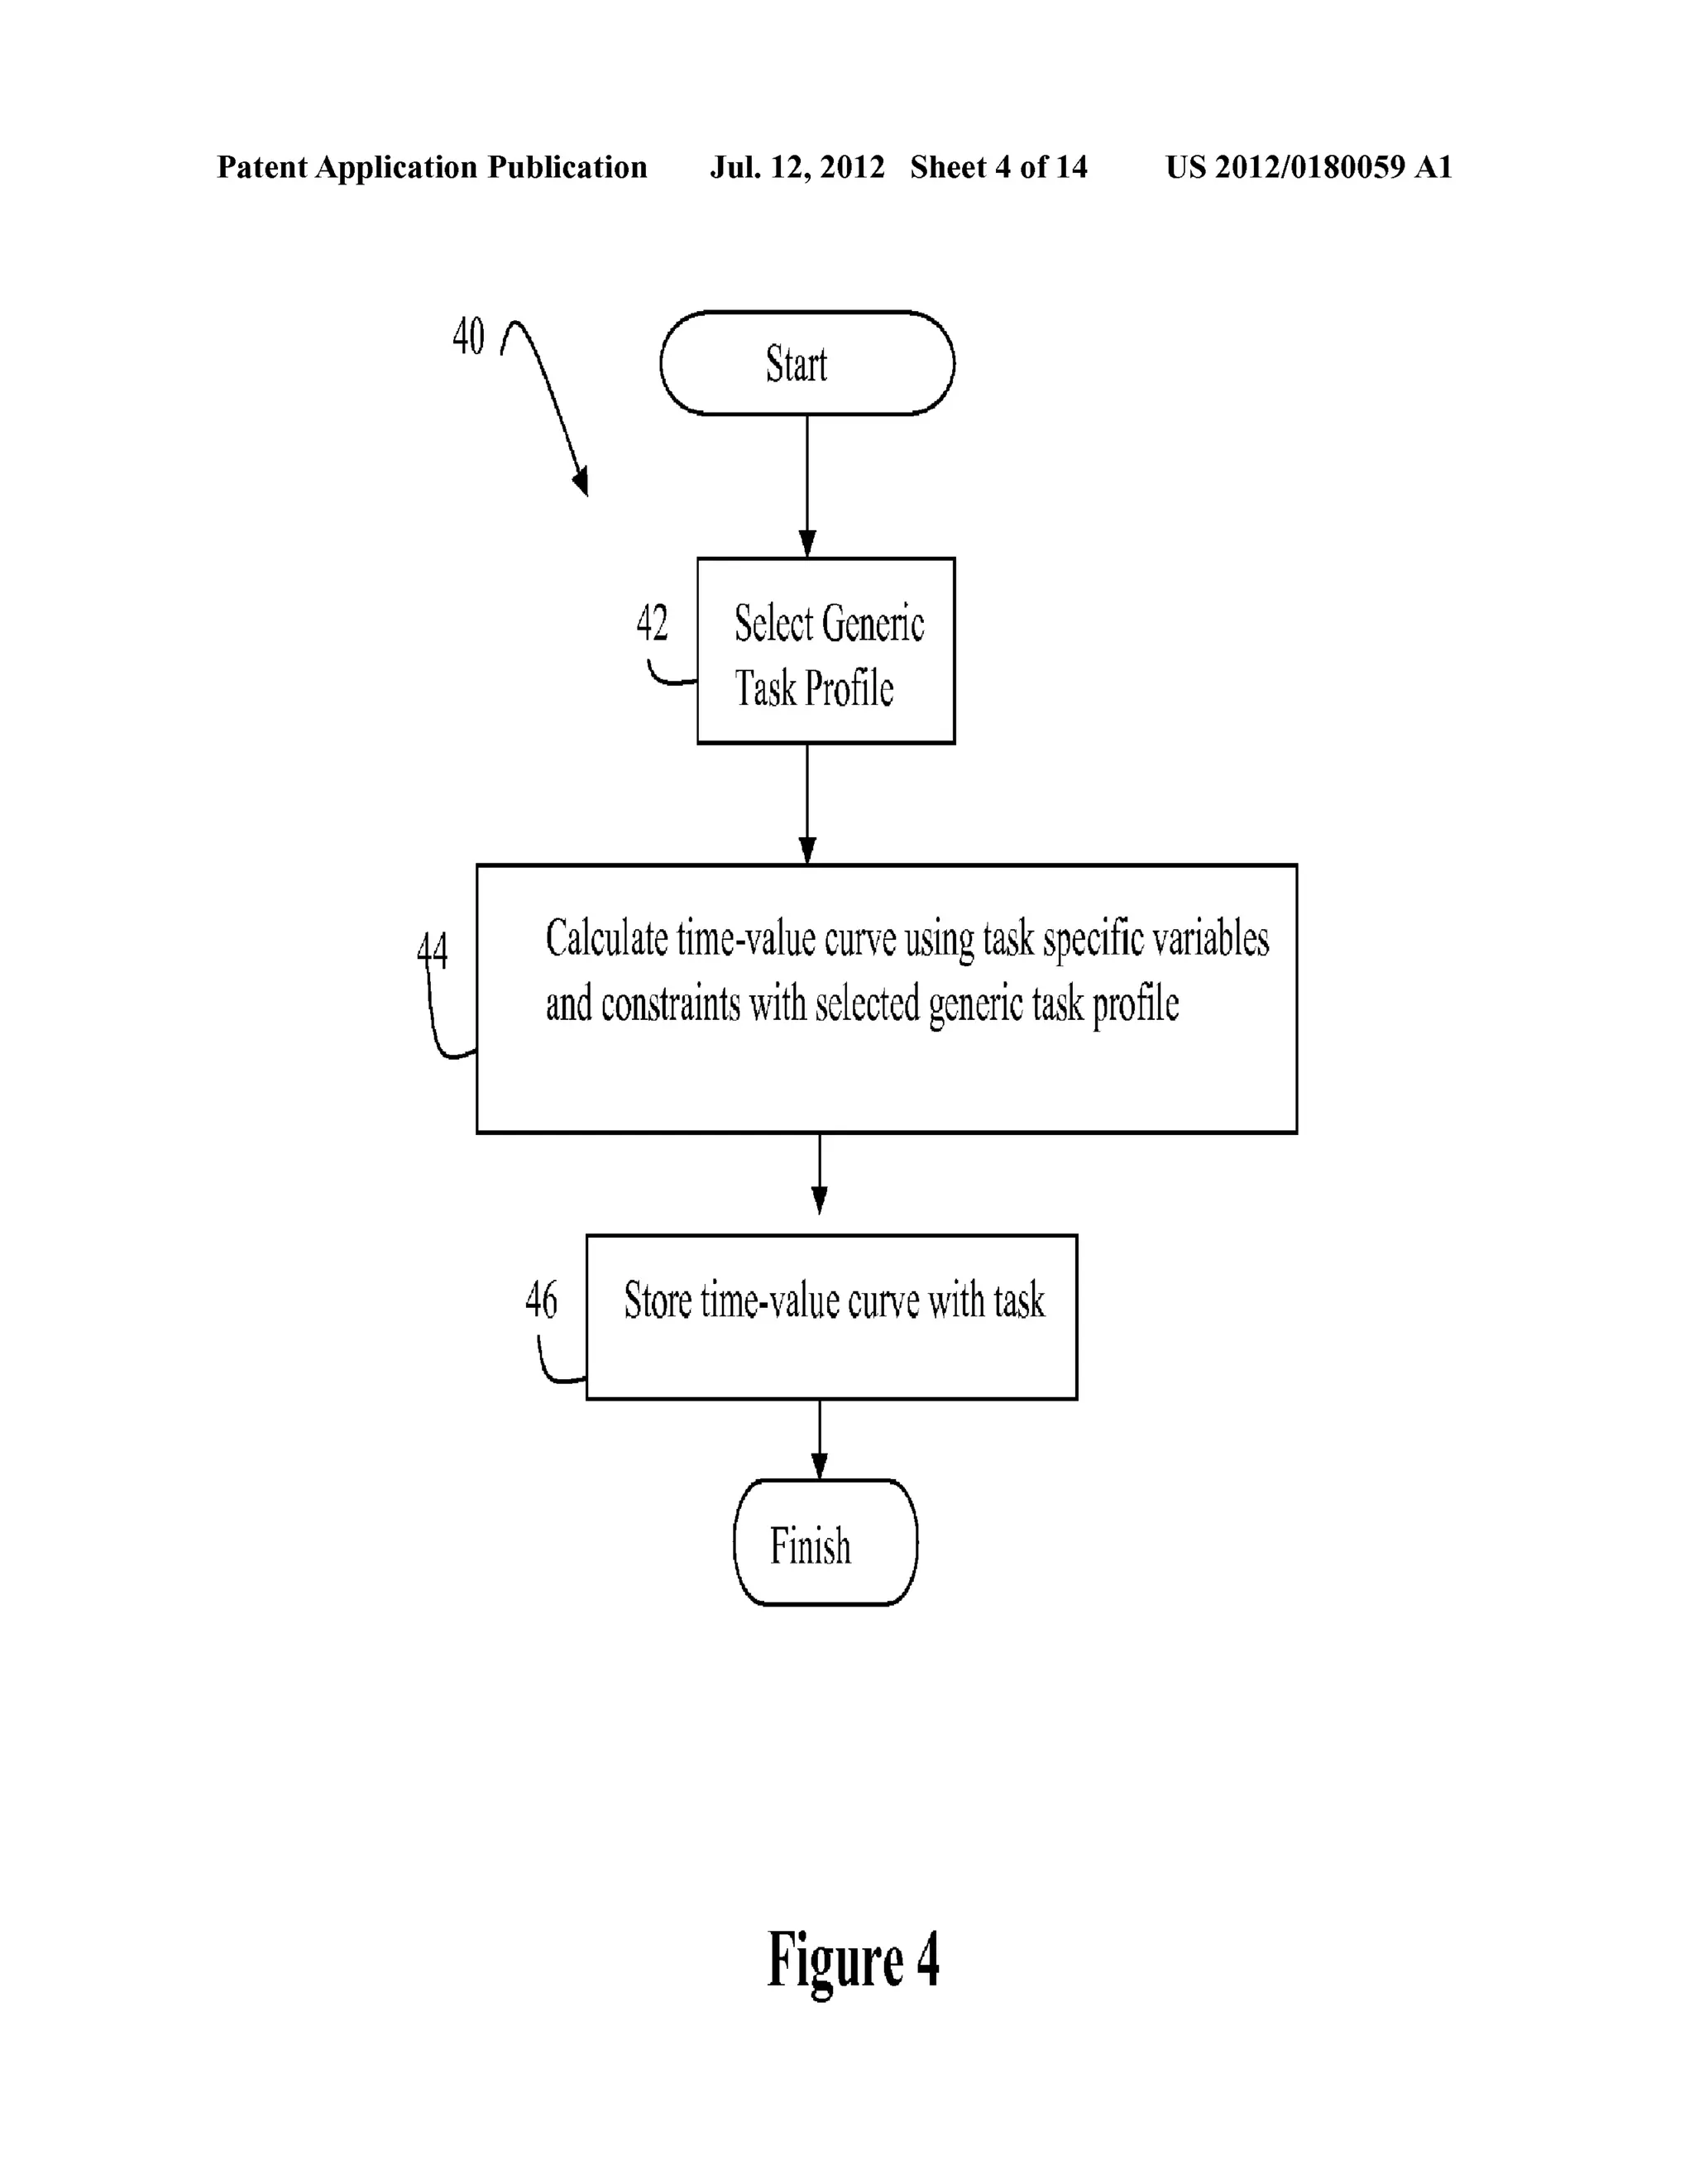
[0012] FIG. 4 is a How diagram illustrating exemplary steps
that may be performed by the policy engine of FIG. 2 to
generate time-value curves for one or more tasks in a Work
How;
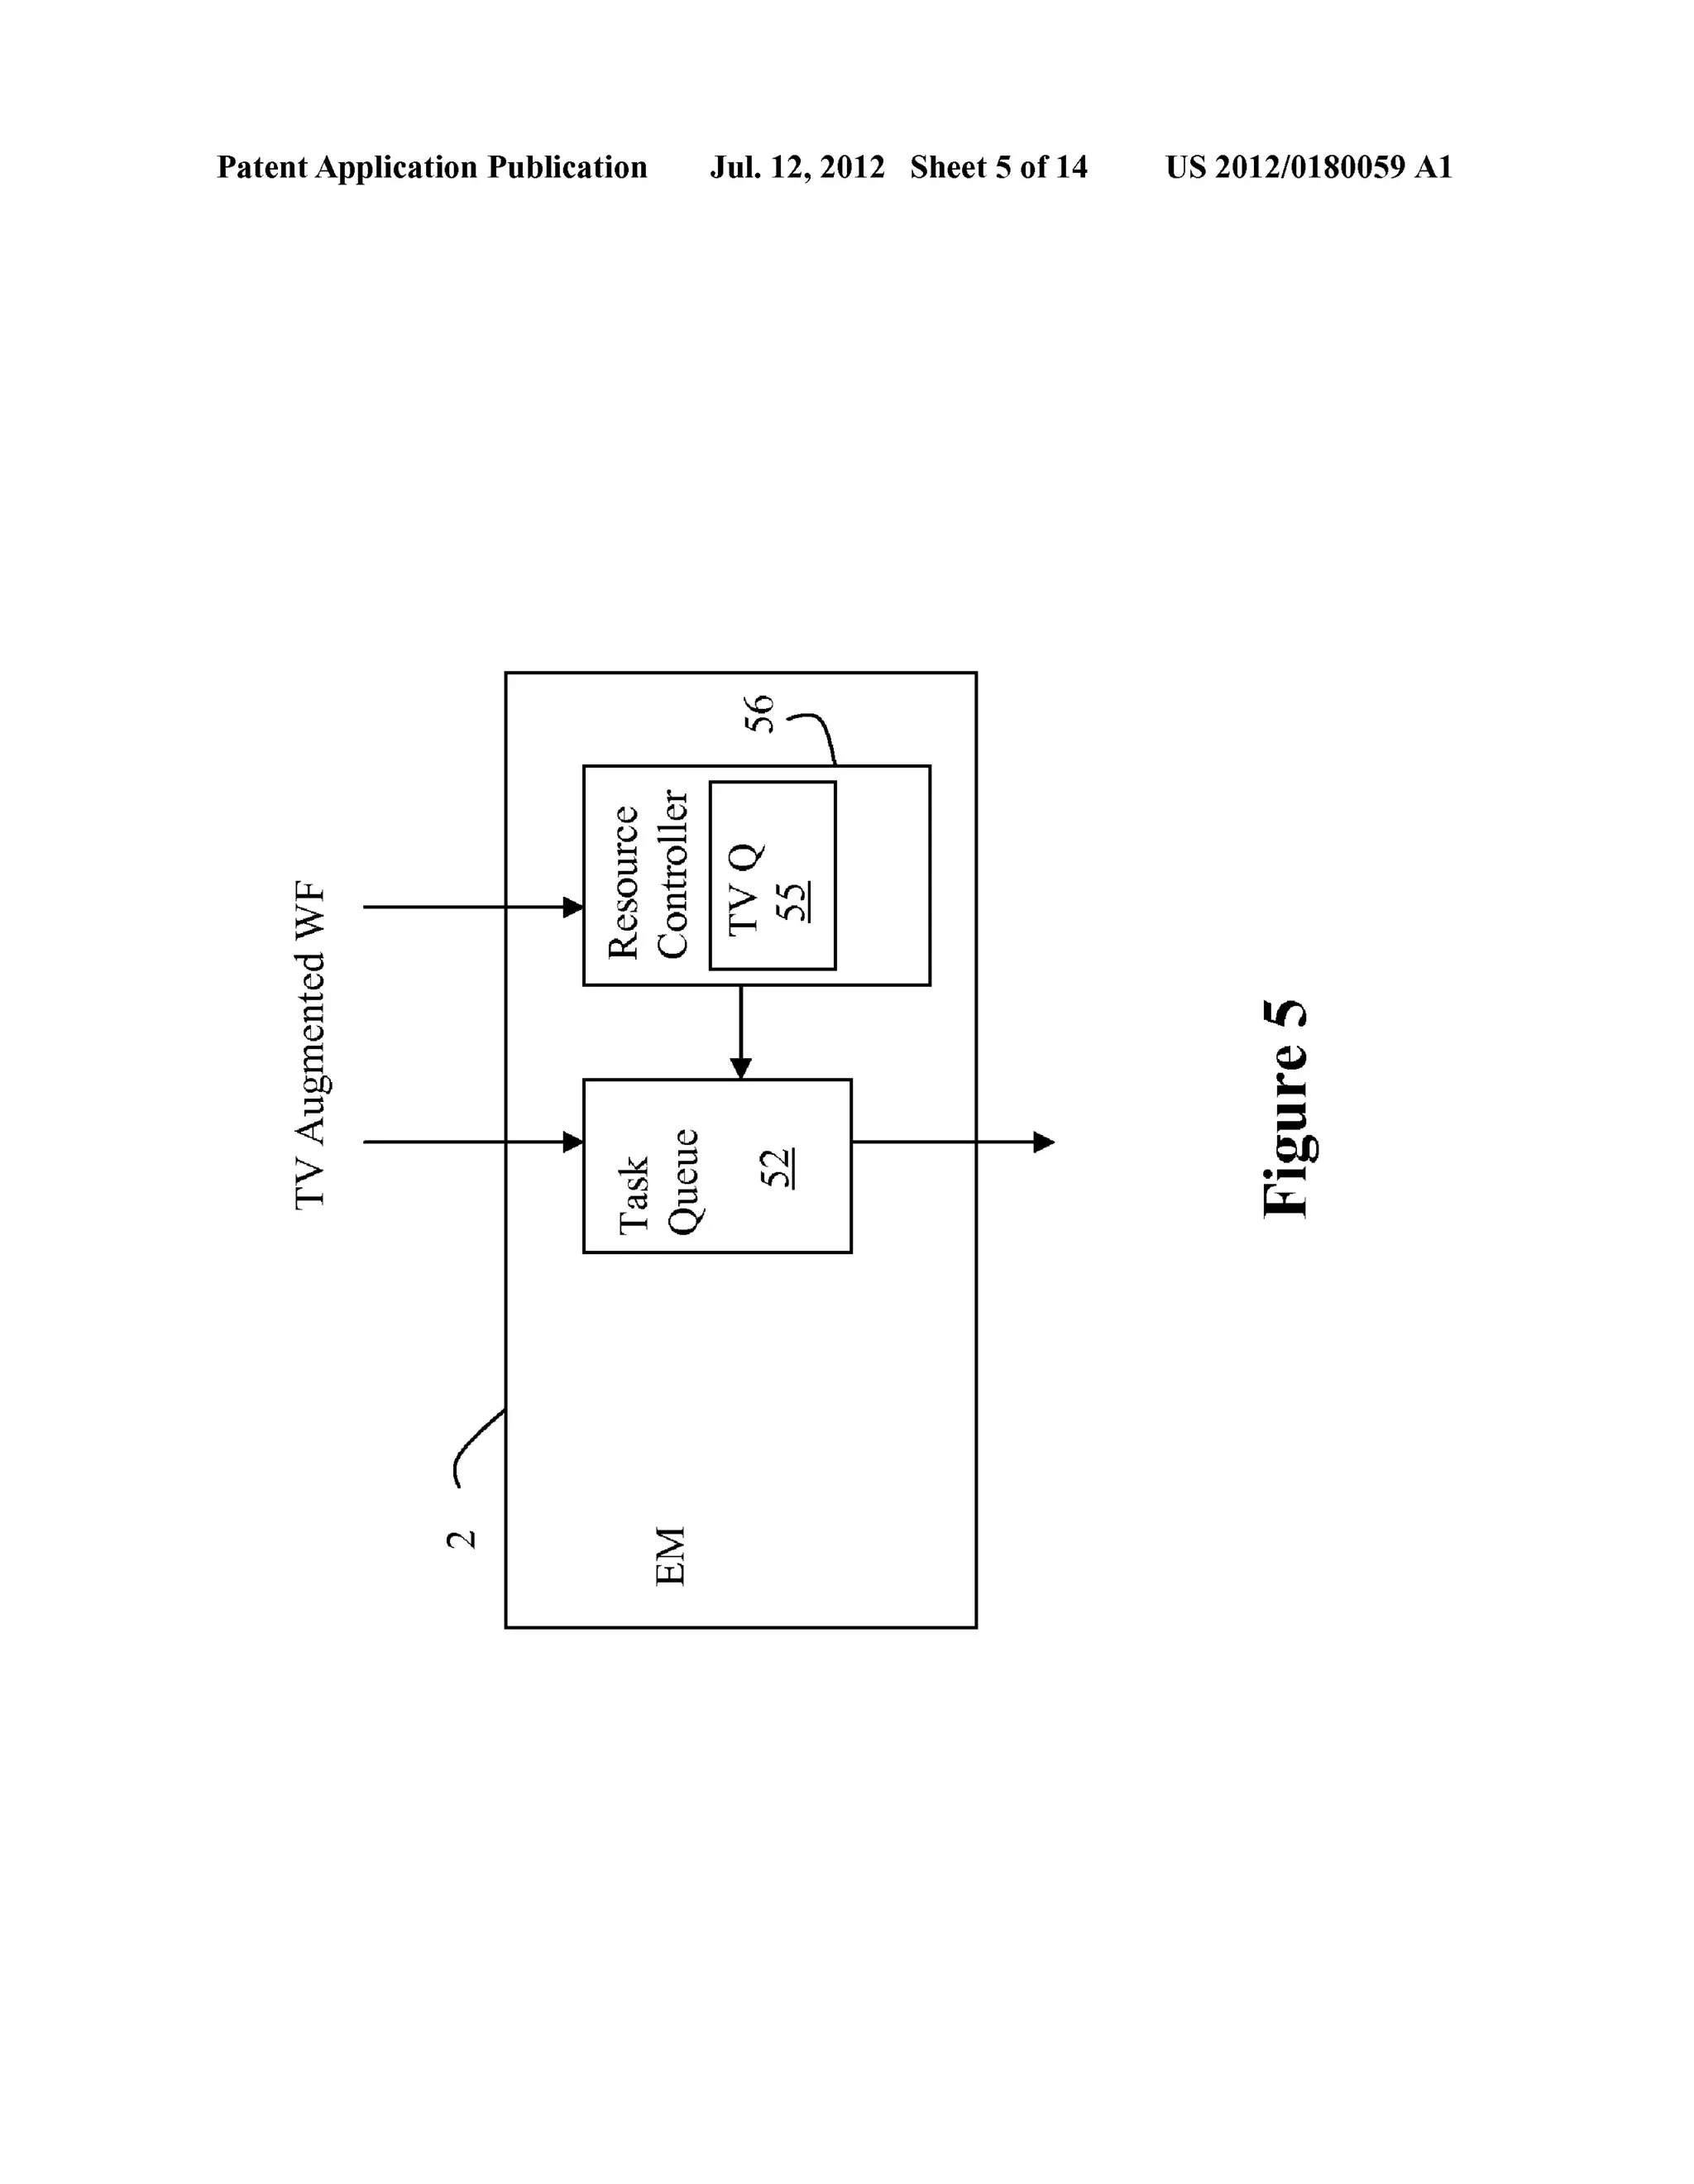
[0013] FIG. 5 is a diagram of an exemplary netWork or
service resource manager Which may use the time value
curves of the present invention to control allocation of
resources to Work?oW tasks;
[0014] FIG. 6 is a timing diagram illustrating several exem
plary time-value curves that may be assigned to tasks in a
Work?oW;
[0015] FIGS. 7A and 7B are timing diagrams provided to
illustrate the addition of time value curves as tasks are added
to a Work?oW;
[0016] FIGS. 8A and 8B are used to describe an embodi
ment of the present invention supporting a surveillance Work
How;
[0017] FIG. 9 is a processing timing diagram Which picto
rially illustrates the bandWidth smoothing capabilities of
time-value QoS servicing of a Work?oW;
[0018] FIG. 10 is a pictorial representation of task selection
using time-value curves in the example of FIG. 9;
[0019] FIGS. 11A and 11B are timing diagrams used to
illustrate a stalled task drop capability of the present inven
tion;
[0020] FIG. 12 is a How diagram illustrating exemplary
steps that may be performed by a policy engine performing
task dropping such as that illustrated in FIGS. 11A and 11B;
[0021] FIG. 13 is a graph illustrating the performance of
TV QoS versus Fixed QoS as the offered load increases; and
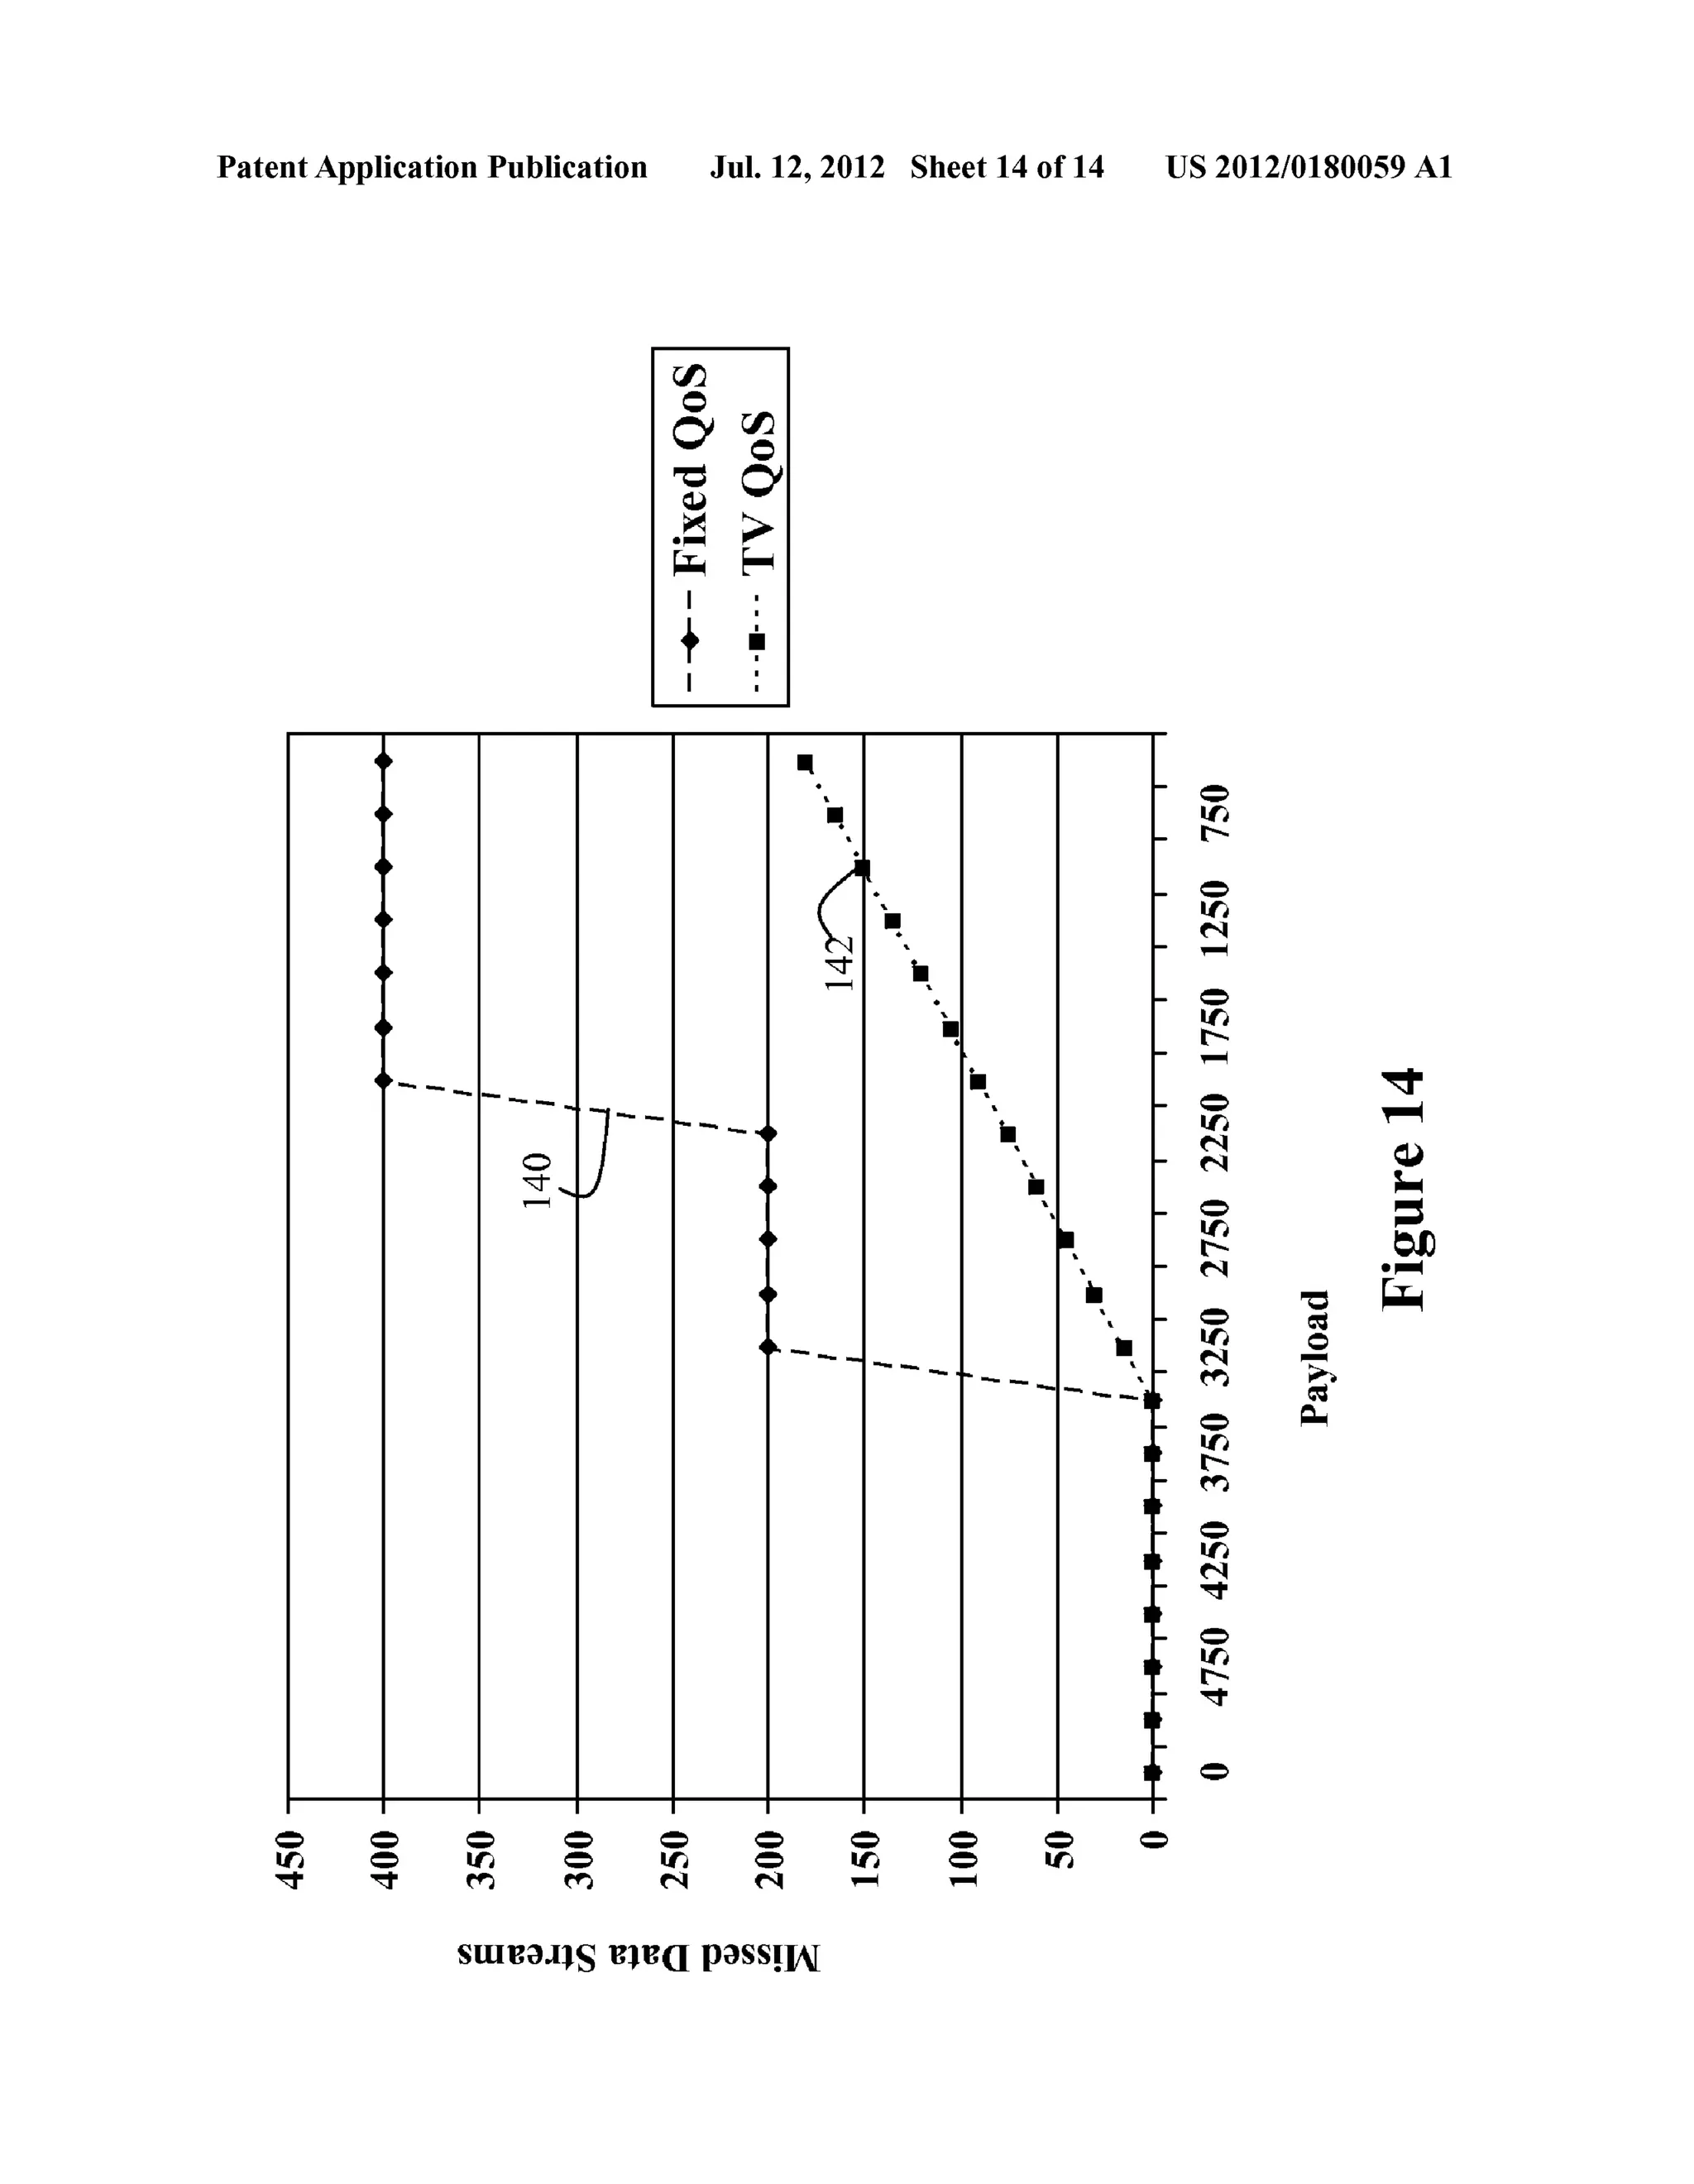
[0022] FIG. 14 is a graph illustrating hoW TV QoS provides
for graceful netWork failure.
DETAILED DESCRIPTION
[0023] FIG. 1 illustrates a mission architecture 1 in Which
the present invention may advantageously be used to optimiZe
mission resource utiliZation. In one embodiment the mission](https://image.slidesharecdn.com/us20120180059-141031122951-conversion-gate01/75/Time-value-curves-to-provide-dynamic-QoS-for-time-sensitive-file-transfers-16-2048.jpg)
![US 2012/0180059 A1
architecture 1 is an adaptive network that uses Work?ow
Locked Loops (WLL) for mission resource selection and
access management. The embodiment of FIG. 1 includes a
Mission Resource Manager (MRM) 10 and a Software Con
trolled Network (SCN) 12. The MRM 10 essentially orches
trates the use of mission resources by a mission by identifying
mission tasks and allocating mission resources to the mission
tasks. Although the MRM may be described below as includ
ing certain components, it should be understood that an MRM
is not a required to implement the present invention. For
example, a set of Mission Goals statements may be input into
the Policy Engine to help form the Time-Value curves via an
administrator at a GUI or automated via a machine interface
or even a Web Services Interface.
[0024] An exemplary MRM 10 includes a Goal to Service
translation Unit 12. The Goal to Service translation Unit may
be a semantic tool which maps a high level goal de?nition,
such as a natural language de?nition, into real-language mis
sion goals into policy statements. One exemplary method for
performing Goal to Service translation is described in Ser.
No. 11/469,416, entitled Mission Goal Statement to Policy
Statement Translation, by Travostino et al, ?led Aug. 31,
2006, incorporated herein by reference.
[0025] Policy statements are translated into work?ows
using the Goal to Service Translation Unit (GSTU) 12, the
Constraint Analyzer (CA) 15, the Discovery Engine and
Scheduler (DES) 13 and the Directory 16. Together these
components identify, quantify and qualify services that are
reserved for a mission as described in patent application Ser.
No. 11/469,422 for Work?ow Locked Loops to EnableAdap
tive Networks, by Travostino et al., ?led Aug. 31, 2006.
[0026] For example in one embodiment the directory 16
identi?es network resources and services that may be allo
cated to missions. The DES 13 identi?es resources and ser
vices that are available for use as an infrastructure of the
mission. The CA 15 evaluates the infrastructure identi?ed by
the DES 13 in view of mission constraints. The CA 15 and
DES 13 work in concert with the goal translator to identify the
mission infrastructure. An Engine uses the infrastructure and
mission information to generate mission work?ows, which
are forwarded to the SCN 14.
[0027] The SCN 14 generally controls the execution of the
mission and the use of the mission resources during execution
of the mission. The SCN 14 includes an Execution Manager
(EM) 22, a Policy Engine (PE) 24, a Network Services Man
ager (26), a Network Resource Manager (NRM) 28 and a
Network Resource and Topology Discovery resource 27.
Together these components orchestrate the execution of the
mission work?ow using the identi?ed mission resources.
[0028] For the purpose of this application a mission work
?ow is a collection of tasks that are performed by a collection
of actors, wherein an actor may be any entity that uses a
mission dedicated resource. A mission dedicated resource is
any resource that is at least partially dedicated to a mission.
[0029] Mission tasks are dynamic, and therefore during the
course of the mission different tasks are initiated and termi
nated. At any given time during the mission, mission tasks
may seek access to a shared mission resource. According to
one aspect of the invention, each task has an associated time
value curve indicating a temporal priority of the task over the
task lifetime. The time-value curves are used during resource
allocation to intelligently allocate resources to tasks to opti
miZe the performance of the mission. Each point in a time
value curve identi?es a priority of QoS to be associated with
Jul. 12, 2012
the task for the point in time. This allows QoS to be adjusted
in real time based on conditions in the ?eld, thereby adding
the degree of temporal granularity to the QoS structure. Con
trolling temporal granularity of QoS helps resolve the con
?icts of congestion and while supplying all the resources to
the mission within the mission time-frame, without having to
expand the siZe of the network.
[0030] In one embodiment the PE 24 generates a time-value
curve for each mission task. The time value curves are for
warded to the EM 22. At resource allocation intervals the EM
references the relative values of the time-value curve of each
tasks that are active at that time instance to retrieve a time
value for each task, wherein an active task is any task that has
been initiated and not terminated. Using any one of a variety
of selection methods, such as highest value, highest weighted
value, etc., the time values are compared to select one of the
active tasks.
[0031] FIG. 2 illustrates several exemplary components
that may be included in a PE to generate time-value curves for
tasks. The PE 24 includes a work?ow parser 31, a generic task
pro?le store 34, and time-value (TV) curve generation logic
32. The work?ow parser receives work?ow tasks from the
Execution Machine (EM). The task may have been initiated in
response to a mission trigger; for example, in a surveillance
mission, a mission trigger may be the capturing of an image at
a sensor point in a surveillance area. The tasks may be trig
gered by partial or thorough completion of another task.
However the task is triggered, it is forwarded to the work?ow
parser 31 which extracts task information that may be used to
build the time-value curve. Any obtainable information which
may affect a priority or quality of service to provide to the task
may be provided to the time-value curve generation logic,
including, for example, information regarding an actor of the
task, a location of the task, a security level of the task, con
straints of the tasks, dependencies of the task, power require
ments of the task, execution time for the task, etc. Information
regarding services and network elements that are associated
with the task may also be used when calculating the time
value curve. The present invention is in no way limited to the
use of any particular task information in generating a time
value curve for priority scheduling of the task.
[0032] The generic task pro?le store 34 may be used to
store pre-determined task pro?les. The predetermined task
pro?les are tailored to the resource requirements of various
pre-de?ned tasks. For example, a surveillance task that per
forms high resolution image capture would have a time-value
curve that temporally aligns the resource priority with the
resource usage characteristics of the task. The resource
requirements of a task may be selected from a set of pre
de?ned pro?les, or obtained by monitoring and pro?ling
resource usage in advance to generate a time-value pro?le for
the task. FIGS. 3A-3H illustrates several representative time
value curve pro?les. A time value-curve pro?le such as that of
FIGS. 3A and 3B may be applied to a speci?c task identi?ed
as having a relatively ?at QoS. Pro?les 3C and 3D may be
used to apply a linear QoS to a task. Impulse pro?les 3E and
3E may be used to provide high priority to a task for a short
time. Time value curves of 7G and 7H illustrate curves that
are constructed for a particular QoS pro?le.
[0033] FIG. 4 illustrates an exemplary process that may be
performed by the PE 24 to construct a time-value curve for a
task. At step 42 a generic pro?le associated with the task is
retrieved from the pro?le store 34. At step 44, the time-value
curve is piece-wise constructed using the base pro?le in con](https://image.slidesharecdn.com/us20120180059-141031122951-conversion-gate01/75/Time-value-curves-to-provide-dynamic-QoS-for-time-sensitive-file-transfers-17-2048.jpg)
![US 2012/0180059 A1
junction With task speci?c variables, constraints and resource
information using techniques knoWn to those in the art. At
step 46 the time-value curve is stored With the task. The TV
augmented task is then forwarded to the EM 22.
[0034] FIG. 5 illustrates exemplary components that may
be included in an Execution Manager 22 that uses the time
value curves of the invention. The EM 22 Would generally
include task queues 52 for storing active mission tasks. The
task queues may be organiZed by mission resource. A
resource controller 56 may include or otherWise have access
to the Time-Value curves for the tasks, for example in a
time-value queue associated With the task queue. At each
mission resource allocation instance the resource controller
examines the time-values of each active task associated With
a resource at that instance, and selects one of the tasks based
on the time-value curve.
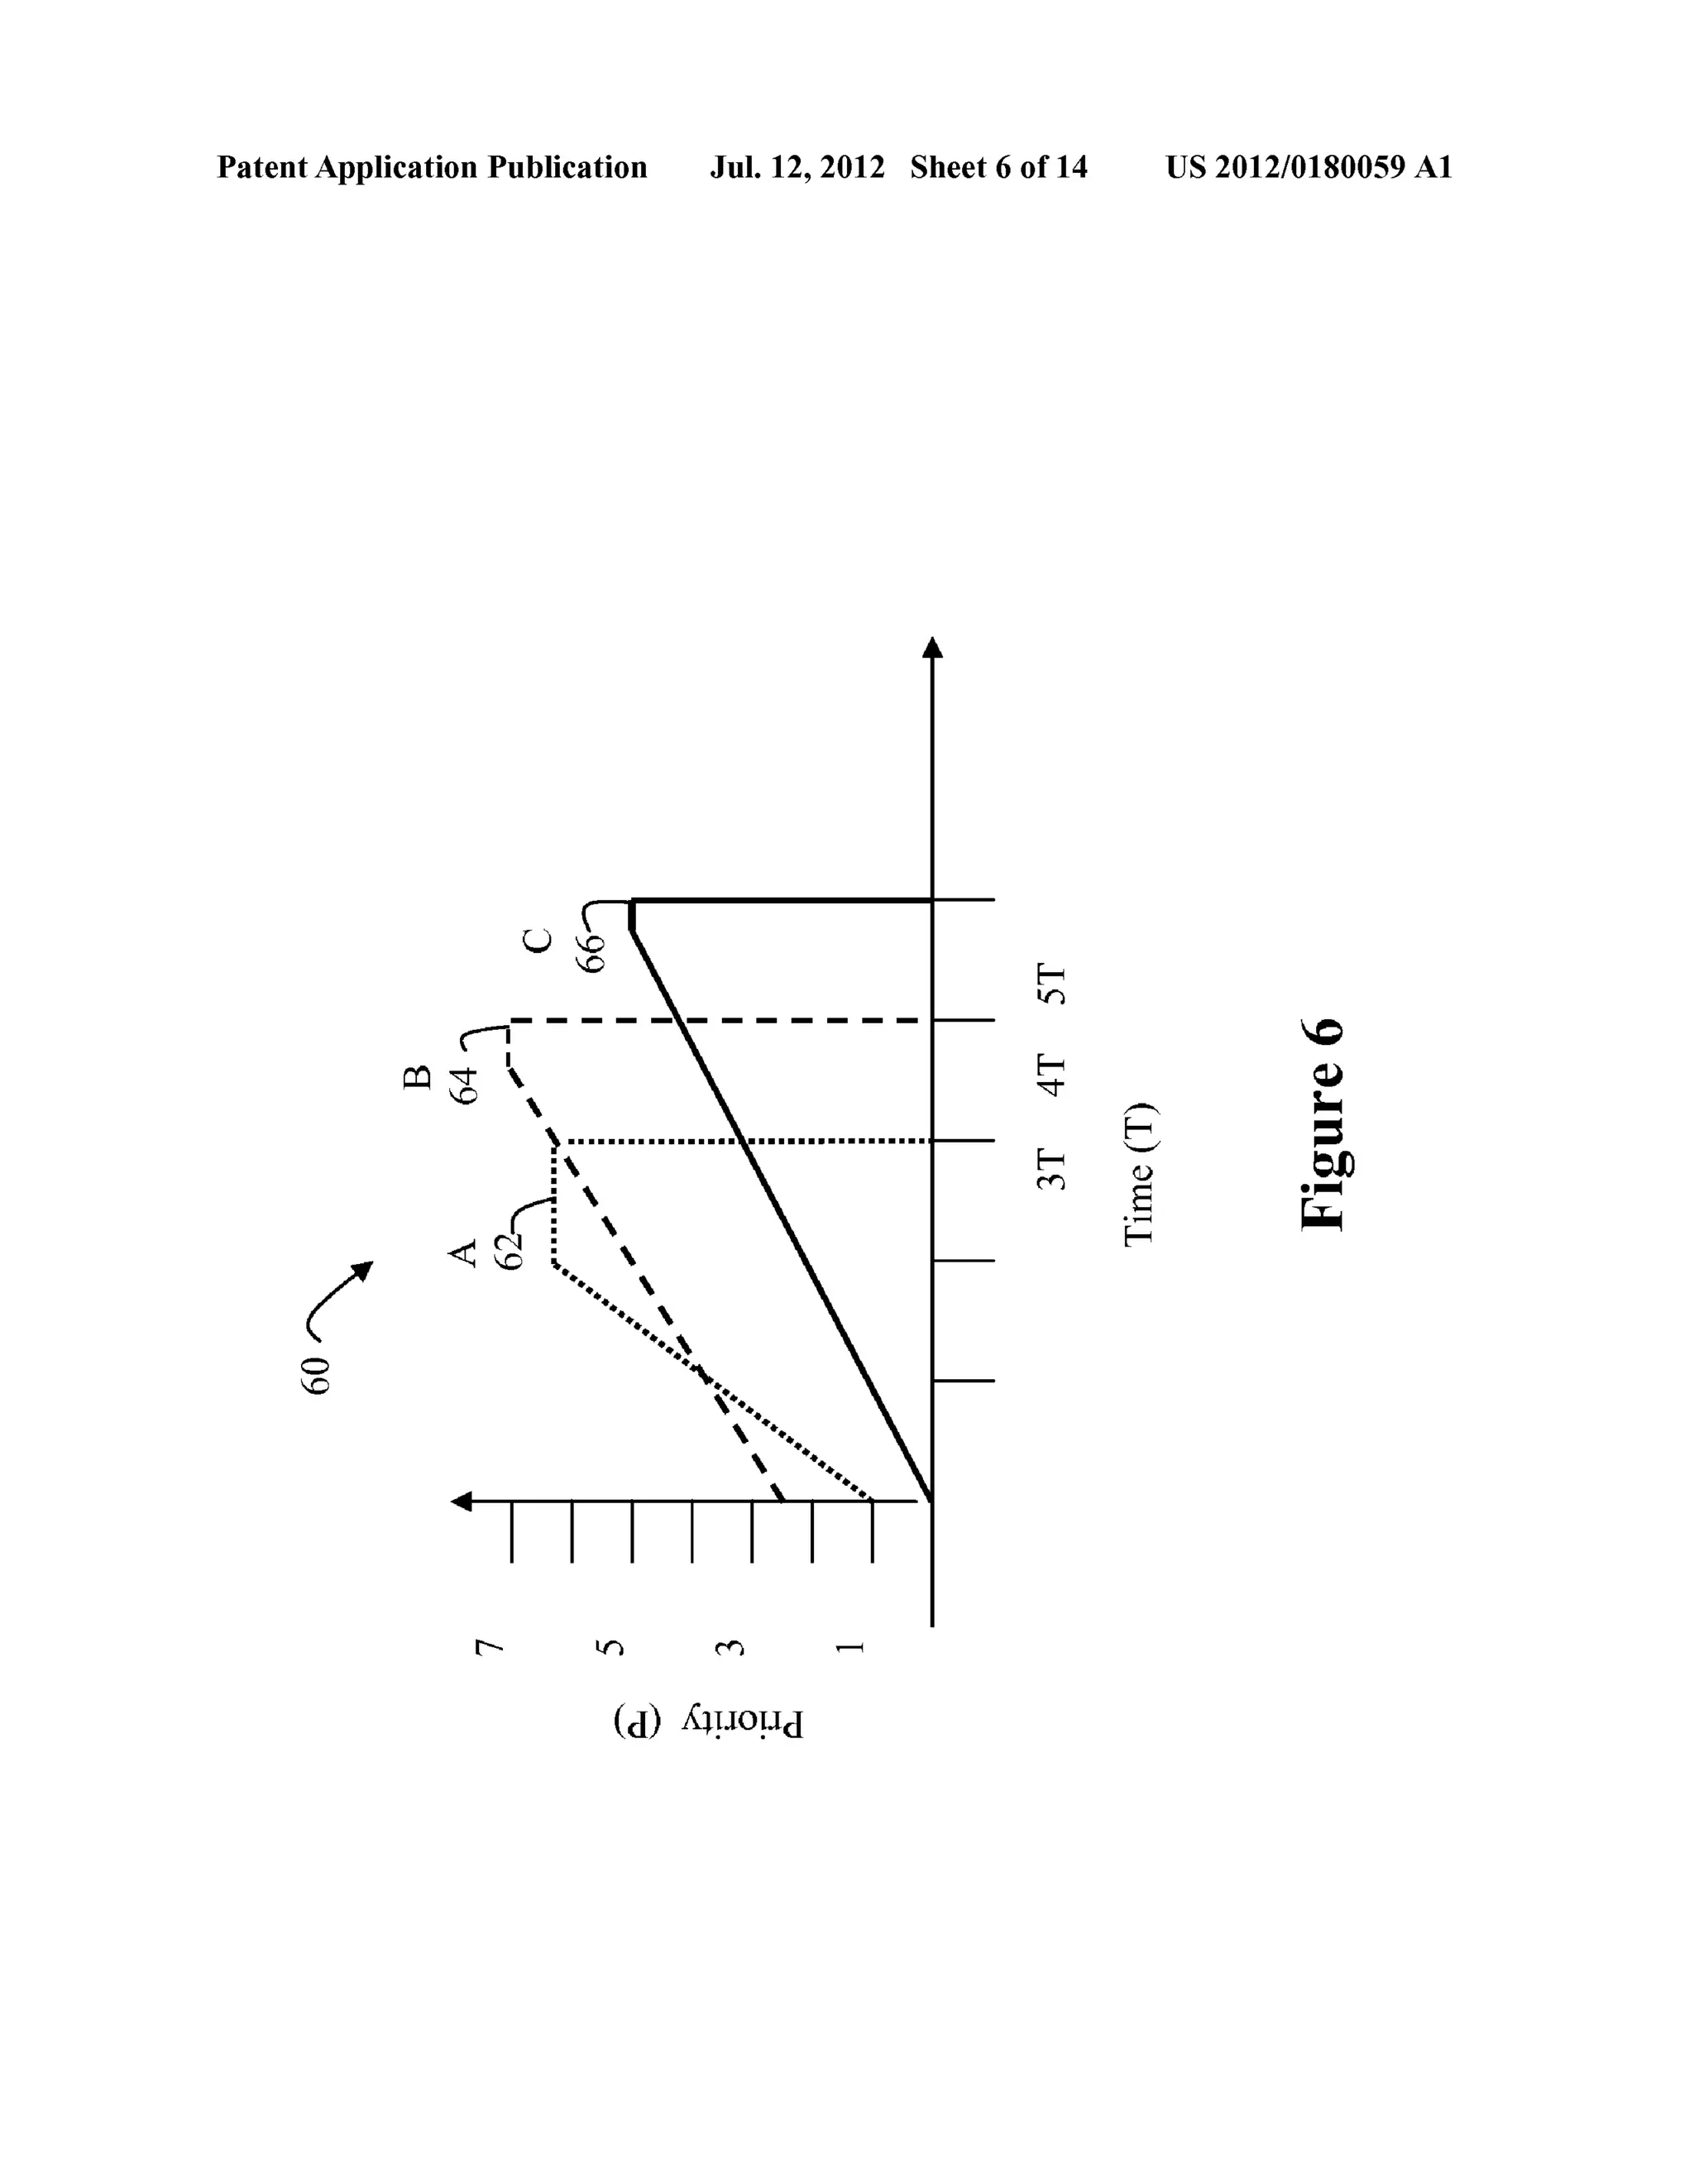
[0035] FIG. 6 is a timing diagram illustrating illustrative
time value curves for 3 tasks A (62), B (64) and C (66). The
generic task pro?le for each of the curves is shoWn by beloW
Equation 1:
Equation 1:
[0036] Where P is the priority, or quality of service, asso
ciated With the task at time T, m is derived based on the value
of the task, the lifetime of the task and the execution time of
the task and b is determined according to a value of the task.
The ?at portion on each of the time-value curves in this
embodiment represents the time needed to complete the task.
Max (P) represents the highest priority to allocate to the task.
[0037] Thus in FIG. 6 time value curve C is a loWer value
task, Which takes a relatively short period of time to complete.
Curve B has the highest initial priority task, With a shorter
lifetime than curve C. Curve A has the second highest initial
priority, but the shortest lifetime. Using strict priority alloca
tion technique, task B Will obtain access to the resource until
time T1. At time T1, access begins to be granted to task A,
With taskA reaching its maximum priority at time 2 to alloW
it to be at maximum priority for the time period associated
With executing the task. The time-value curves may thus be
used provide a temporal priority of the task Which ensures that
the task can complete in its lifetime.
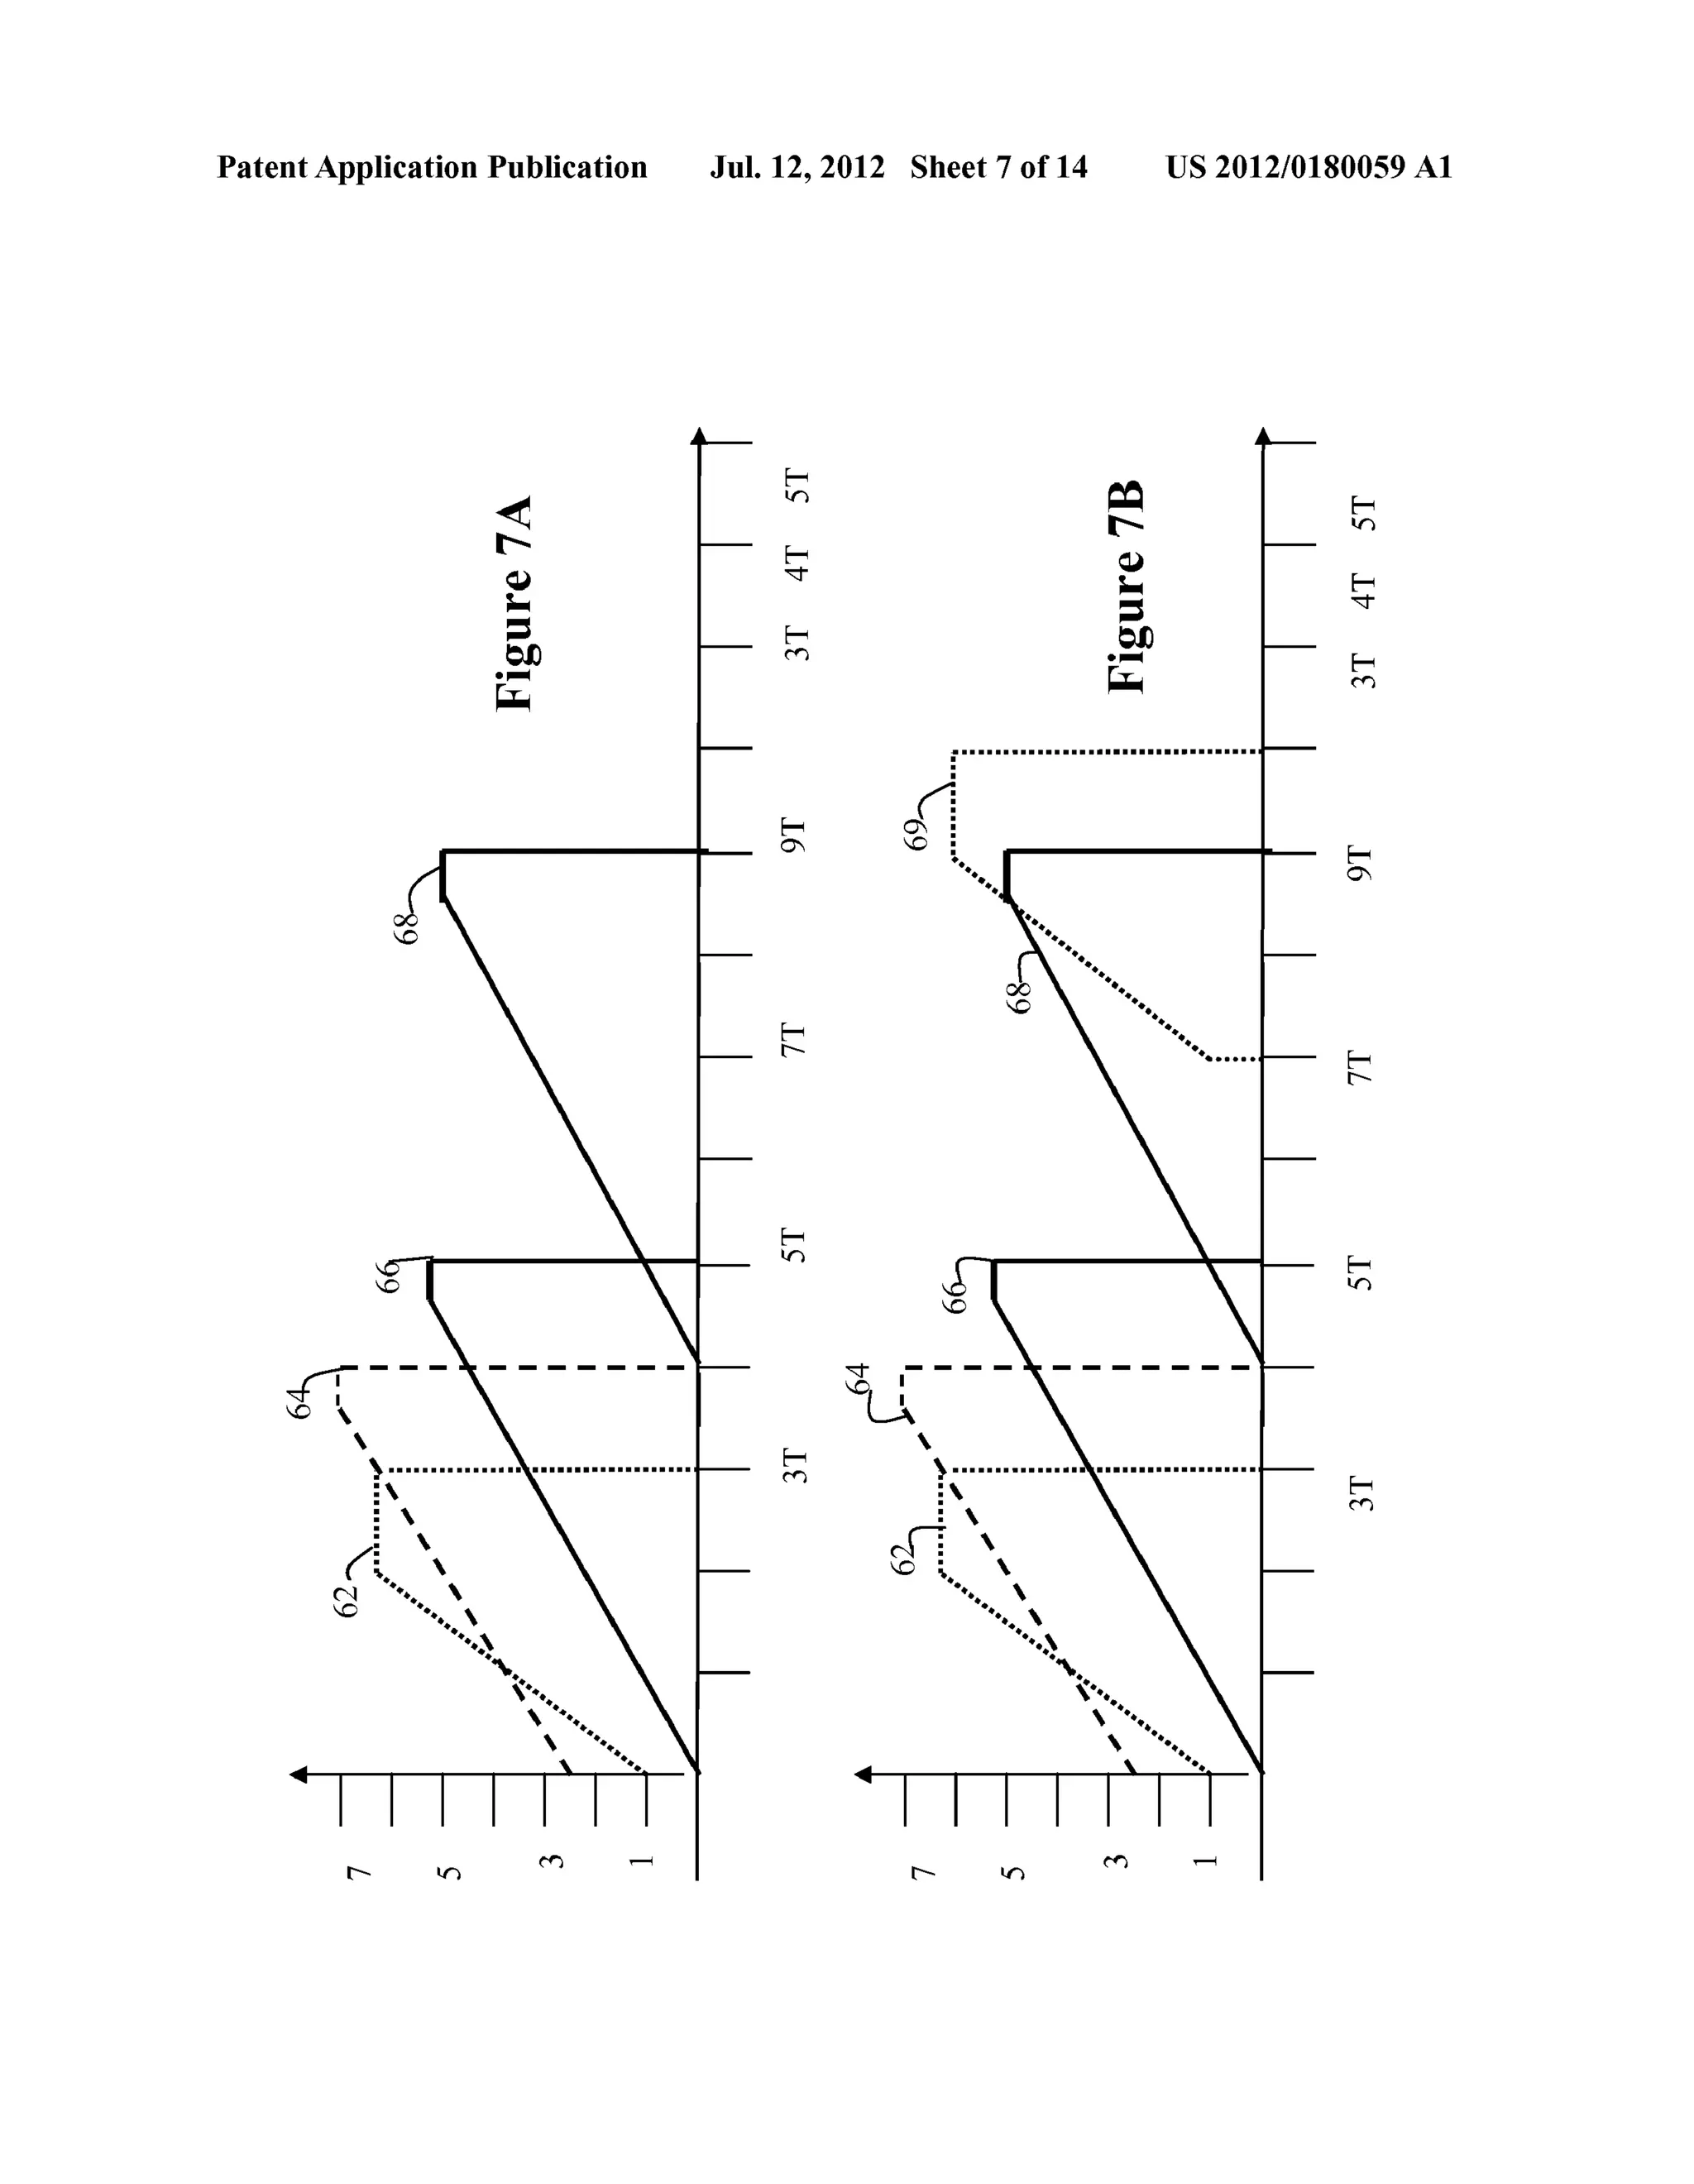
[0038] FIGS. 7A and 7B are pictorial representations of a
mission Work?oW, provided to illustrate the dynamic nature
of Work?oW tasks; tasks are continually instantiated and ter
minated during the Work?oW. For example, at time T4, a loW
priority task 68 is triggered. At time T7 a higher priority task
is triggered. At any resource allocation period, the time value
curves may be used to real-time, dynamic resource manage
ment for a dynamic mission Work?oW.
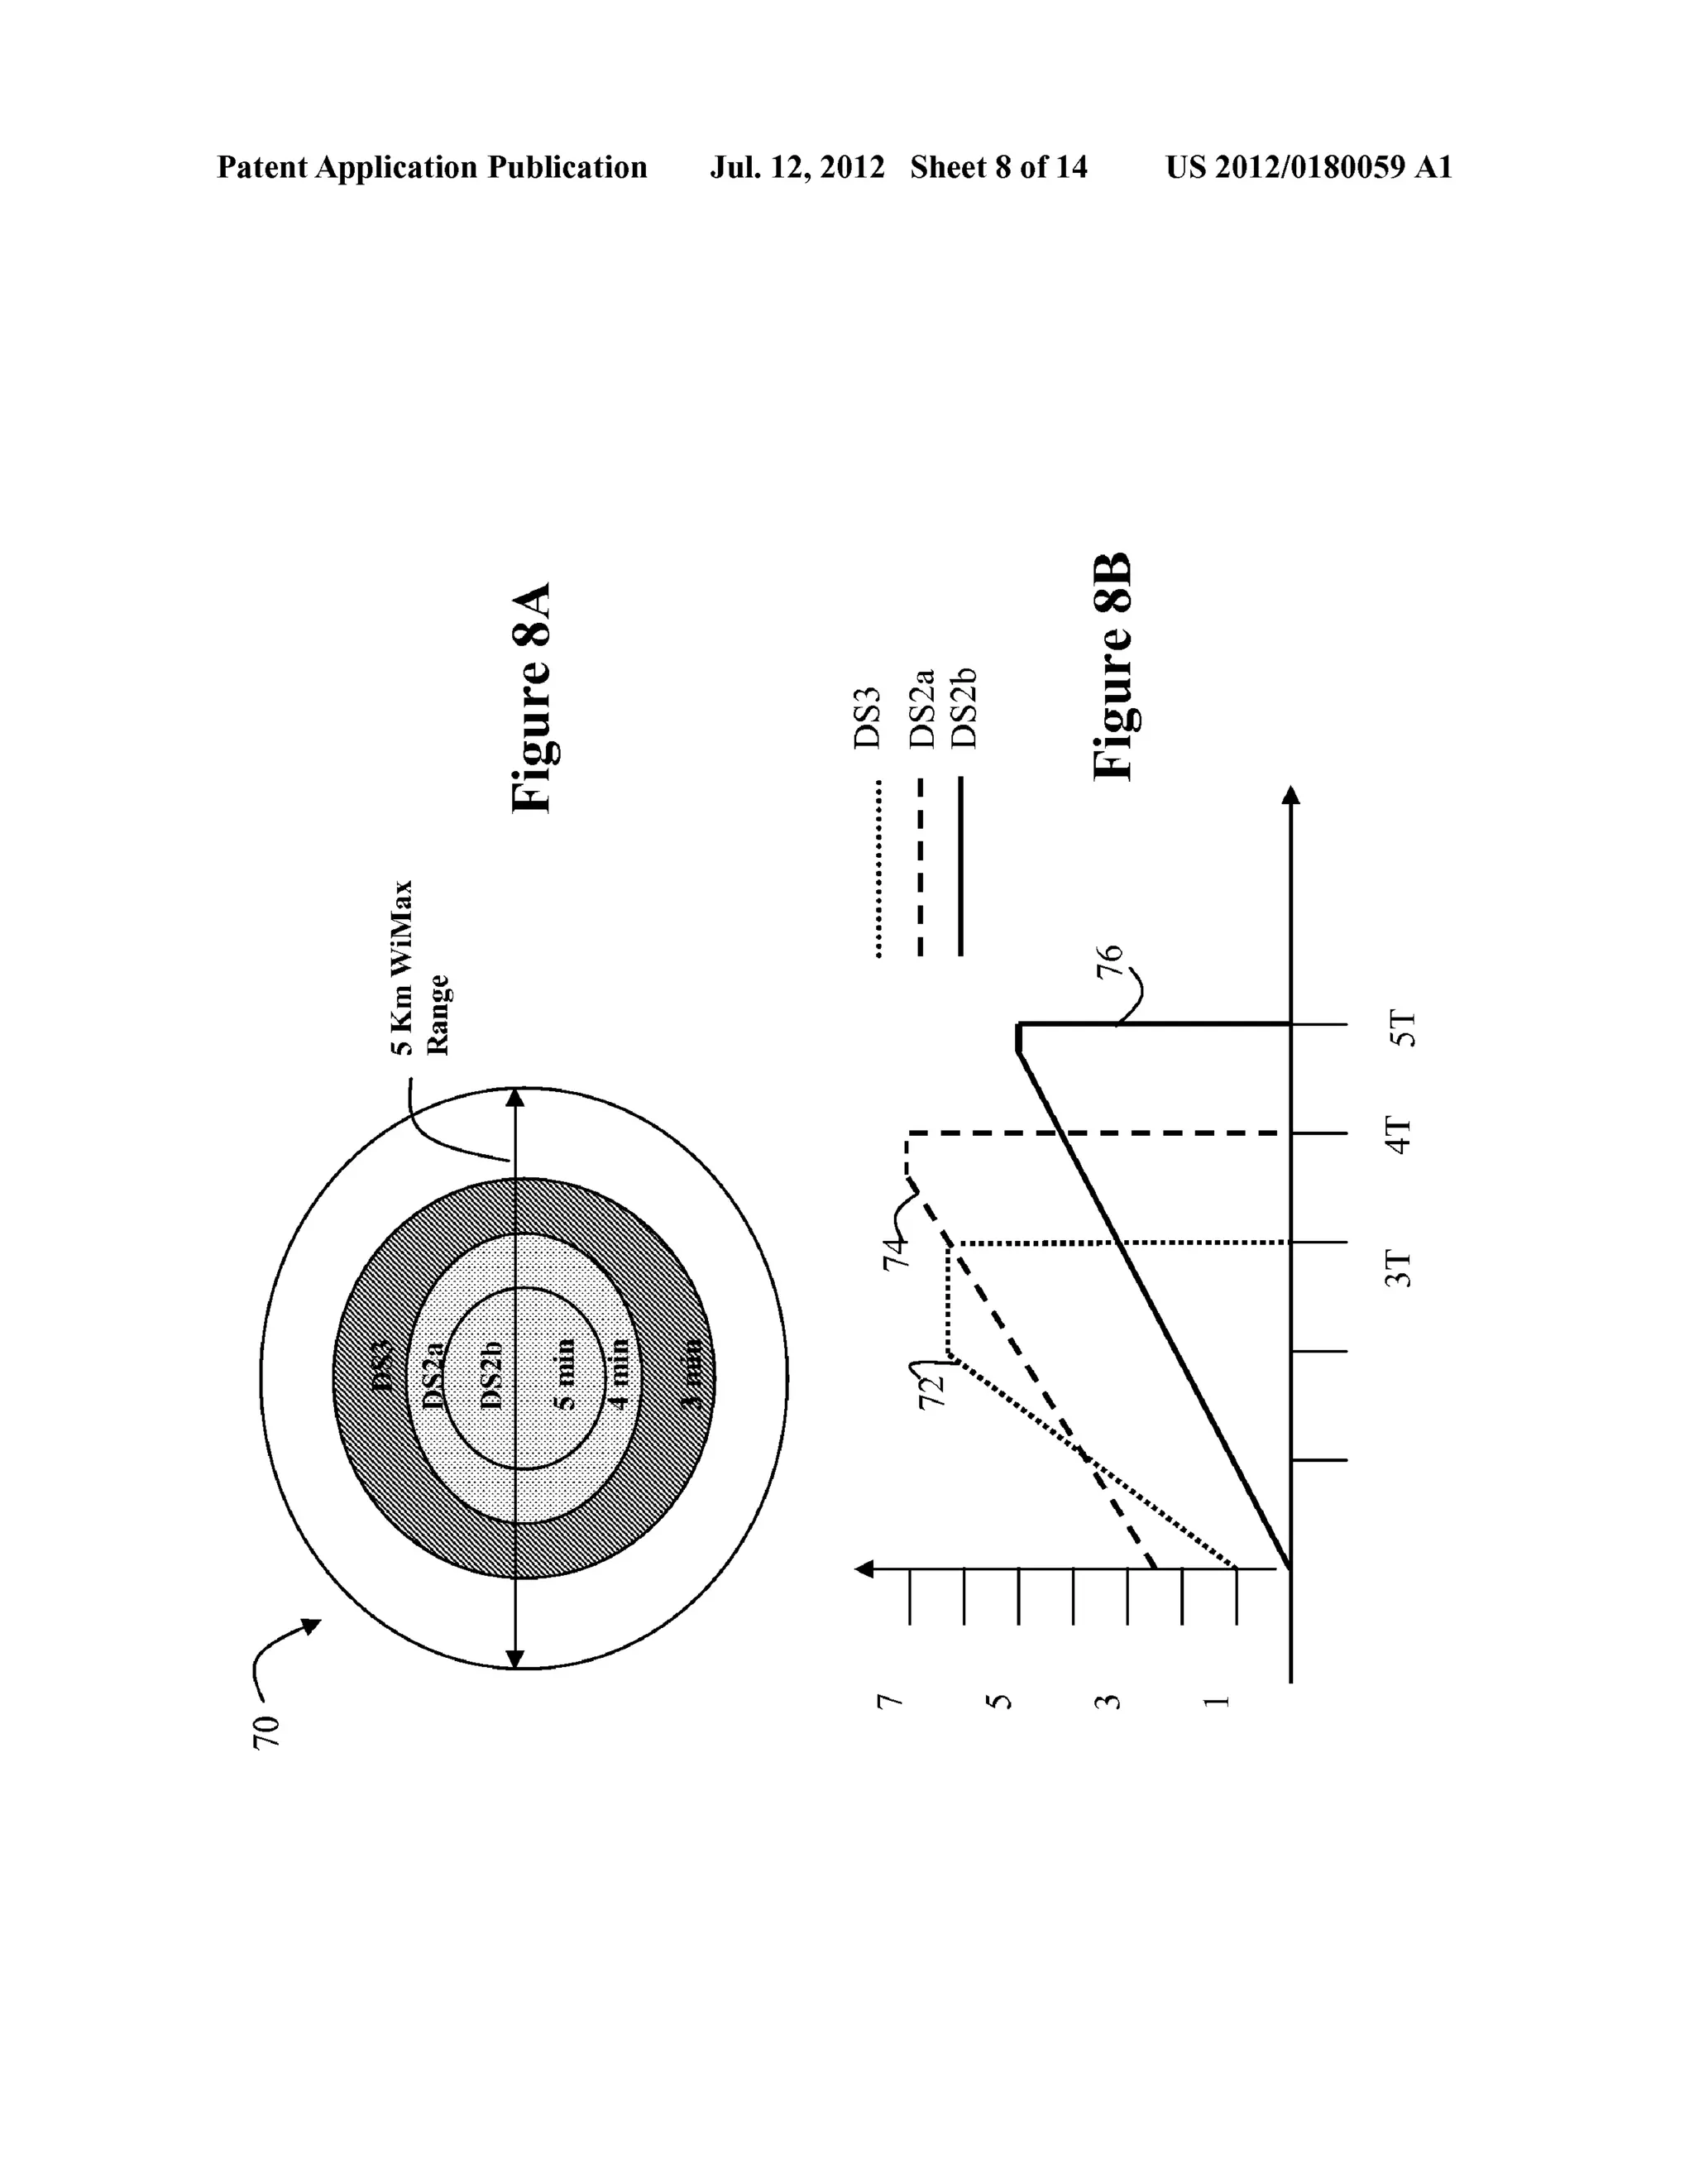
[0039] FIGS. 8A and 8B Will be used to describe an exem
plary embodiment of the present invention for use in a par
ticular mission. The mission of FIG. 8 is a surveillance mis
sion Which seeks to identify individuals Within a de?ned
radius. The mission comprises dependent tasks, With a ?rst set
of tasks being associated With the detection and collection of
information for each an individual that comes Within a radius,
a second set of tasks being associated With collecting high
resolution information regarding individuals Within the
radius, a third set of tasks being associated With collecting
increasingly images at very high resolution. Each of the tasks
of in the mission use netWork bandWidth for the exchange of
information associated With the target. The individuals are
grouped into loW value targets (initial priority 0); mid value
targets (initial priority value 1) and high value targets (initial
Jul. 12, 2012
priority value 2). The targets are detected using mission
resource sensors distributed Within the radius. A detection of
the target results in an attempt to collect information about the
target to determine if the target is a target of interest. The
collection of information may include the transmission of
identi?cation information, such as a loW resolution or high
resolution image. The type of collection to be performed for
each target is a task in the above described architecture. The
task is assigned a time-value curve Which provides a temporal
priority to the collection of information for the particular
target.
[0040] The time value curves of FIG. 8B are associated
With tasks to be performed on three targets. A ?rst task 72 is
associated With a mid priority target Which has been sensed in
area DS3. There are only 3 minutes to collect information
regarding the target before the target leaves the area. Thus the
time-value curve is adapted for this target to ensure that data
collection for this target can occur Within the target tracking
task lifetime. A second task 74 is associated With a target in
area DSa. The target has been identi?ed as a high value target,
perhaps as a result of a loW-resolution image mapping task.
The target is exiting the area in 4 minutes. The slope and
intercept of the time-value curve re?ect the perceived target
value and detected target location, and ensures that adequate
processing of the target may be completed before the target is
lost. Time value curve 76 is associated With a task generated
in response to target detection in area DS2b. There are 5
minutes until the target quits the area, and thus time-value
curve 76 re?ects the loWer quality of service level to be
provided to the collection of information regarding this target.
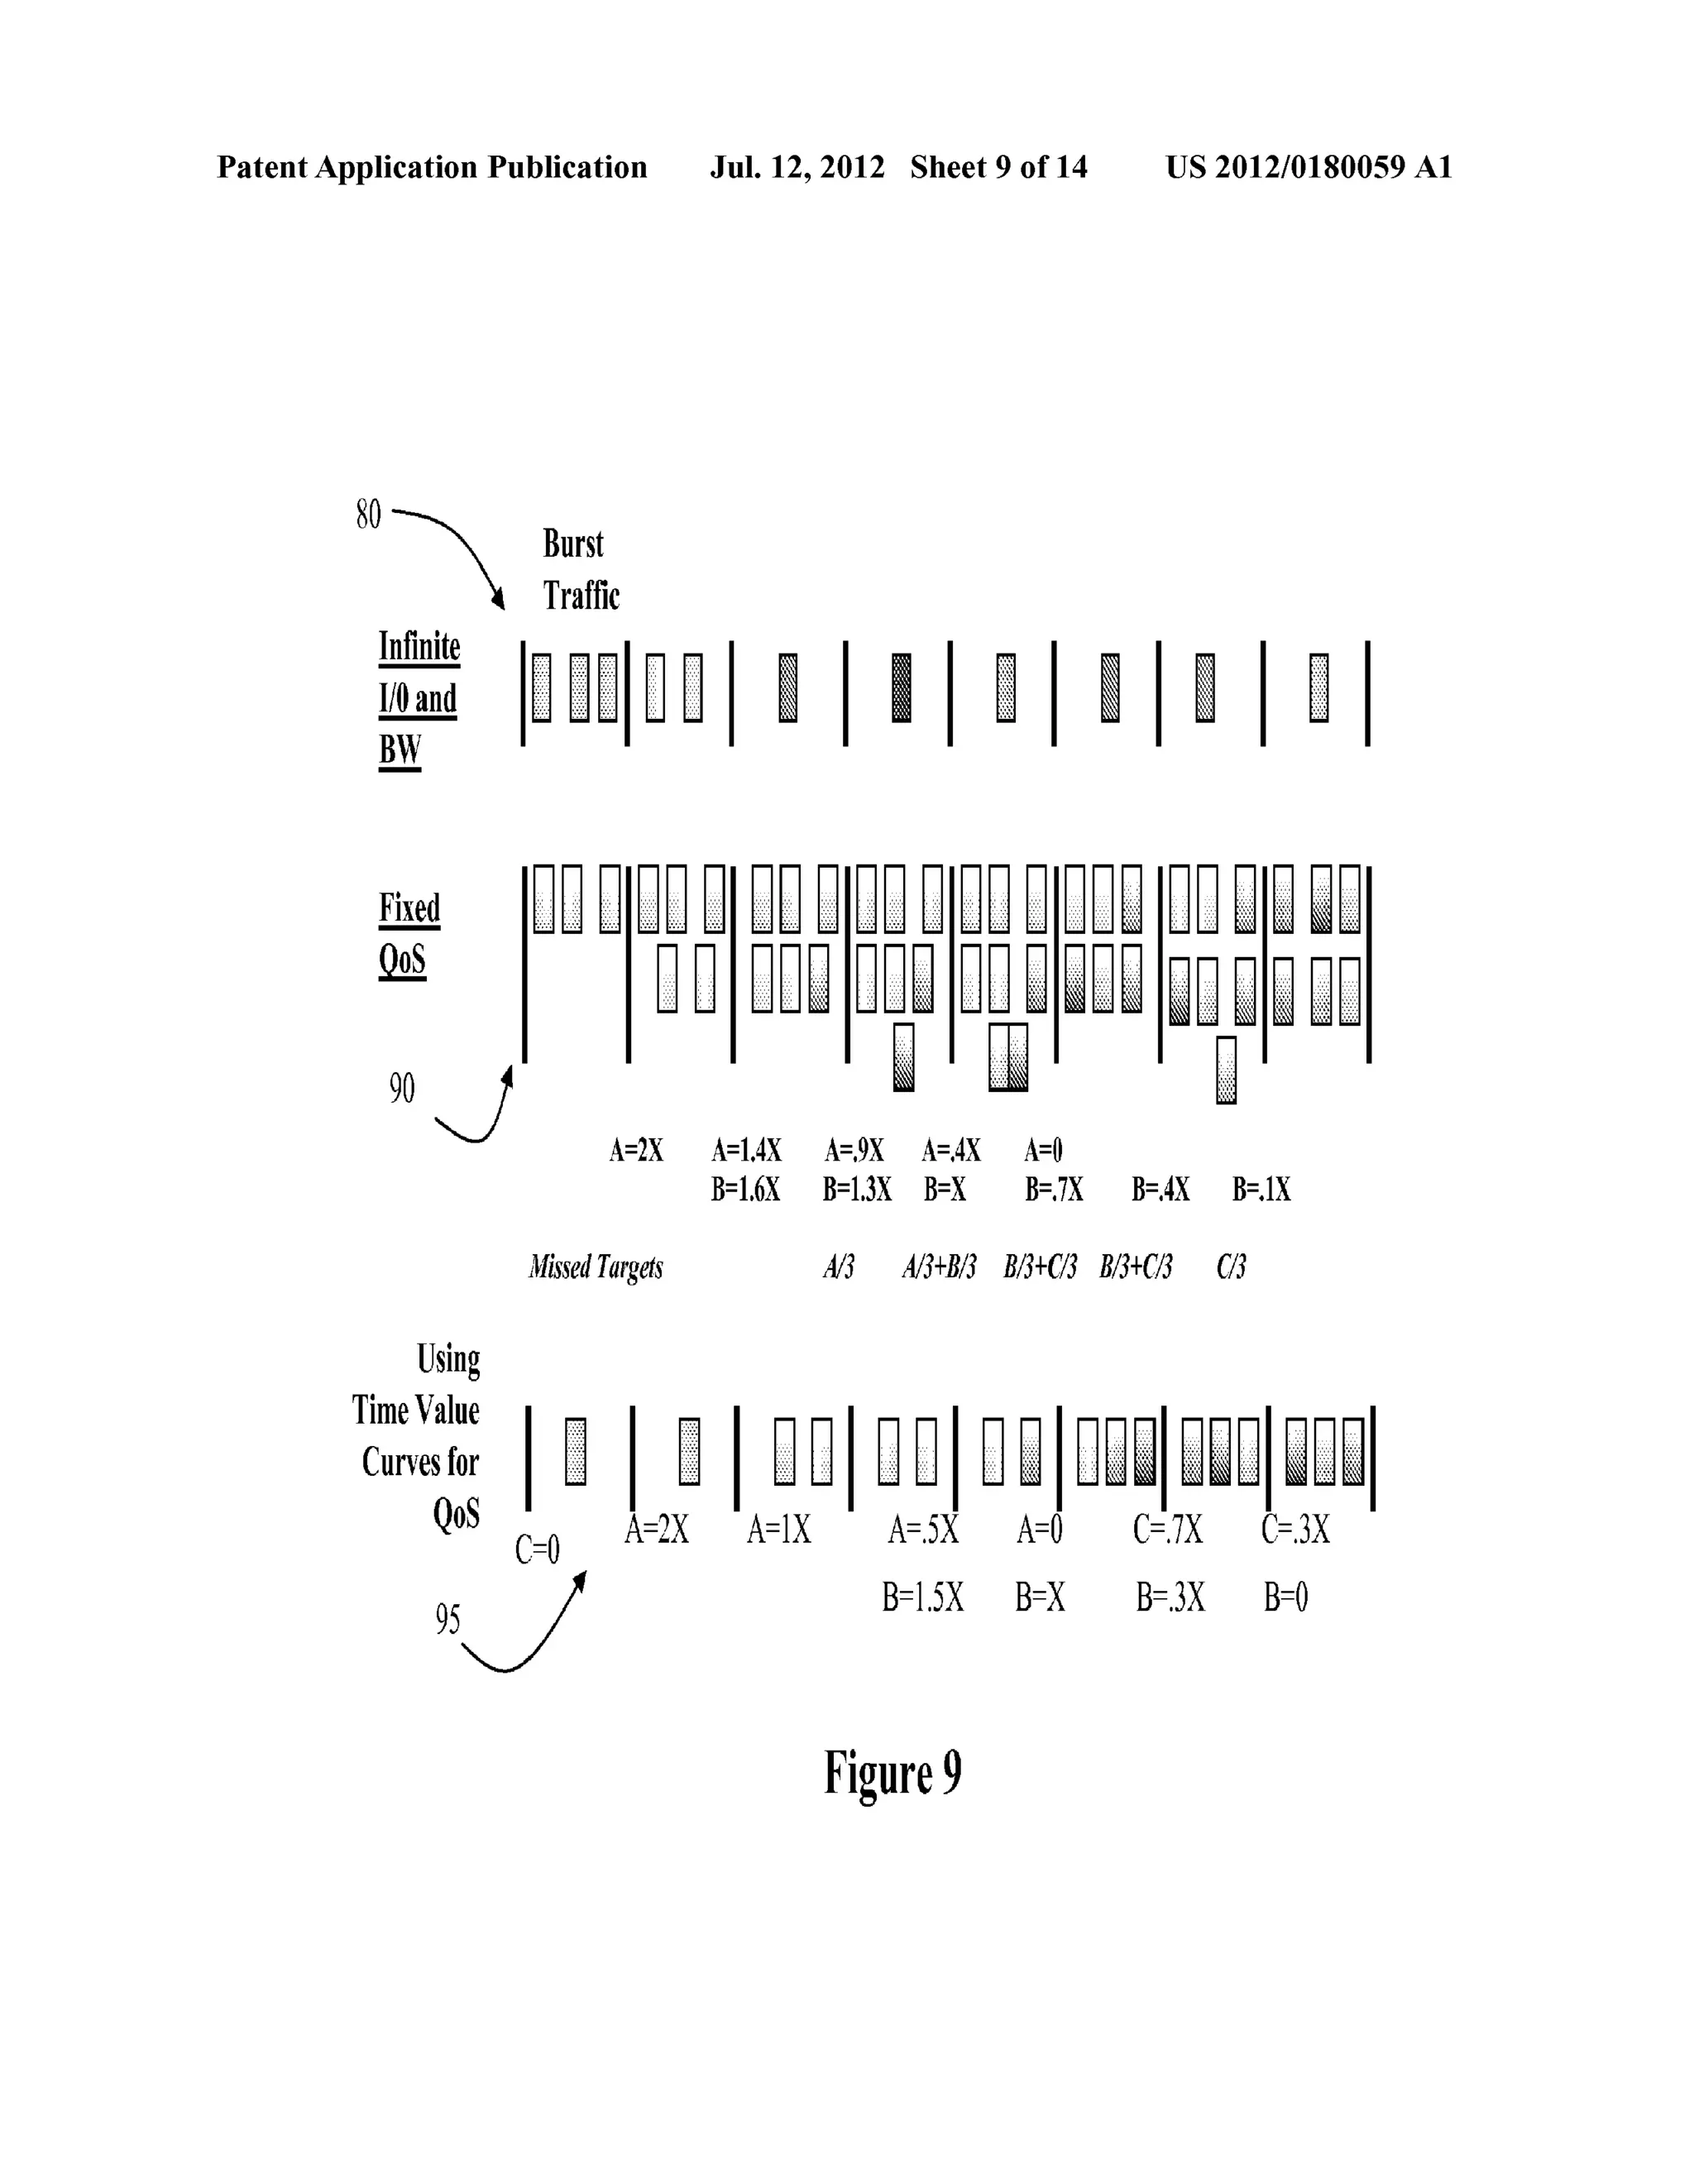
[0041] FIG. 9 is a data How diagram intuitively illustrating
the bene?ts of using the time-value curves of the present
invention to provide real-time temporally prioritized resource
allocation in to mission tasks. As Will be seen from the beloW
description, the time-value curves effectively smooth and
optimiZe resource allocation among the tasks. Optimizing the
resource allocation improves the completion rate of mission
tasks and increases the chances of mission success.
[0042] Data series 80 illustrates a stream of resource
requests that are received in a data stream. The performance
of the mission depends upon being able to process each task
in the data stream during its lifetime; if tasks are dropped or
delayed, mission information is lost. In FIG. 9, each data slot
represents a one minute interval, and assume that the Burst
traf?c received in interval 1 includes high, medium and loW
priority tasks having respective lifetimes of three, four and
?ve minutes.
[0043] Data How 90 illustrates an exemplary result of
resource allocation for a mission using Fixed QoS resource
allocation methods. In a typical Fixed QoS resource alloca
tion method, a ?xed bandWidth percentage is allocated to
each task. During interval 1 of Data How 90, Burst Tra?ic for
three tasks is received. The prior art resource allocator, receiv
ing no information from the ?eld regarding a temporal prior
ity of the tasks, uses a Fixed QoS to allocate resources to the
tasks. Each of the three tasks is provided one third of the
bandWidth. At the end of interval 1 (or one minute into the
task), each of the three pending tasks in group A is 1/3 com
plete. During interval 2, an additional task group B is received
Which includes tWo additional tasks. Assume group B
includes a medium and high priority task With respective
lifetimes of four and ?ve minutes . . . . During interval 2 the
resource allocator allocates the resource equally among the
tasks in group A and group B, providing one ?fth of the](https://image.slidesharecdn.com/us20120180059-141031122951-conversion-gate01/75/Time-value-curves-to-provide-dynamic-QoS-for-time-sensitive-file-transfers-18-2048.jpg)
![US 2012/0180059 A1
bandwidth to each task. The Fixed QoS structure has no way
to determine which task is temporally more important due to
conditions in the ?eld. After two minutes, the tasks in group A
are now just over half completed. During interval 3, an addi
tional task is received, and each task in interval 3 is assigned
one sixth of the bandwidth. At the end of three minutes the
high priority task of group A is dropped. Using the example of
FIG. 8A, this would equate with tasks initiated for individuals
in DS3 failing to complete before the individual had left the
radius.
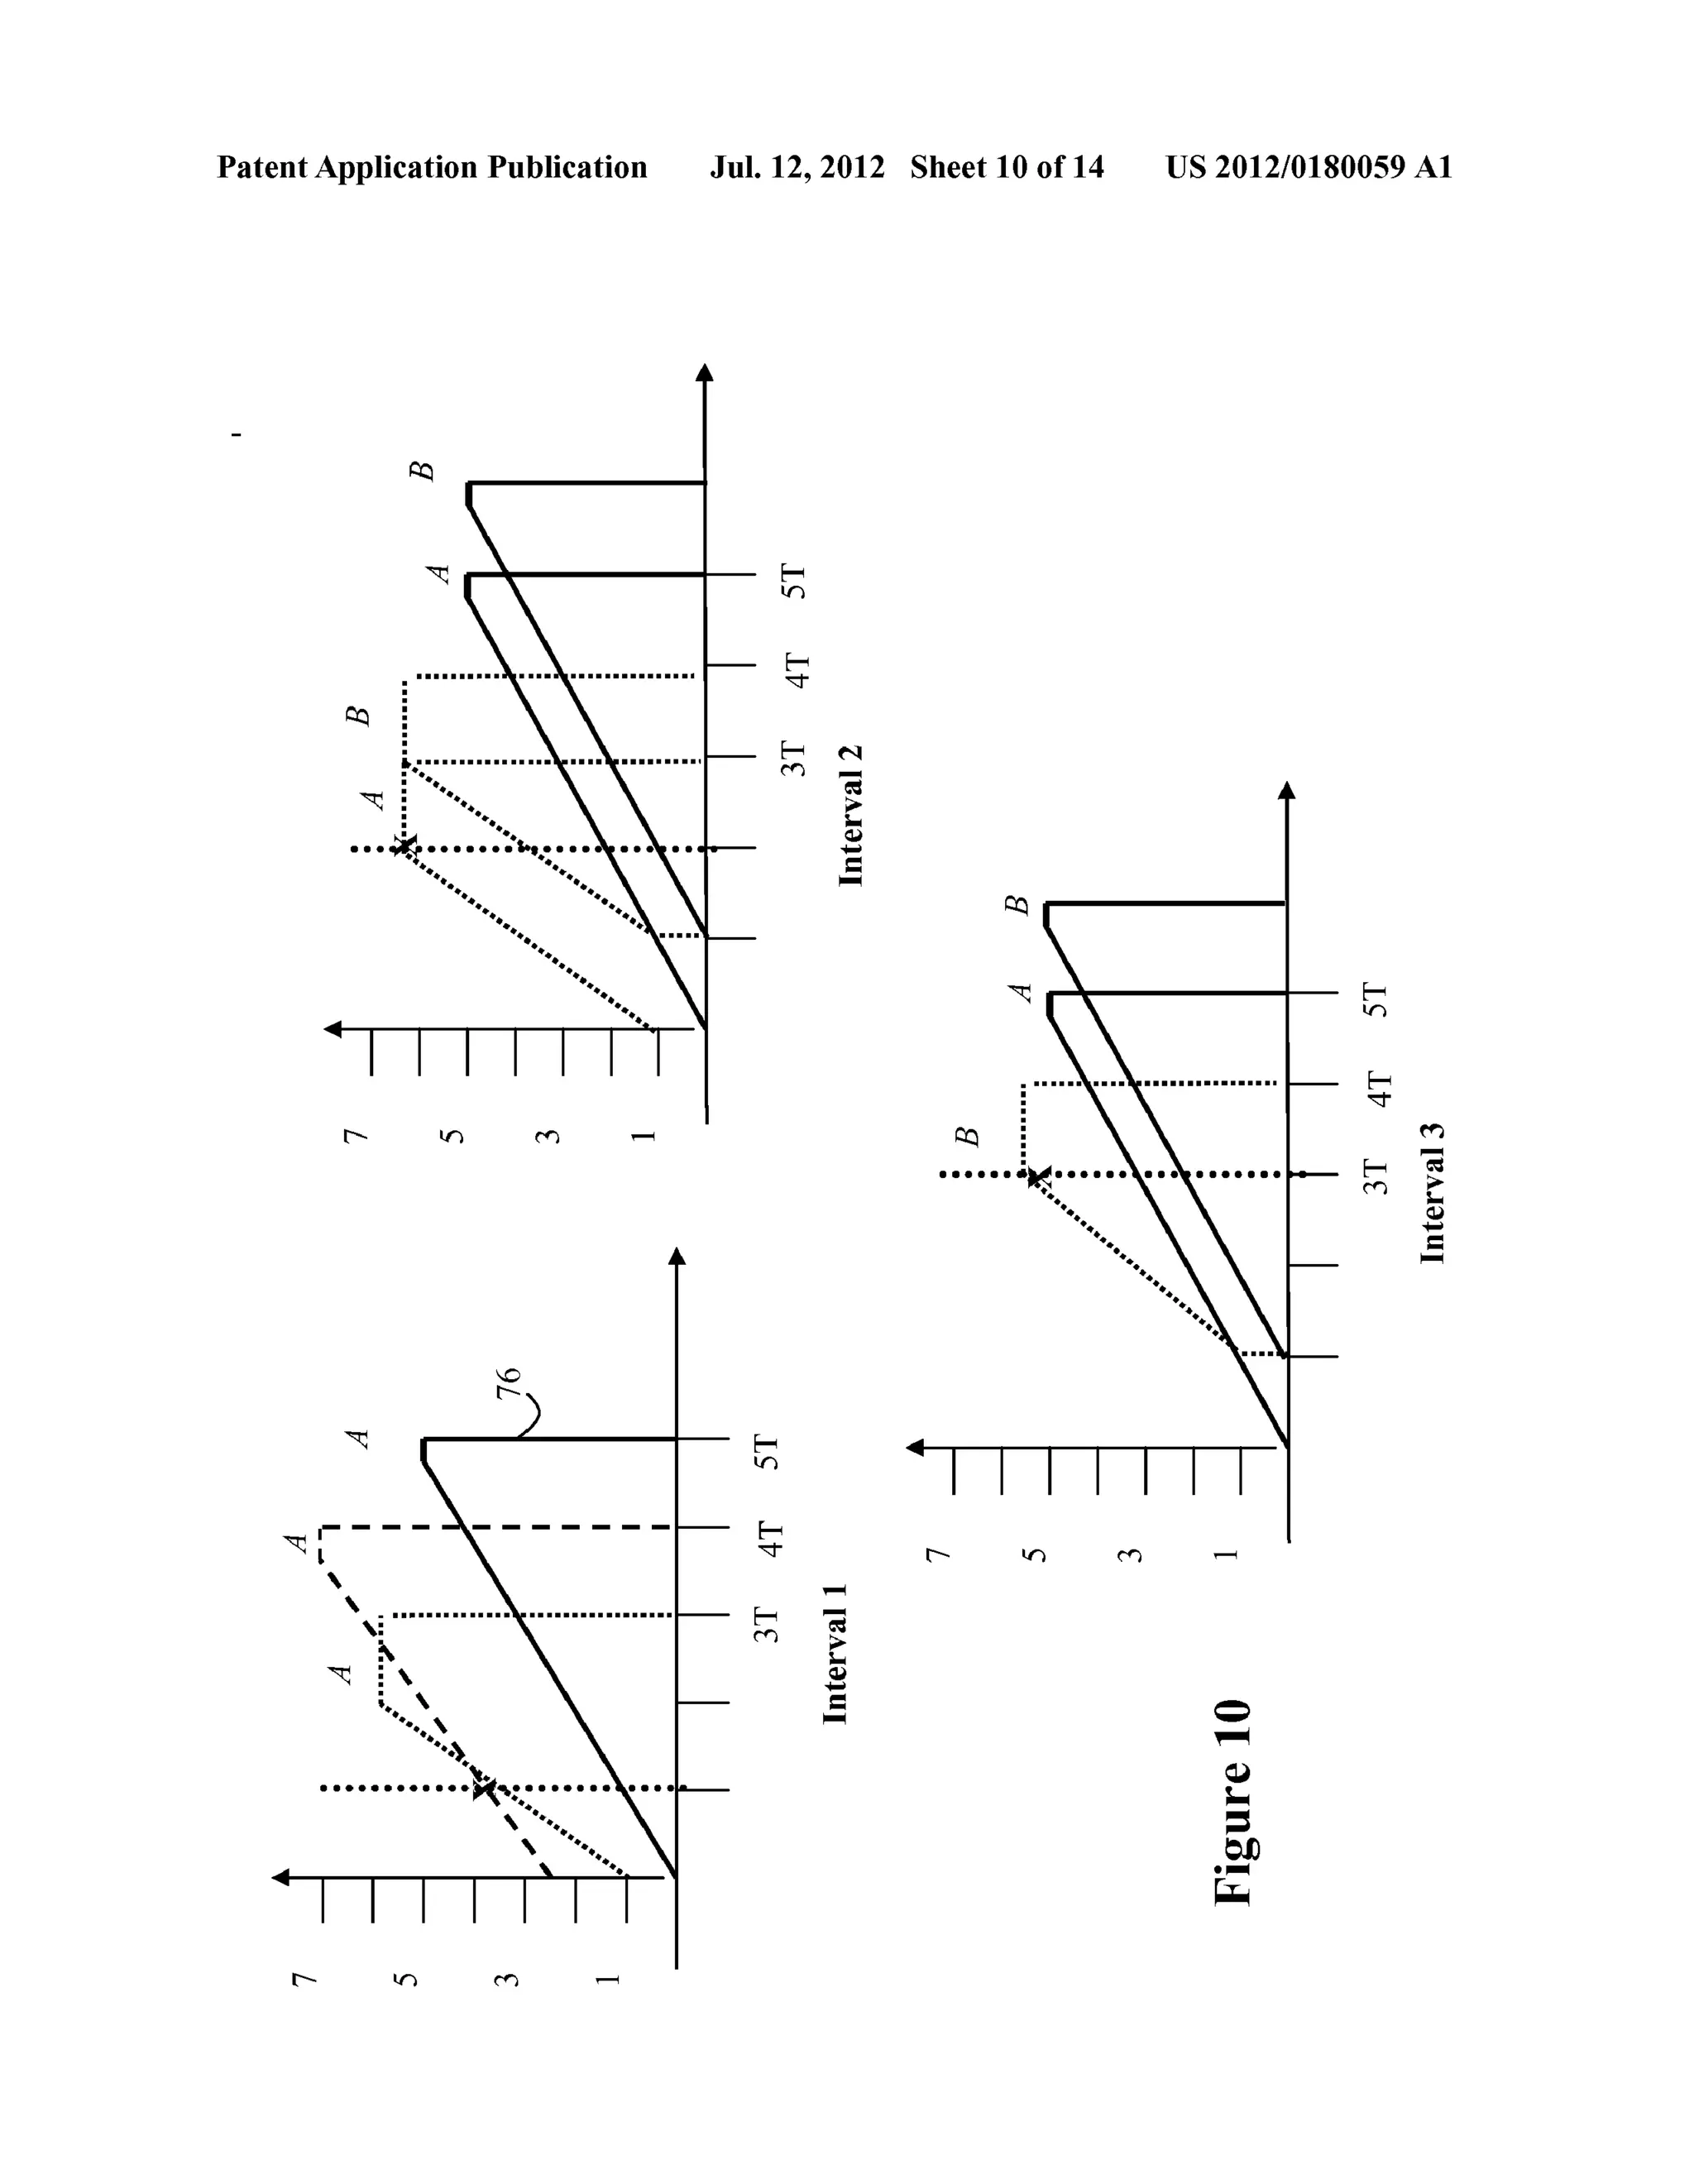
[0044] In contrast, when time value curves are applied to
the QoS paradigm, resource allocation would proceed as is
shown by data ?ow 95; FIG. 10 is a pictorial representation of
the time-value curves per task for the data ?ow of FIG. 9.
During interval 1, when burst task setA is received a resource
allocator of the present invention compares the time-value
curves of each task to identify the task with temporal priority.
As shown in FIG. 10, during interval 1 the high level task is
given control of the resource. During interval 2, new tasks are
added. However, during time interval 2 the time value curve
of the mid-range task of task group A has temporal priority.
Thus the mid-level task of group A is completed at two min
utes. At interval 3, at least a portion of the mid-level task of
group B is allocated access to the resource. Thus it can be seen
that integrating time value curves into the policy and quality
of service enforcement decisions increases the completion
rate of high value tasks.
[0045] Time-value curves can also used to identify tasks
that may not successfully complete in their lifetime. These
tasks are hereinafter referred to as stalled tasks. Identifying
stalled tasks allows them to be removed from resource allo
cation consideration, thereby reducing performance and pro
viding a graceful degradation of performance in the face of
congestion.
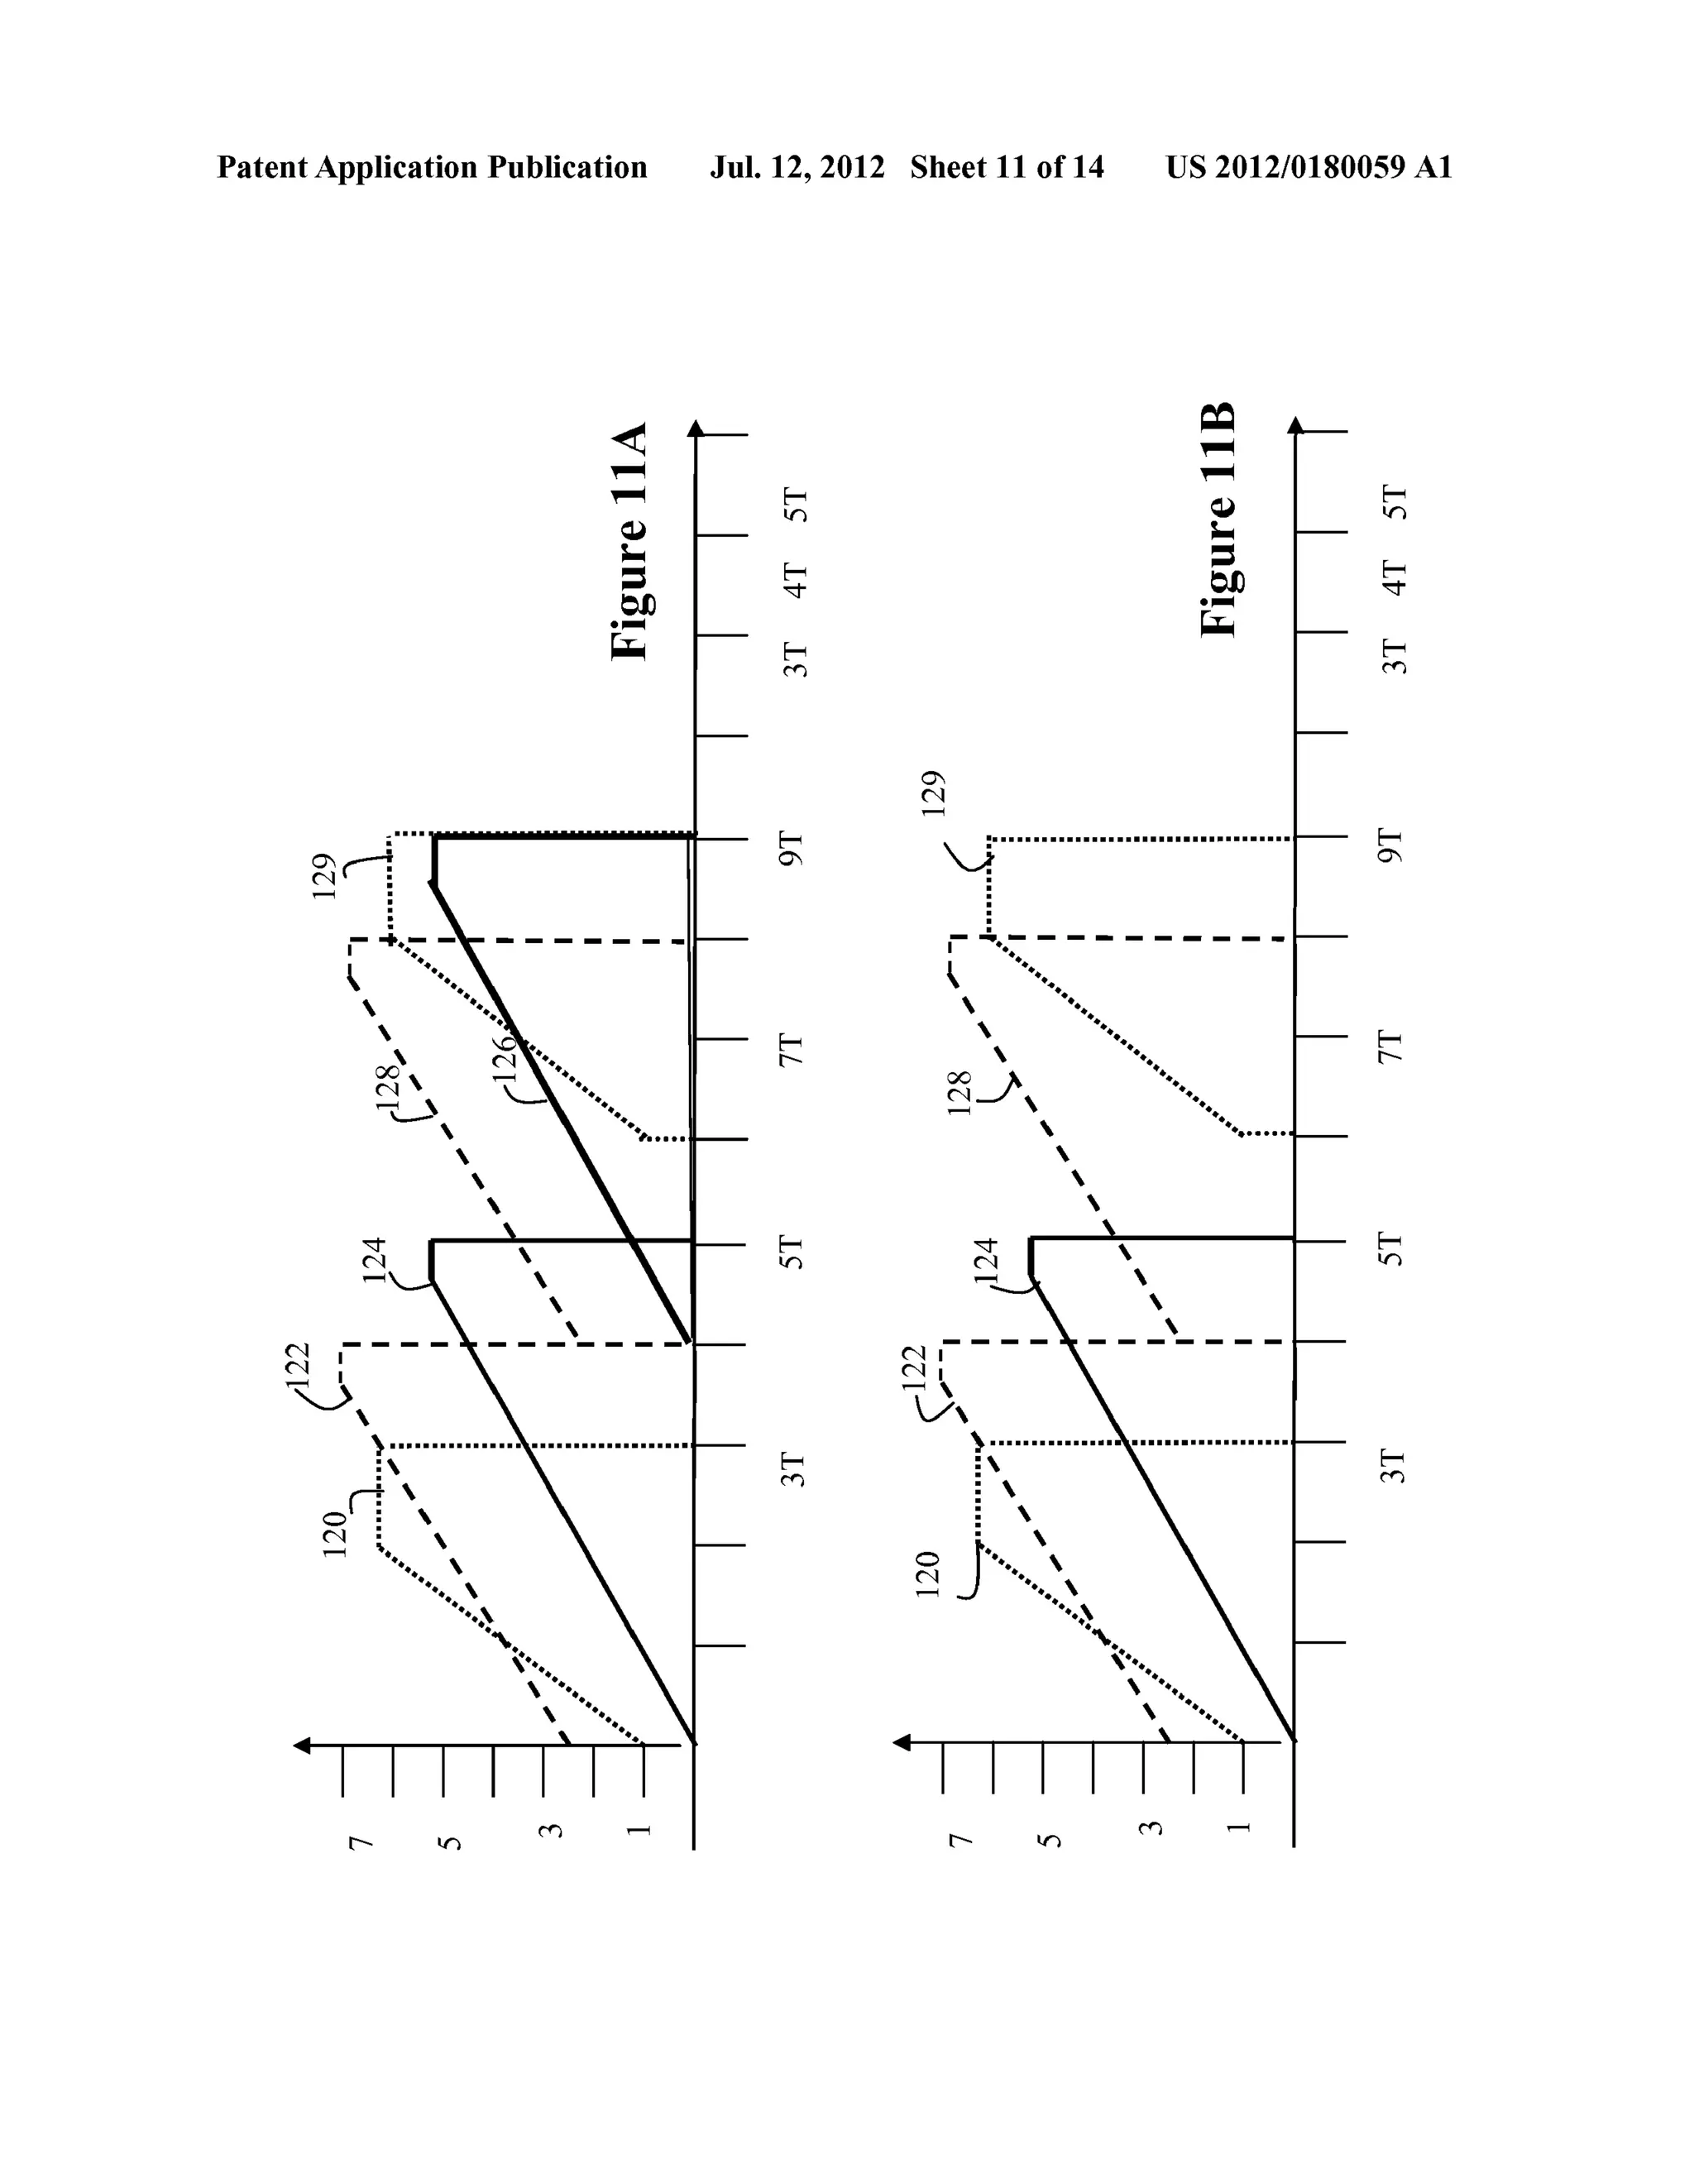
[0046] FIG. 11A illustrates how dynamic time-value curve
analysis may be used to identify stalled tasks. In FIG. 11A,
task 126 is initiated at time. However, given the temporal
priorities of the other tasks in the work?ow, it is unlikely that
the low priority task 129 will be able to complete in its
lifetime. In the present invention, the Execution Manager
identi?es stalled ?ows and removes them from the task queue,
thereby simplifying the decision making process of the EM
and reducing congestion. FIG. 11B is a pictorial representa
tion of the time-value curves that are under consideration
following the abortion of the stalled task.
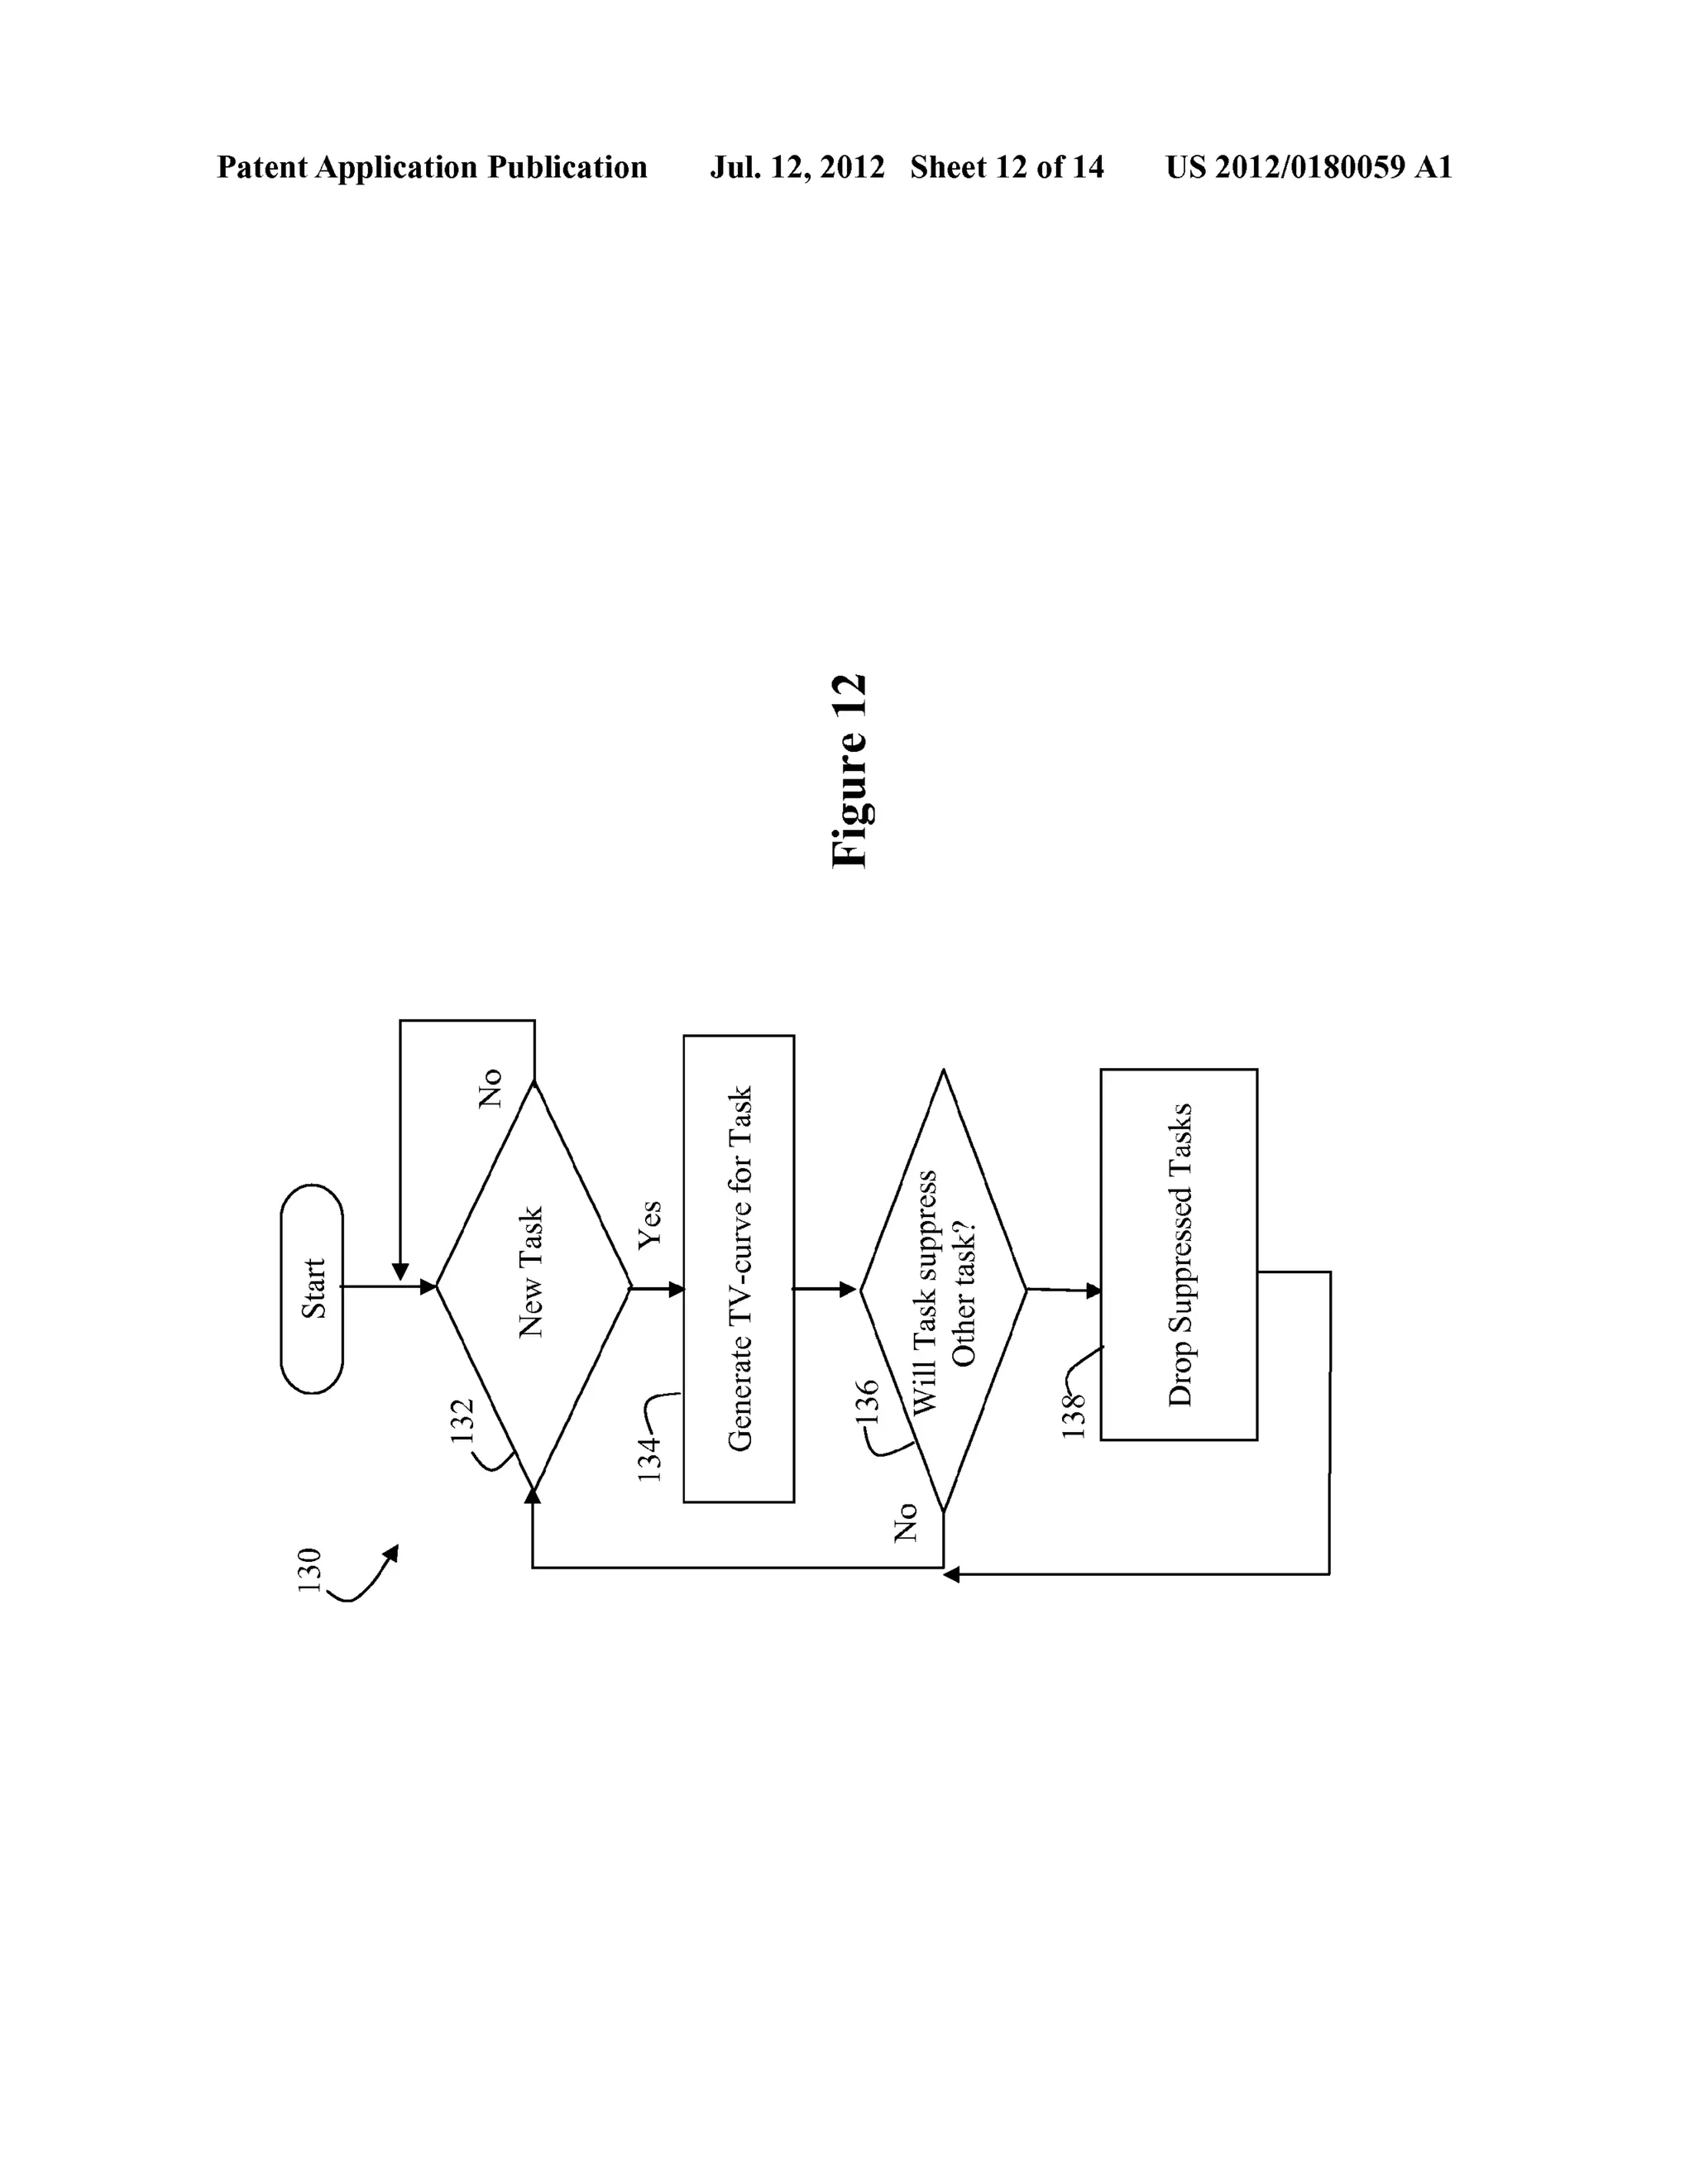
[0047] FIG. 12 is a ?ow diagram illustrating several exem
plary steps that may be performed by an Execution Manager
or other resource allocator, to drop task execution using time
value curve information of the present invention. At steps 132
and 134 a time value curve is generated for each new task as
described with regards to FIGS. 2-4. At step 136 it is deter
mined whether the added task is going to result in the stalling
of an existing task. If so, at step 138 the stalled task is removed
from the task queue.
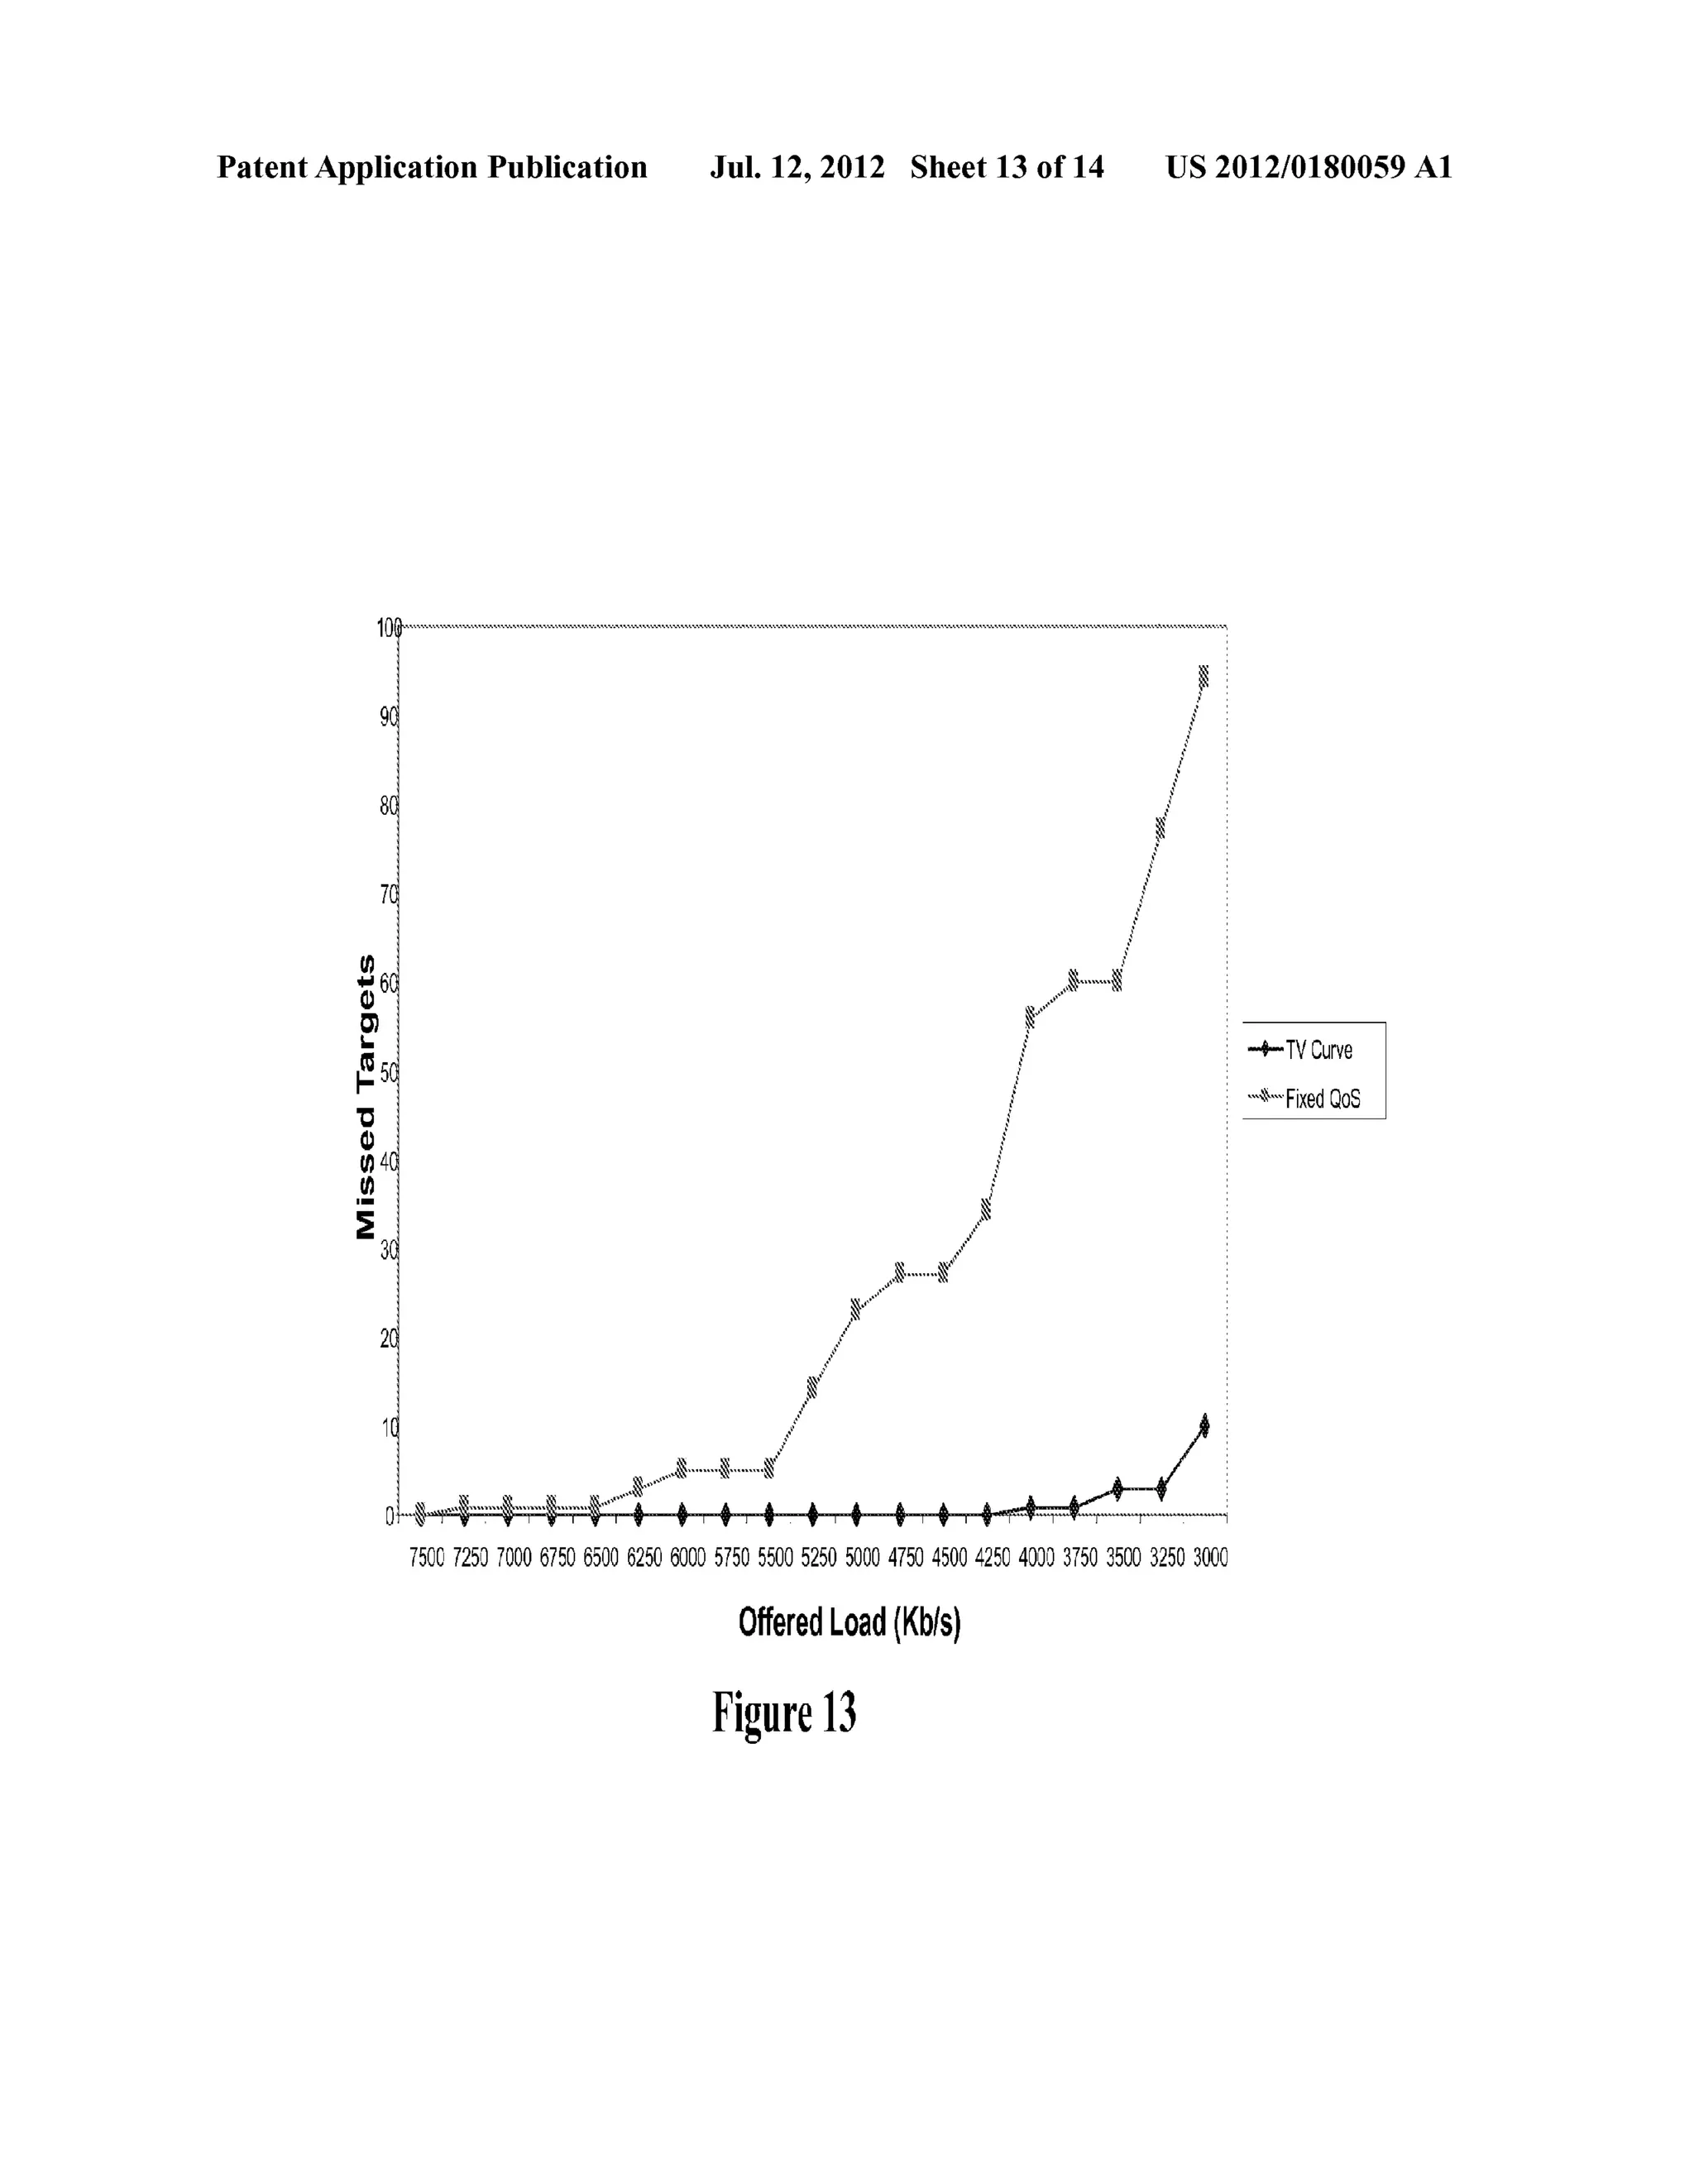
[0048] FIG. 13 is a graph that is provided to illustrate the
performance of a TV QoS system versus that of a ?xed QoS
as the offered load increases. As shown in FIG. 13, the num
ber of missed targets increases linearly with the increase in
load. In contrast, the TV QoS does not begin to drop targets
until the average tra?ic approaches the offered load (as indi
cated by the dashed line X in FIG. 13).
[0049] FIG. 14 is a graph that is provided to illustrate the
graceful performance degradation that can be realiZed in a
network which implements time-value curves of the present
Jul. 12, 2012
invention to abort stalled queues. As the siZe of the packet
payload is reduced the frequency of resource accesses is
increased. Once the offered load is less than the average
traf?c, resource congestion quickly ensues, and data stream
are dropped. The present invention uses time-value curves to
identify the most temporally relevant tasks even during con
gestion, thereby resulting in graceful network performance
degradation in the face of congestion as shown in FIG. 13.
[0050] Accordingly a method and apparatus has been
shown and described which allows Quality of Service to be
controlled at a temporal granularity. Time-value curves, gen
erated for each task, ensure that mission resources are utiliZed
in a manner which optimiZes mission performance. It should
be noted, however, that although the present invention has
shown and described the use of time-value curves as applied
to mission work?ow tasks, the present invention is not limited
to this application; rather, it can be readily appreciated by one
of skill in the art that time-value curves may be used to
optimiZe the delivery of any resource to any consumer by
taking into account the dynamic environment of the consumer
and resource. The allocation of any resource, including net
work bandwidth, storage, processing capability, etc., may
bene?t from the teachings of the present invention.
[0051] Having described various embodiments of the
invention, it will be appreciated that many of the above ?gures
are ?owchart illustrations of methods, apparatus (systems)
and computer program products according to an embodiment
of the invention. It will be understood that each block of the
?owchart illustrations, and combinations of blocks in the
?owchart illustrations, can be implemented by computer pro
gram instructions. These computer program instructions may
be loaded onto a computer or other programmable data pro
cessing apparatus to produce a machine, such that the instruc
tions which execute on the computer or other programmable
data processing apparatus create means for implementing the
functions speci?ed in the ?owchart block or blocks. These
computer program instructions may also be stored in a com
puter-readable memory that can direct a computer or other
programmable data processing apparatus to function in a
particular manner, such that the instructions stored in the
computer-readable memory produce an article of manufac
ture including instruction means which implement the func
tion speci?ed in the ?owchart block or blocks. The computer
program instructions may also be loaded onto a computer or
other programmable data processing apparatus to cause a
series of operational steps to be performed on the computer or
other programmable apparatus to produce a computer imple
mented process such that the instructions which execute on
the computer or other programmable apparatus provide steps
for implementing the functions speci?ed in the ?owchart
block or blocks.
[0052] Those skilled in the art should readily appreciate
that programs de?ning the functions of the present invention
can be delivered to a computer in many forms; including, but
not limited to: (a) information permanently stored on non
writable storage media (e. g. read only memory devices within
a computer such as ROM or CD-ROM disks readable by a
computer I/O attachment); (b) information alterably stored on
writable storage media (e. g. ?oppy disks and hard drives); or
(c) information conveyed to a computer through communi
cation media for example using baseband signaling or broad
band signaling techniques, including carrier wave signaling
techniques, such as over computer or telephone networks via
a modem](https://image.slidesharecdn.com/us20120180059-141031122951-conversion-gate01/75/Time-value-curves-to-provide-dynamic-QoS-for-time-sensitive-file-transfers-19-2048.jpg)
![US 2012/0180059 A1
[0053] The above description and ?gures have included
various process steps and components that are illustrative of
operations that are performed by the present invention. These
components may be implemented in hardware, software or a
combination thereof. However, although certain components
and steps have been described, it is understood that the
descriptions are representative only, other functional delinea
tions or additional steps and components can be added by one
of skill in the art, and thus the present invention should not be
limited to the speci?c embodiments disclosed. In addition it is
understood that the various representational elements may be
implemented in hardware, software running on a computer, or
a combination thereof.
[0054] While the invention is described through the above
exemplary embodiments, it will be understood by those of
ordinary skill in the art that modi?cation to and variation of
the illustrated embodiments may be made without departing
from the inventive concepts herein disclosed. Accordingly,
the invention should not be viewed as limited except by the
scope and spirit of the appended claims.
1. A method of allocating at least one network resource
among a plurality of tasks, each task having a respective
priority that is a function of time, the method comprising:
over each of a plurality of time intervals, allocating the at
least one network resource based on relative values of
the respective priorities over each of the plurality of time
intervals.
2. The method of claim 1, wherein allocating the at least
one network resource based on relative values of the respec
tive priorities over each of the plurality of time intervals
comprises allocating the at least one network resource over
each respective time interval of the plurality of time intervals
having a highest priority value over that respective time inter
val.
3. The method of claim 1, wherein allocating the at least
one network resource based on relative values of the respec
tive priorities over the plurality of time intervals comprises
allocating the at least one network resource over each respec
tive time interval of the plurality of time intervals to the
plurality of tasks in proportion to their respective priorities
over that respective time interval.
4. The method of claim 1, wherein at least one task has a
priority which is non-Zero only for a ?nite time interval.
5. The method of claim 4, wherein the ?nite time interval
extends from a start time to an end time.
6. The method of claim 4, wherein the at least one task has
a uniform priority over the ?nite time interval.
7. The method of claim 4, wherein the at least one task has
a priority which increases from a lowest value at a beginning
of the ?nite time interval to a highest value at an end of the
?nite time interval.
8. The method of claim 7, wherein the priority of the at least
one task reaches the highest value before the end of the ?nite
time interval and remains at the highest value until the end of
the ?nite time interval.
9. The method of claim 1, further comprising:
receiving via a user interface information pertaining to the
plurality of tasks; and
deriving a priority value as a function of time for each task
of the plurality of tasks from the received information
pertaining to the plurality of tasks.
10. The method of claim 9, wherein deriving a priority
value as a function of time for each task comprises modifying
Jul. 12, 2012
a generic priority function for each task based on the received
information pertaining to the plurality of tasks.
1 1. The method of claim 1, further comprising dynamically
adjusting the respective priority function of time for at least
one task in response to network conditions.
12. A system for allocating at least one network resource
among a plurality of tasks, each task having a respective
priority that is a function of time, the system comprising:
at least one processor; and
at least one memory con?gured to store instructions for
execution by the at least one processor, the instructions
comprising instructions that, when executed:
allocate, over each of a plurality of time intervals, the at
least one network resource based on relative values of
the respective priorities over each of the plurality of
time intervals.
13. The system of claim 12, wherein the instructions that,
when executed, allocate the at least one network resource
based on relative values of the respective priorities over each
of the plurality of time intervals comprise:
Instructions, that when executed, allocate the at least one
network resource over each respective time interval of
the plurality of time intervals having a highest priority
value over that respective time interval.
14. The system of claim 12, wherein the instructions that,
when executed, allocate the at least one network resource
based on relative values of the respective priorities over the
plurality of time intervals comprise:
instructions that, when executed, allocate the at least one
network resource over each respective time interval of
the plurality of time intervals to the plurality of tasks in
proportion to their respective priorities over that respec
tive time interval.
15. The system of claim 12, wherein at least one task has a
priority which is non-Zero only for a ?nite time interval.
16. The system of claim 15, wherein the ?nite time interval
extends from a start time to an end time.
17. The system of claim 15, wherein the at least one task
has a uniform priority over the ?nite time interval.
18. The system of claim 15, wherein the at least one task
has a priority which increases from a lowest value at a begin
ning of the ?nite time interval to a highest value at an end of
the ?nite time interval.
19. The system of claim 18, wherein the priority of the at
least one task reaches the highest value before the end of the
?nite time interval and remains at the highest value until the
end of the ?nite time interval.
20. The system of claim 12, wherein the instructions fur
ther comprise instructions that, when executed:
receive via a user interface information pertaining to the
plurality of tasks; and
derive a priority value as a function of time for each task of
the plurality of tasks from the received information per
taining to the plurality of tasks.
21. The system of claim 20, wherein the instructions that,
when executed, derive a priority value as a function of time
for each task include instructions that, when executed, modify
a generic priority function for each task based on the received
information pertaining to the plurality of tasks.
22. The system of claim 12, wherein the instructions fur
ther comprise instructions that, when executed, dynamically
adjust the respective priority function of time for at least one
task in response to network conditions.
* * * * *](https://image.slidesharecdn.com/us20120180059-141031122951-conversion-gate01/75/Time-value-curves-to-provide-dynamic-QoS-for-time-sensitive-file-transfers-20-2048.jpg)

The document outlines a patent application for a method and apparatus that optimizes resource allocation in dynamic environments using time-value curves. This method allows for the control of quality of service for resource consumers, such as communication bandwidth for mission tasks, thereby improving mission performance. It discusses various aspects of the invention, including the generation of time-value curves, their application in resource management, and the components of an engine designed to leverage these curves.