Download as PDF, PPTX


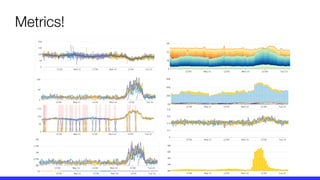
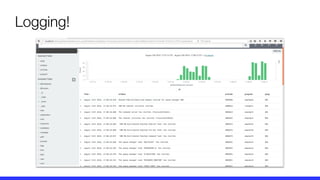
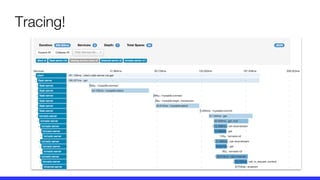


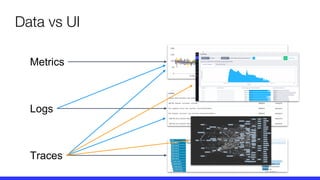


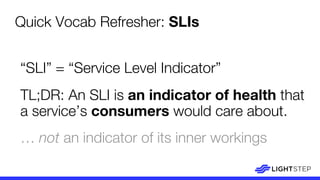
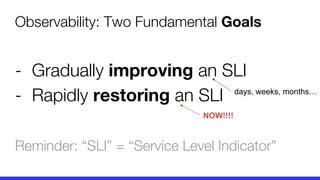

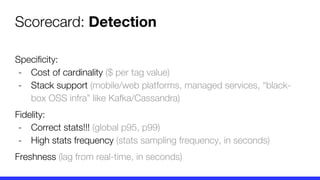
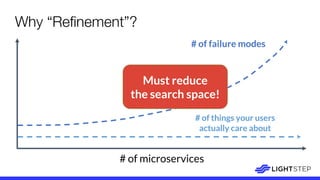
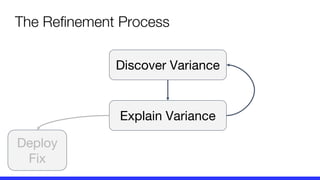


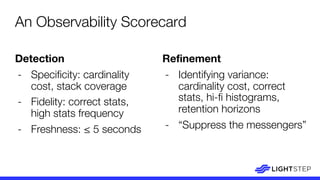


The document presents a critique on the observability of microservices, highlighting the limitations of traditional approaches involving metrics, logging, and distributed tracing. It introduces a new scorecard for observability, focusing on service level indicators (SLIs) as critical metrics and emphasizes the need for precise detection and effective refinement to improve service performance. The document concludes with guidelines for designing an optimal observability system while addressing overhead and data retention challenges.