Download as PDF, PPTX


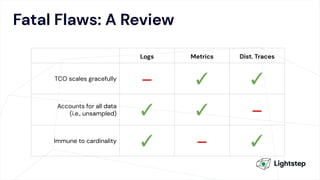


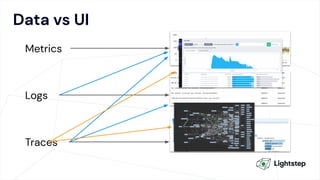


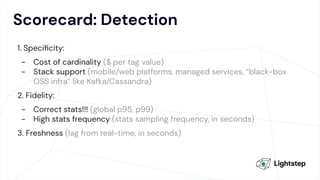
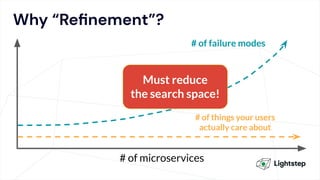
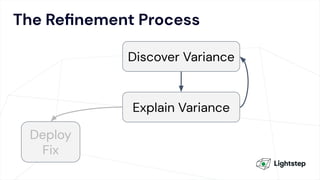
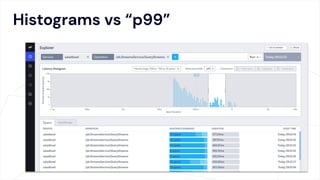


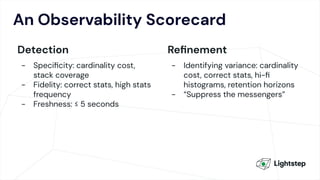


The document critiques conventional approaches to observability in microservices, highlighting flaws in the reliance on metrics, logs, and distributed tracing. It provides a new scorecard for evaluating observability that includes detection and refinement activities focused on service level indicators (SLIs) and their consumer perceptions. Ultimately, it emphasizes the need for high specificity, fidelity, and freshness in observability data while proposing a context-rich and real-time approach to refining performance measurements.