Download to read offline

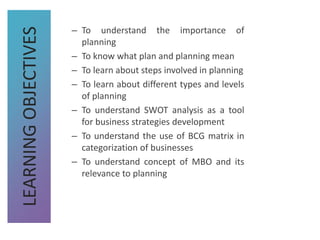
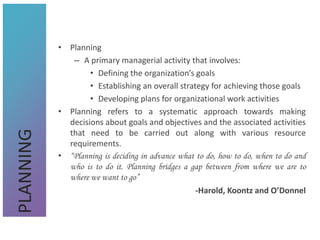


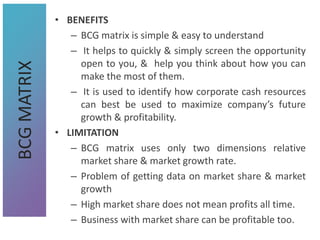

This document discusses planning and provides information on: 1) The definition and importance of planning as a managerial activity involving defining goals, strategies, and plans. 2) The purposes of planning which include providing direction, reducing uncertainty, and facilitating control. 3) Tools that can be used in planning like SWOT analysis, BCG matrix, and goal setting. 4) The relationship between planning and organizational performance, and factors that influence planning choices.