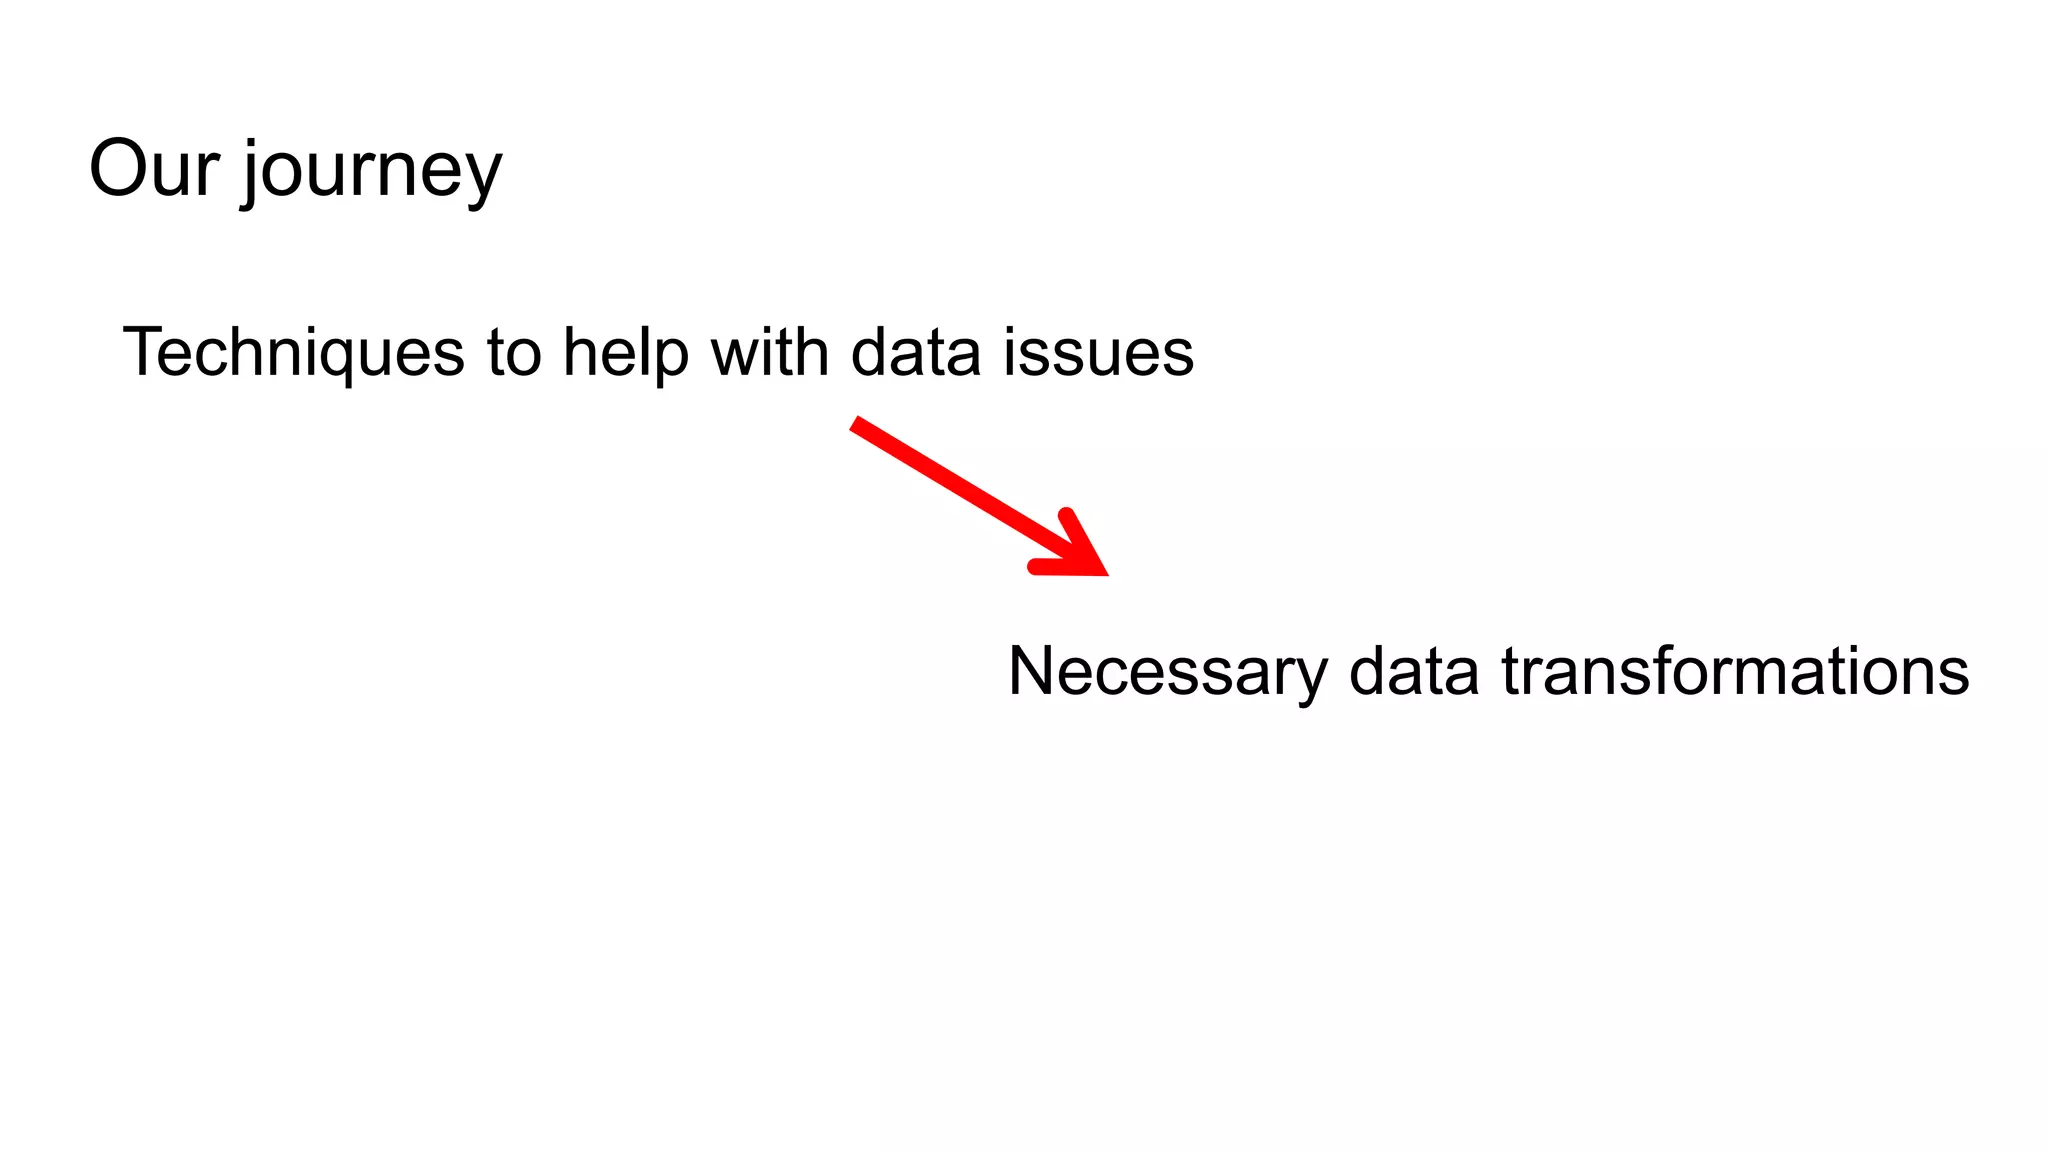
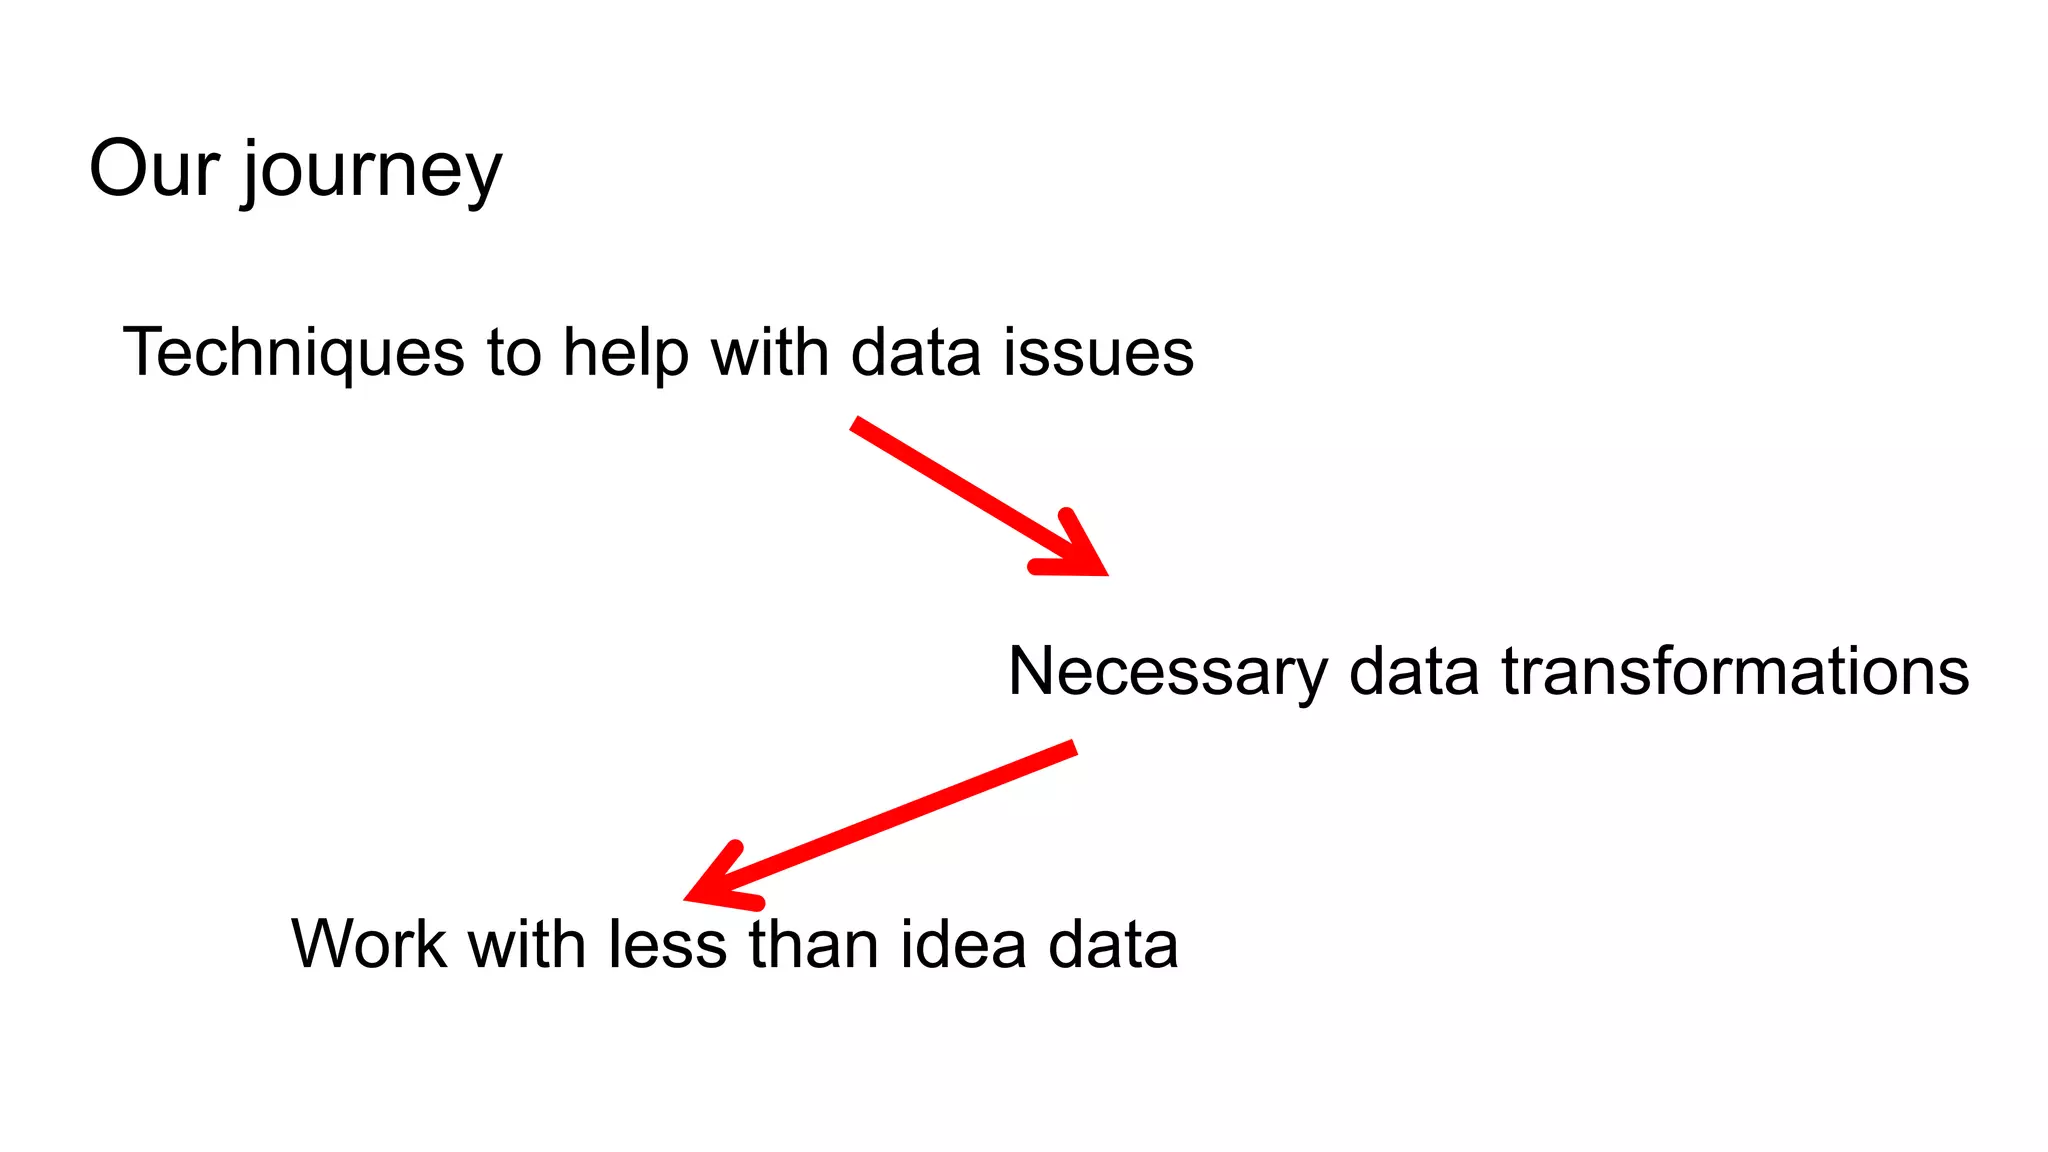
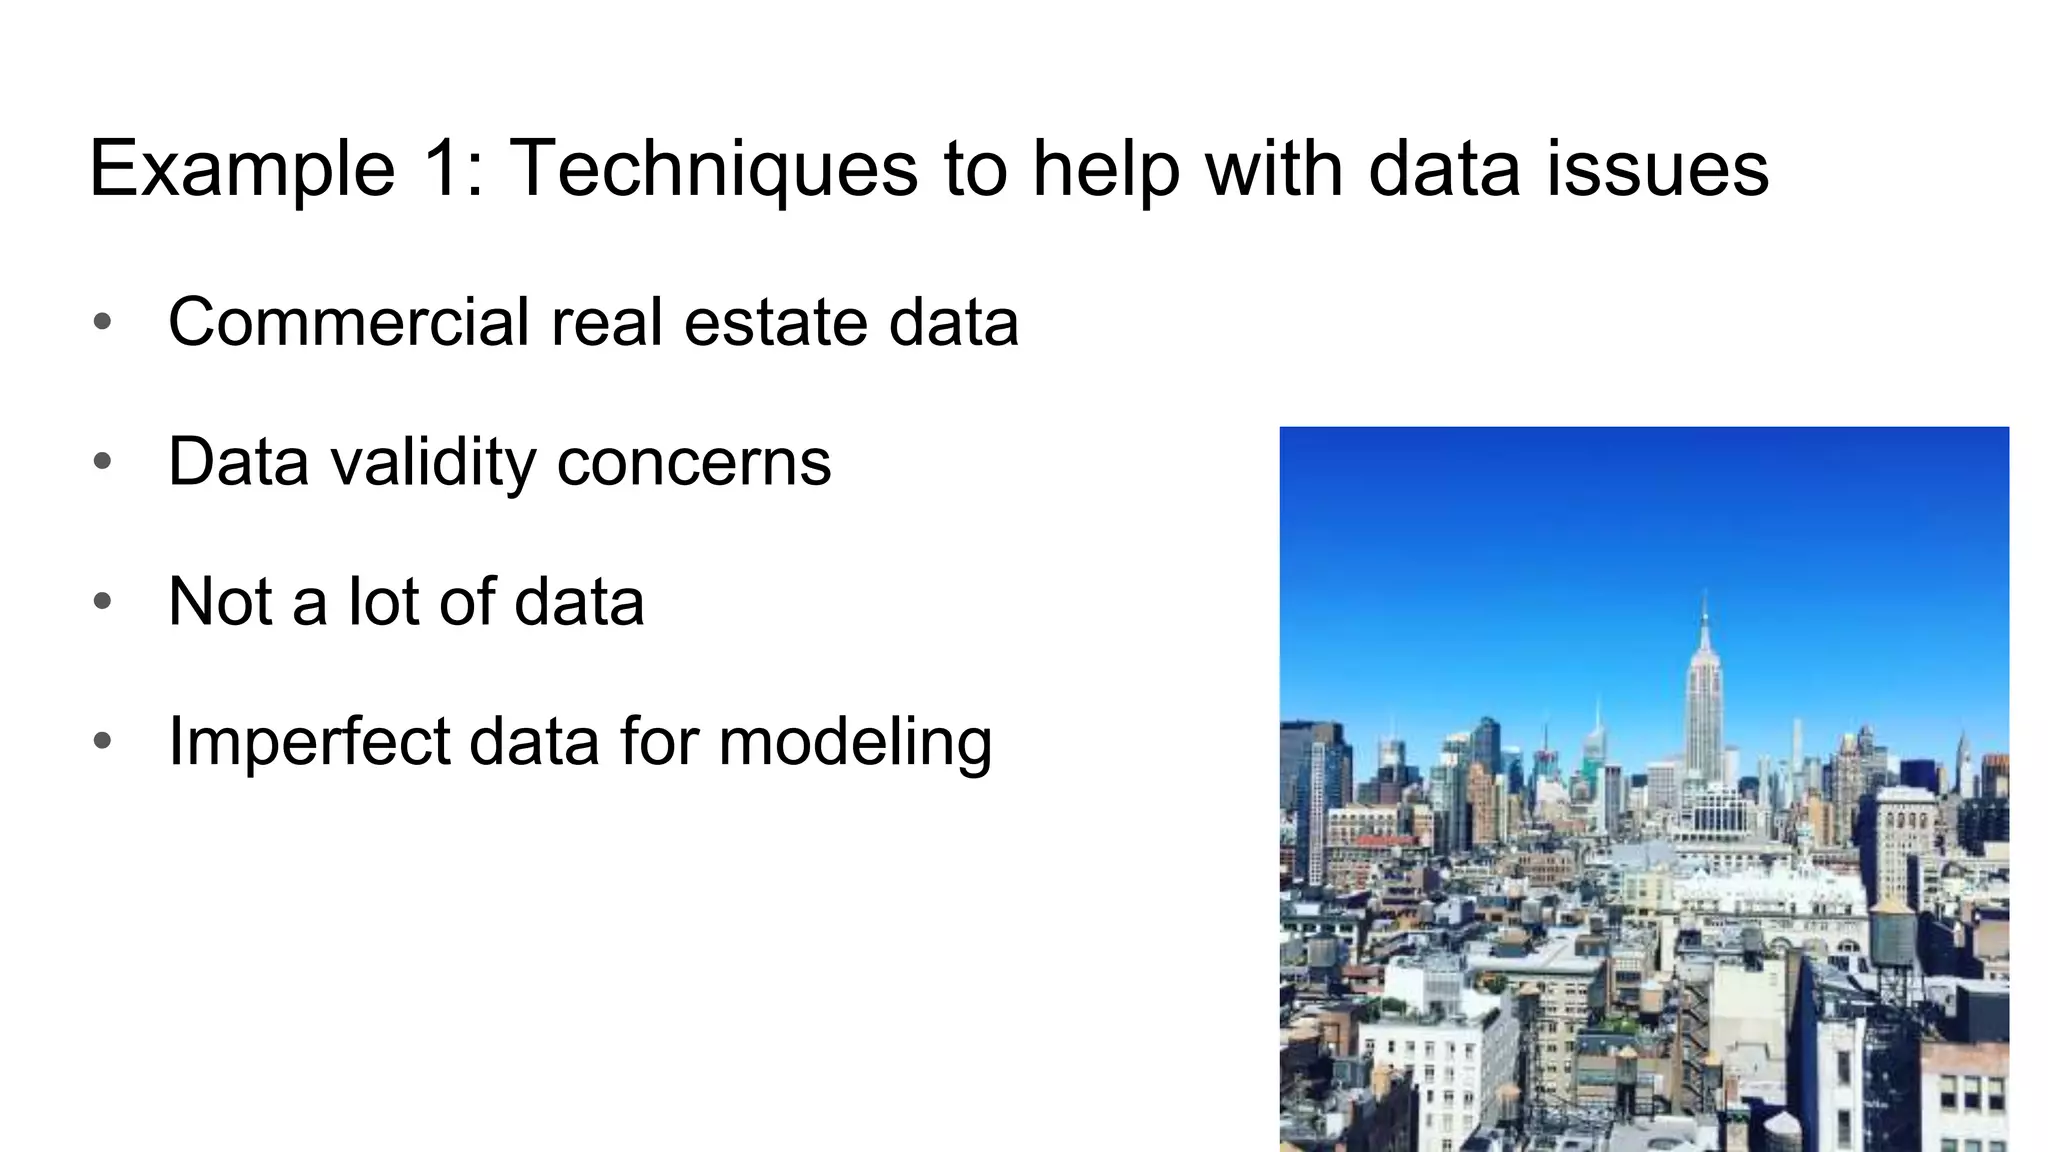
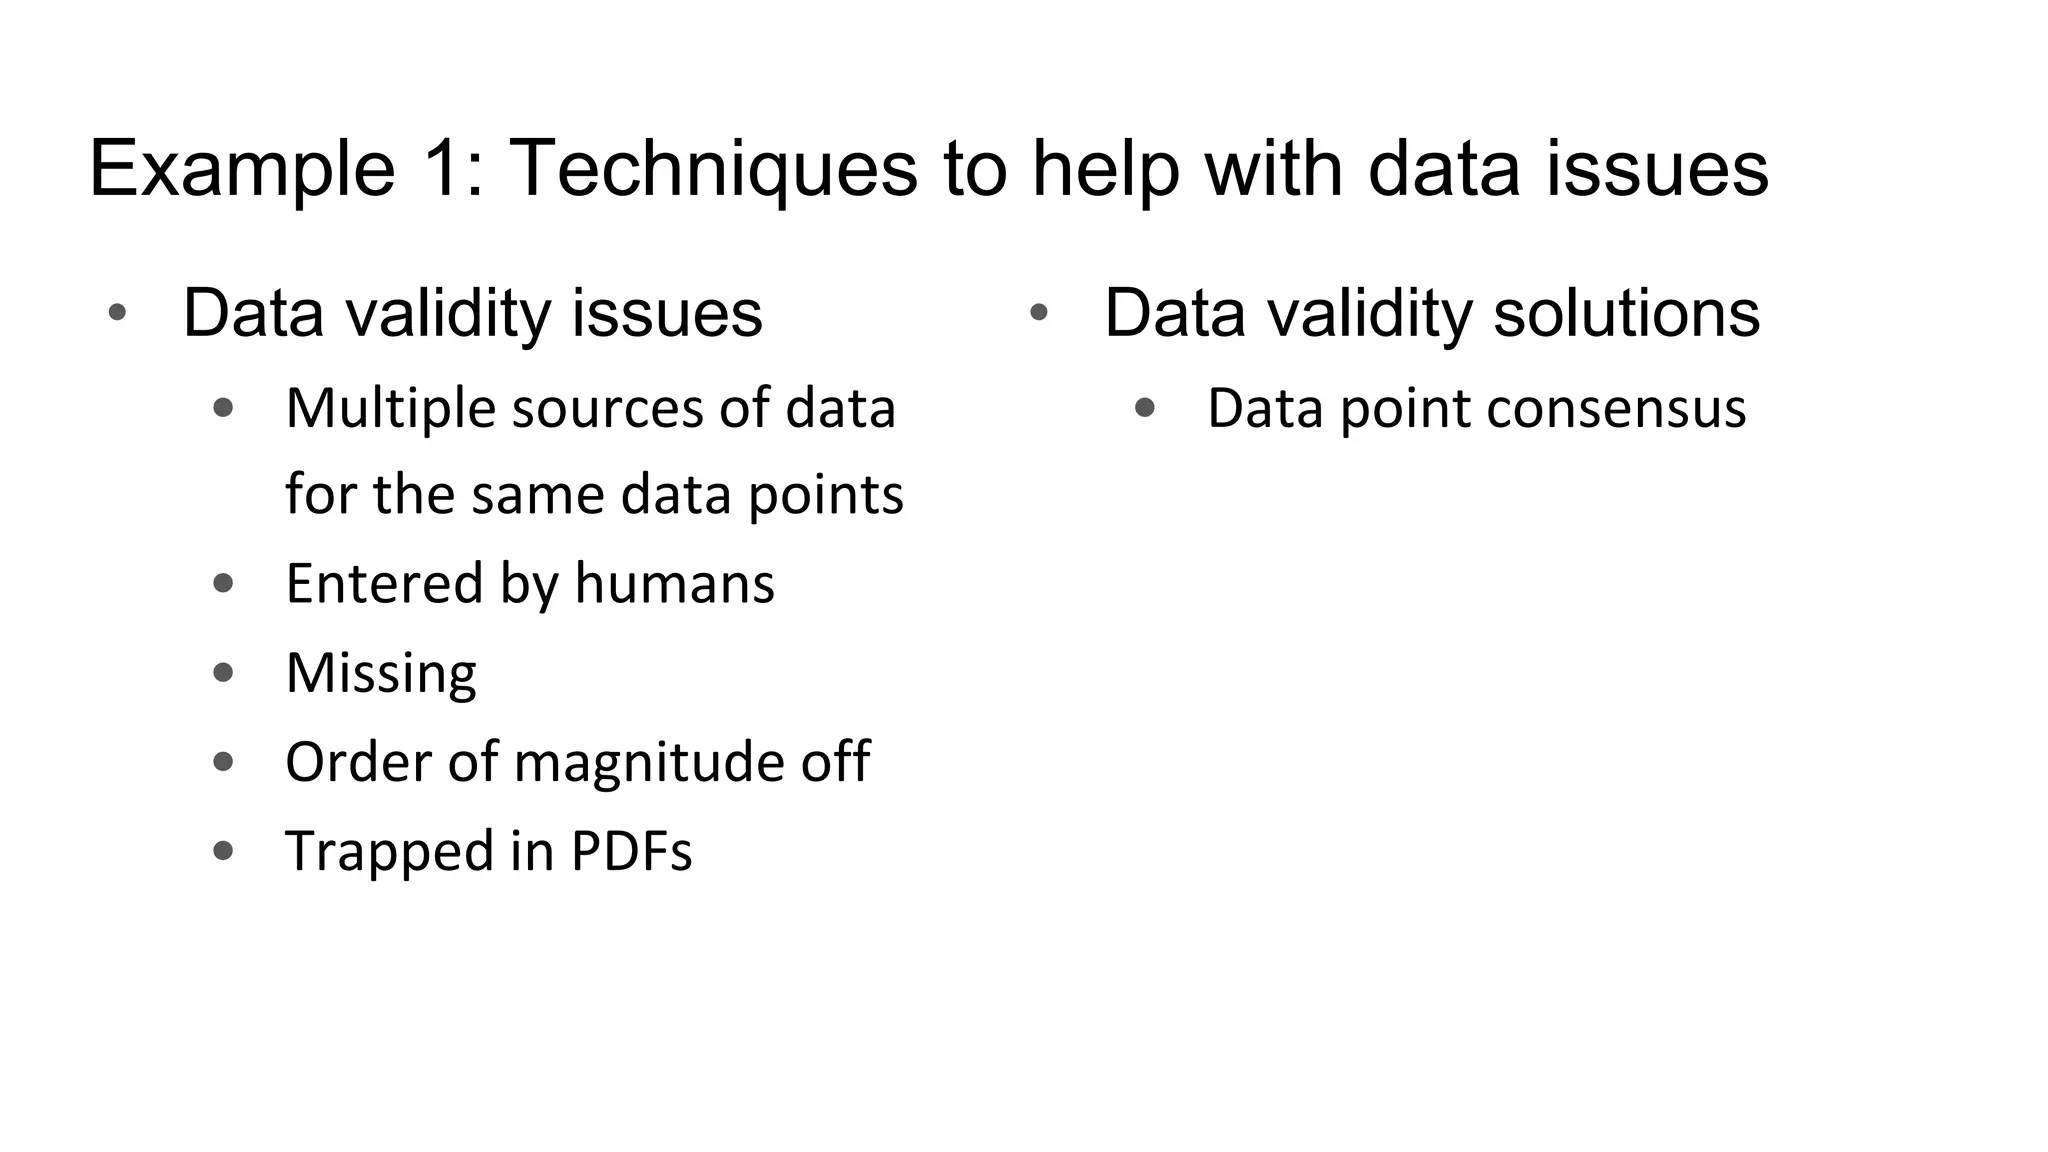
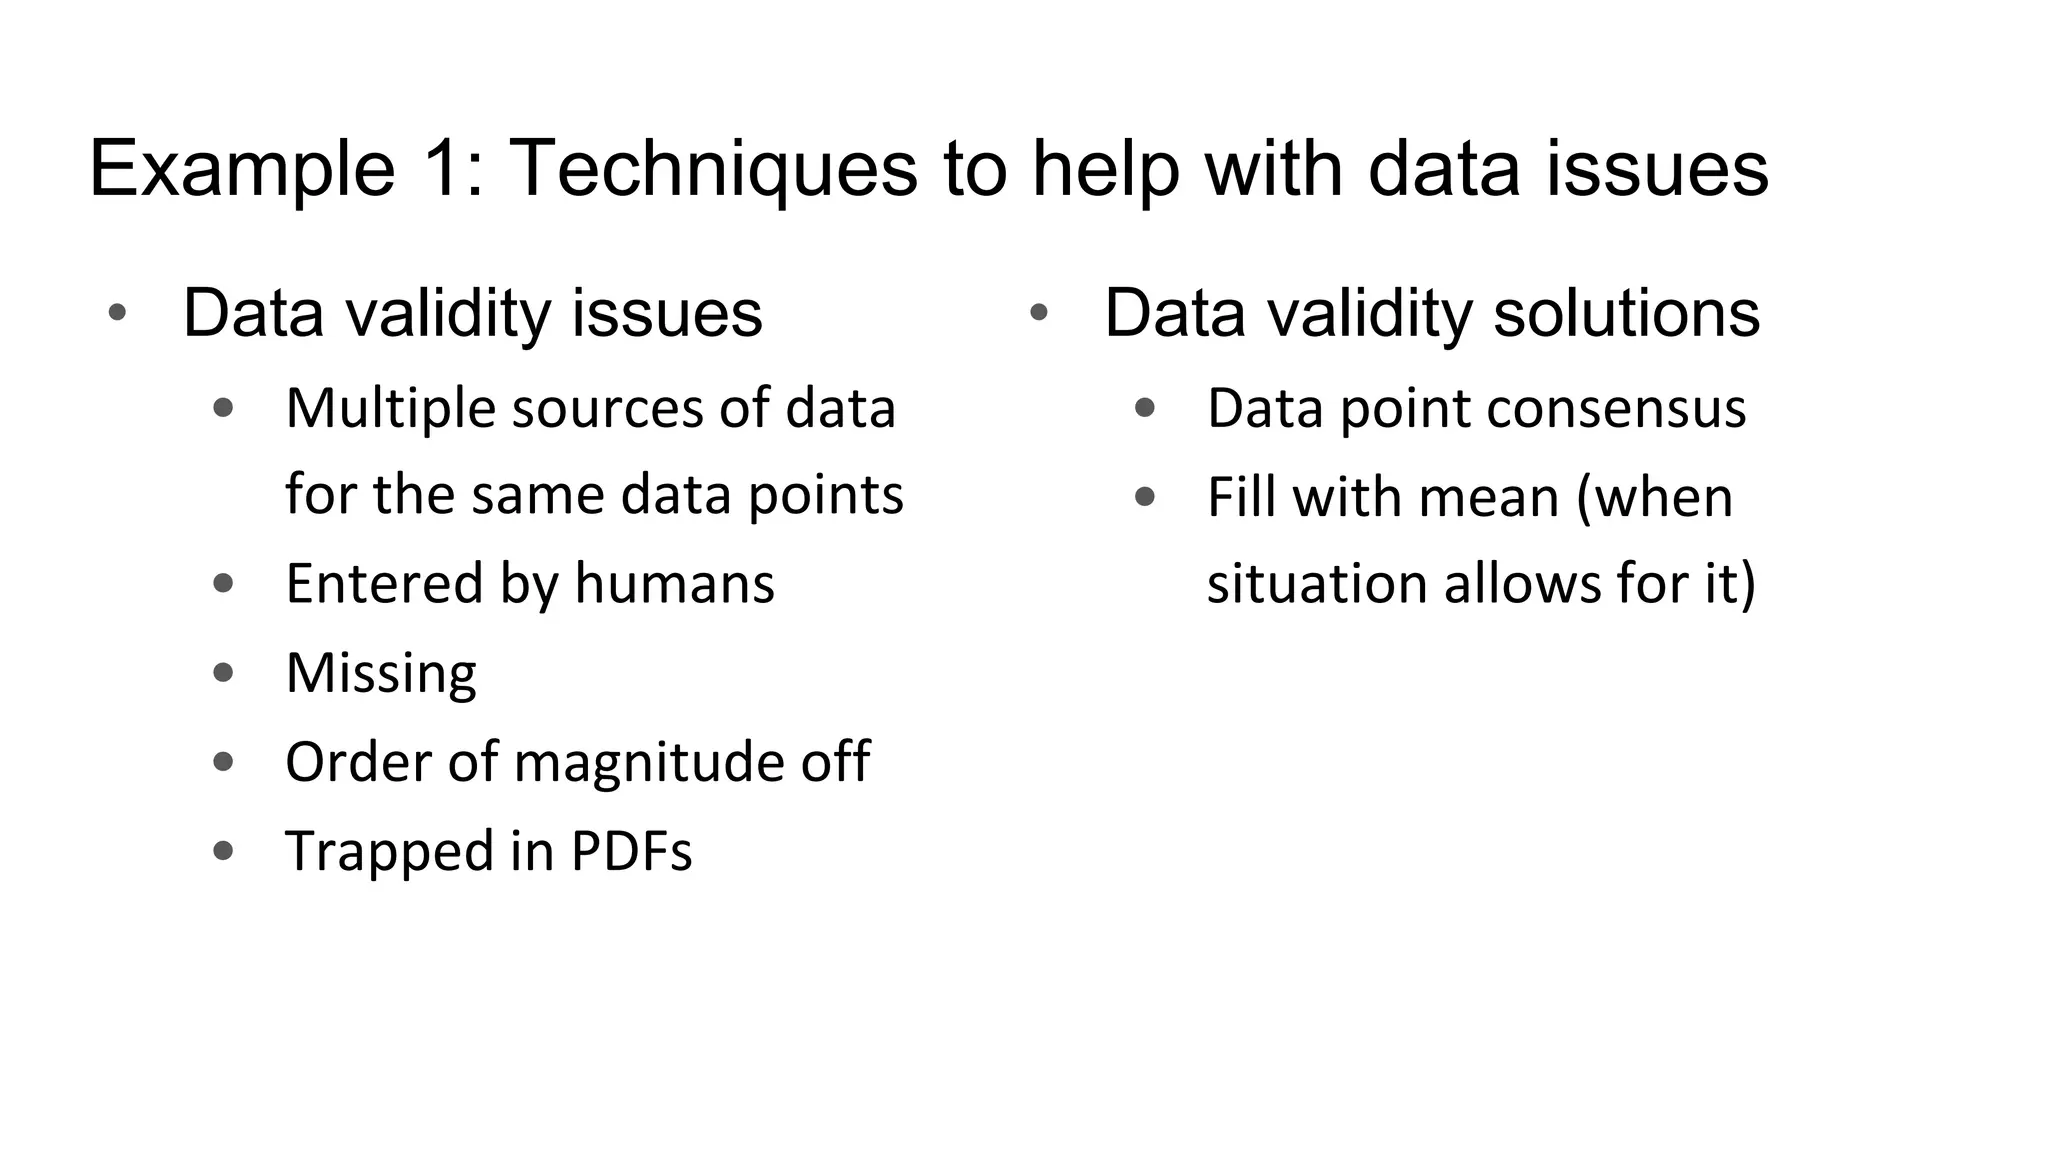
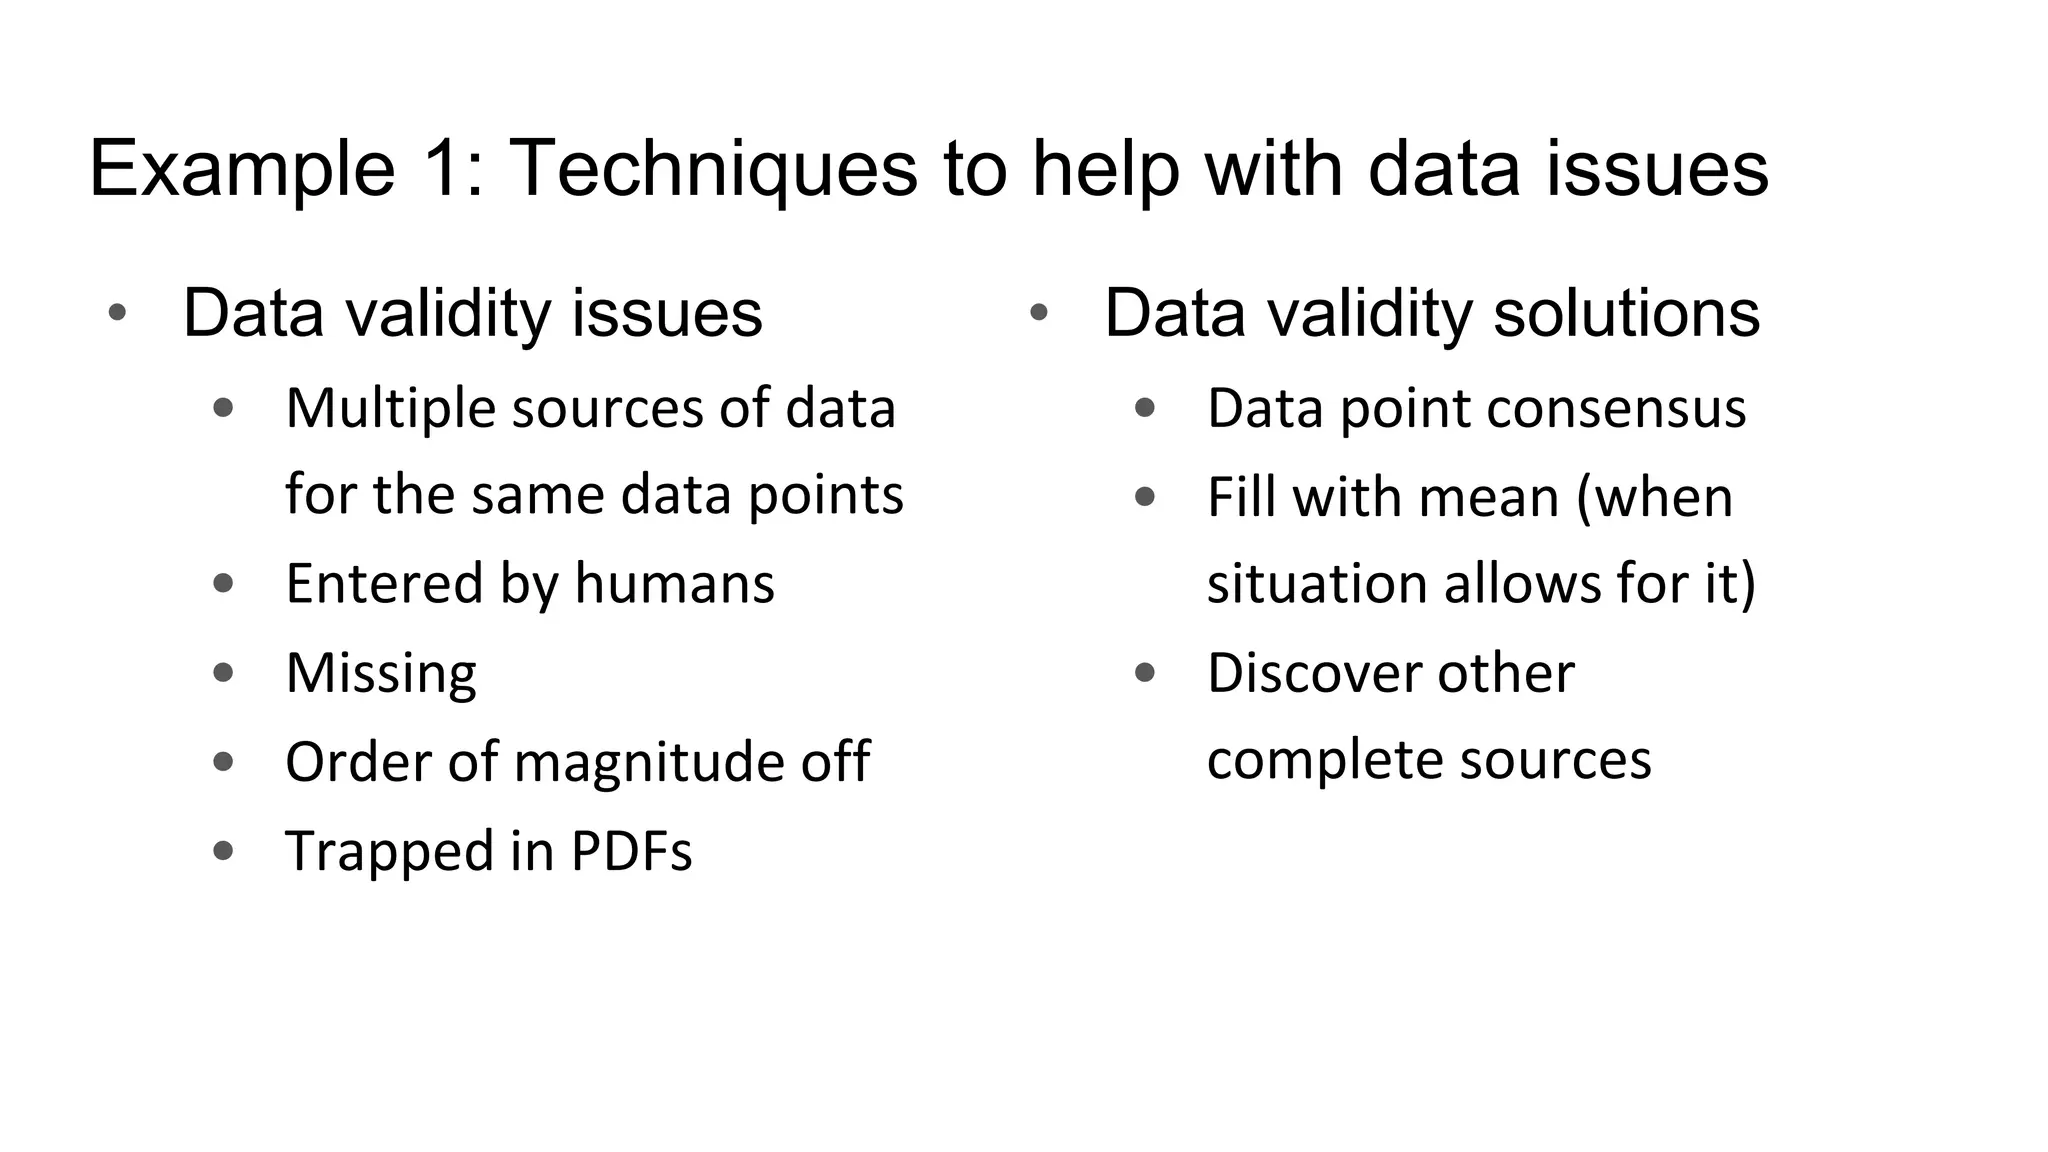
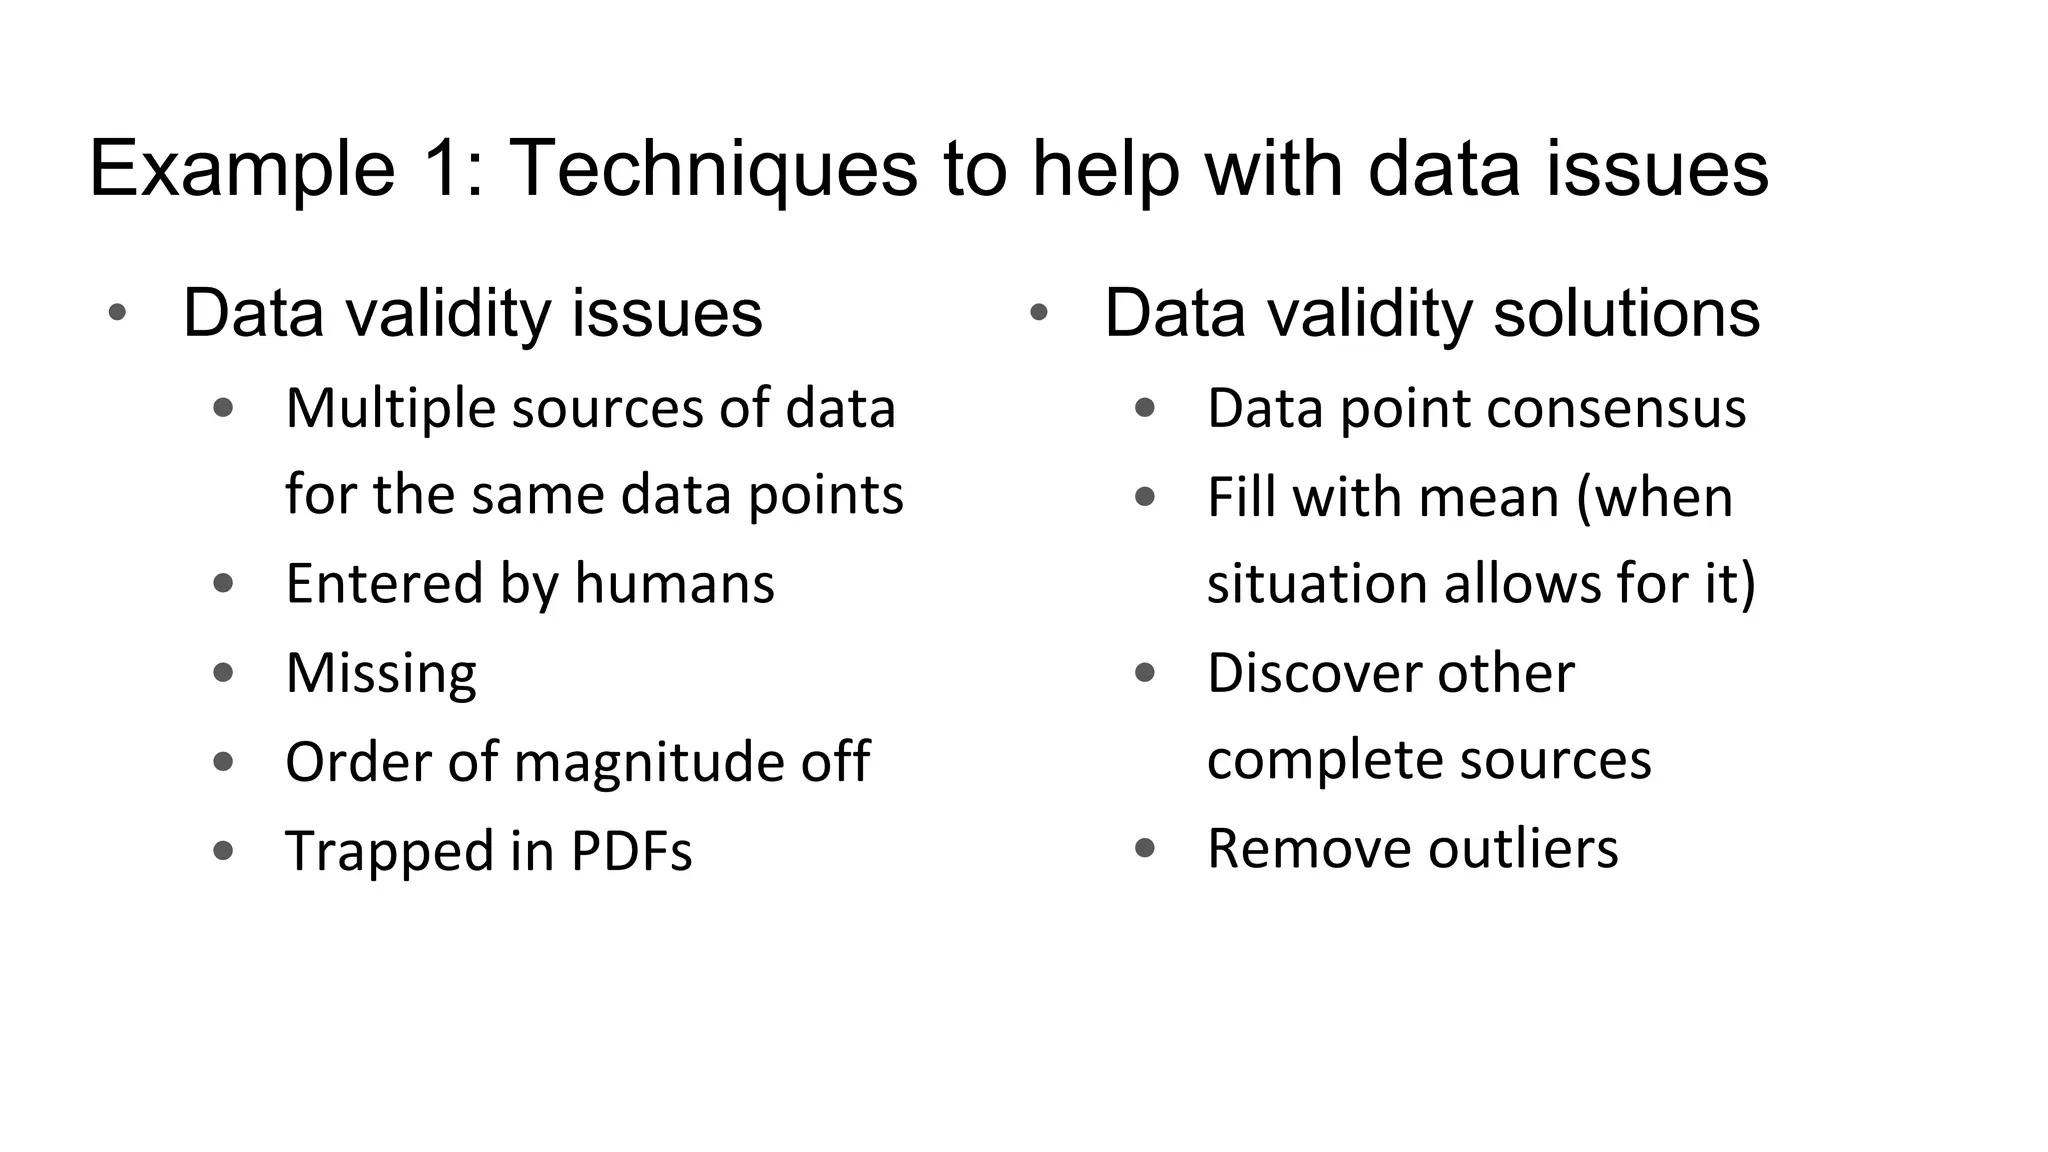
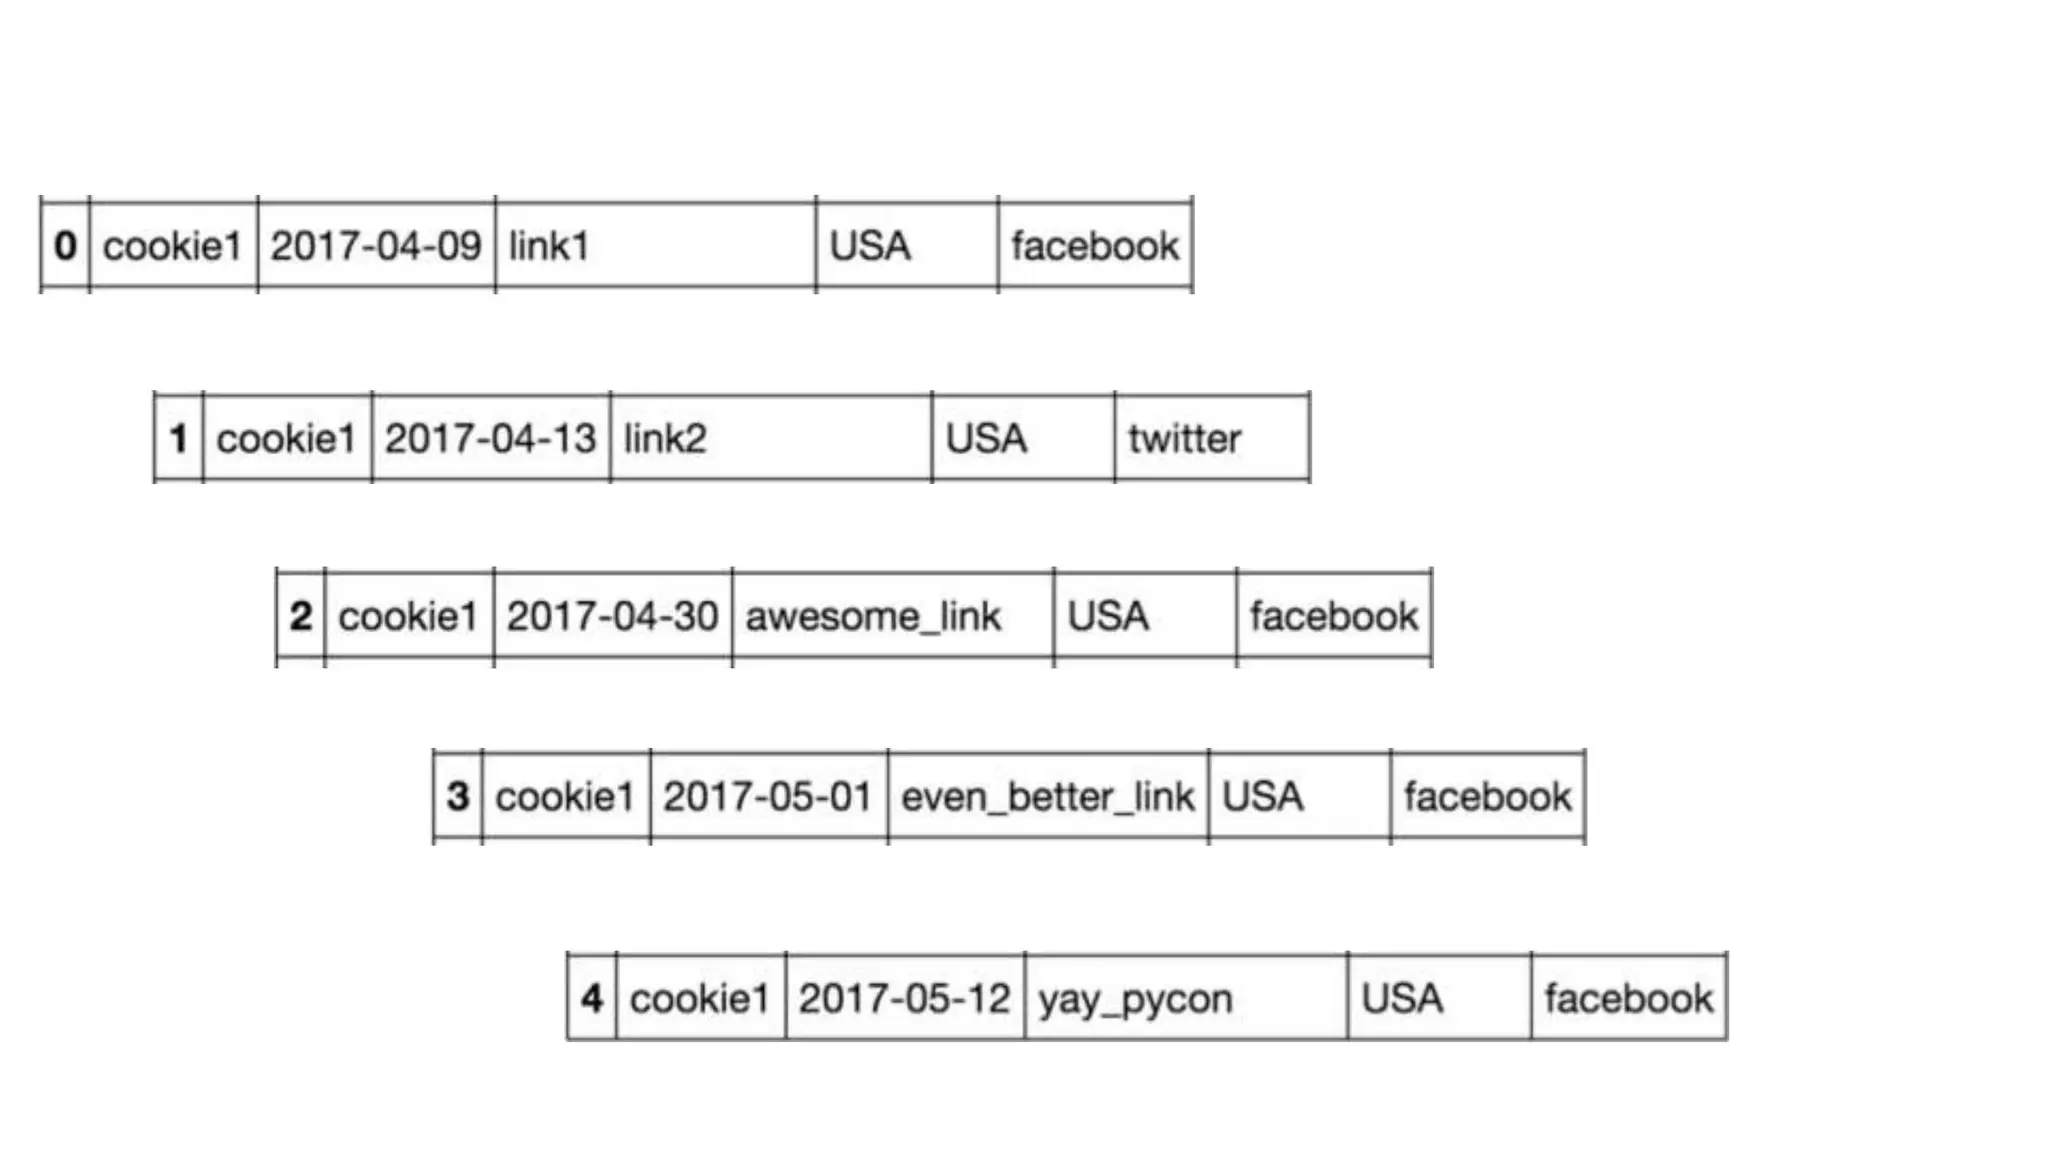
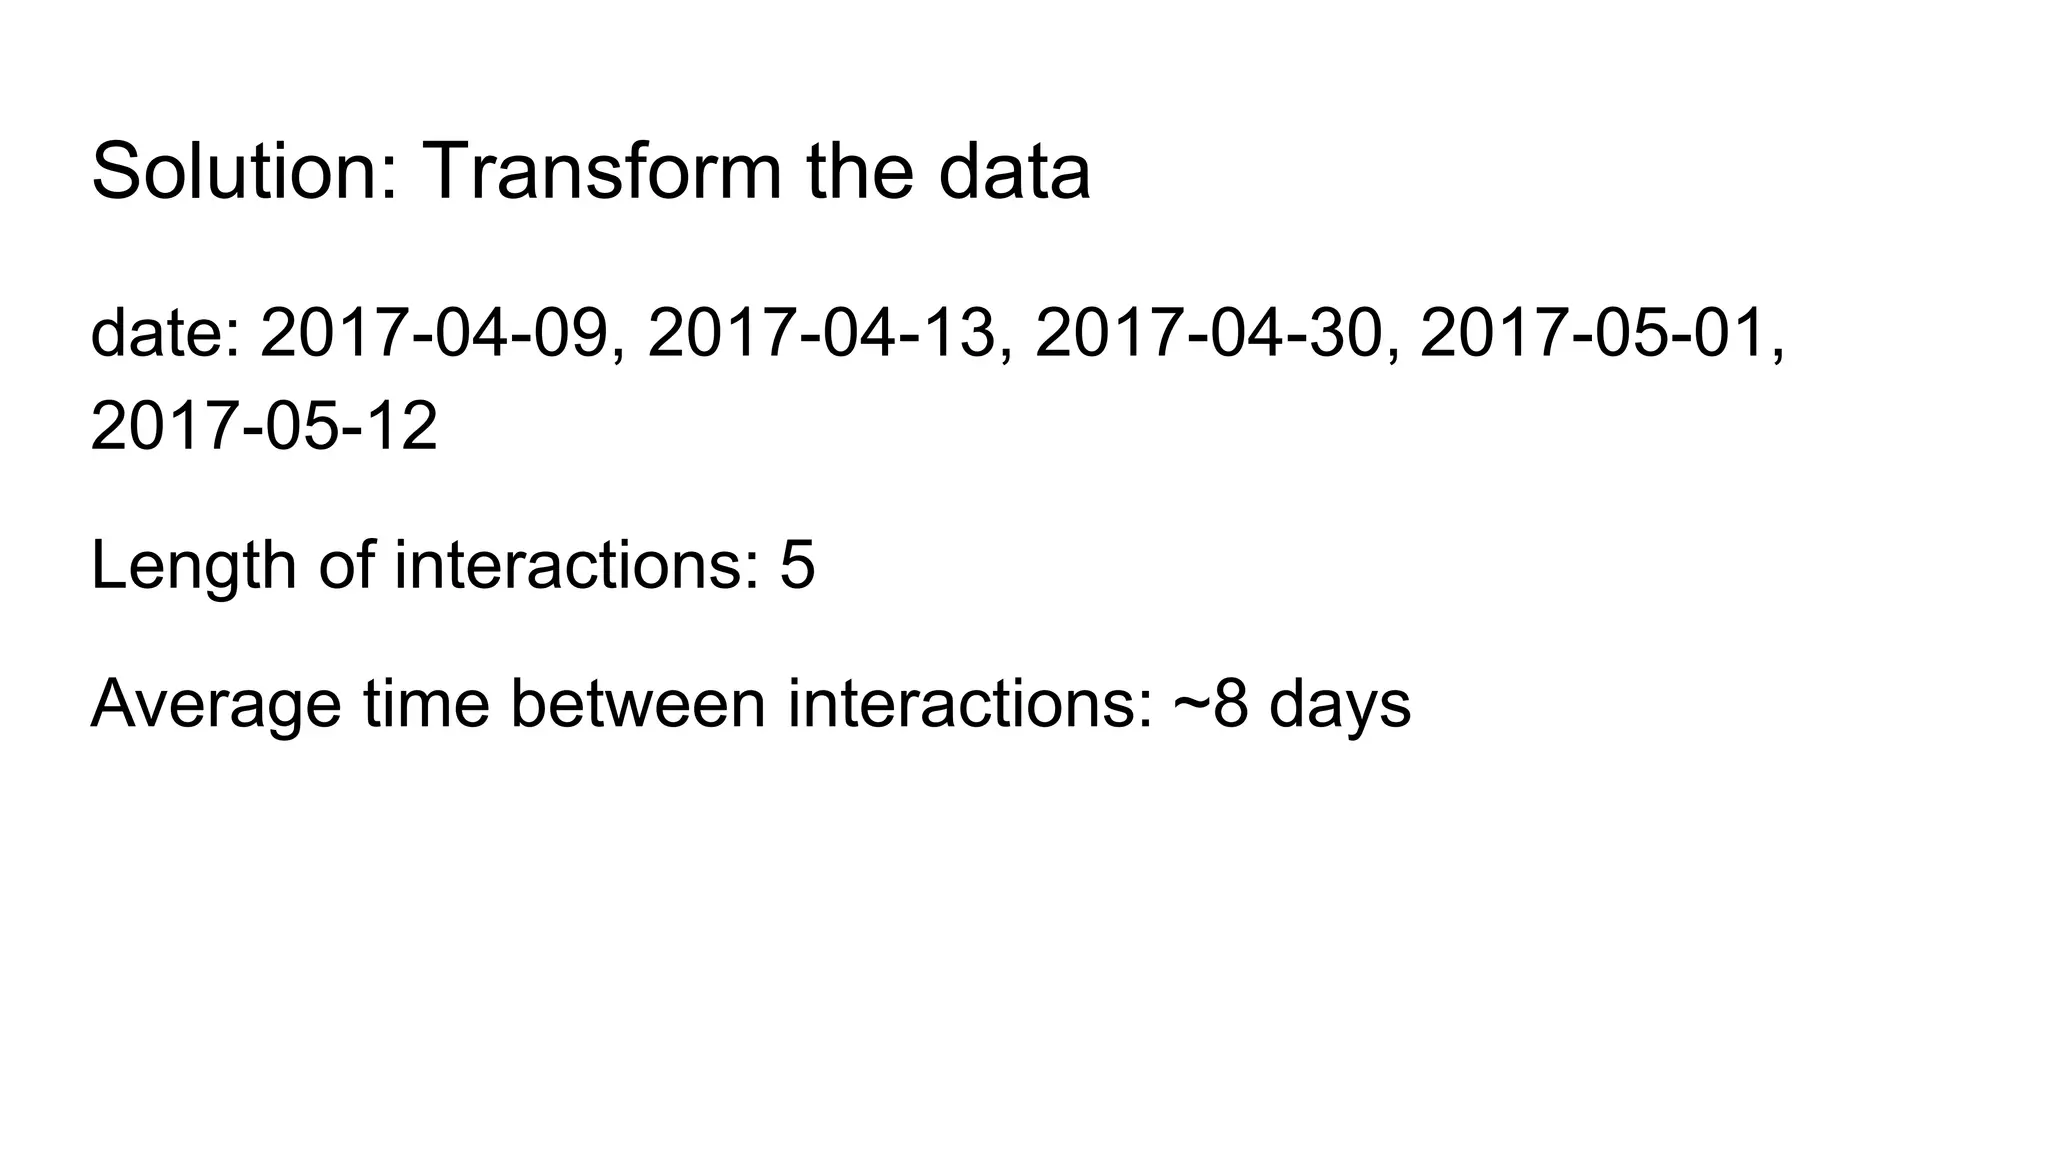
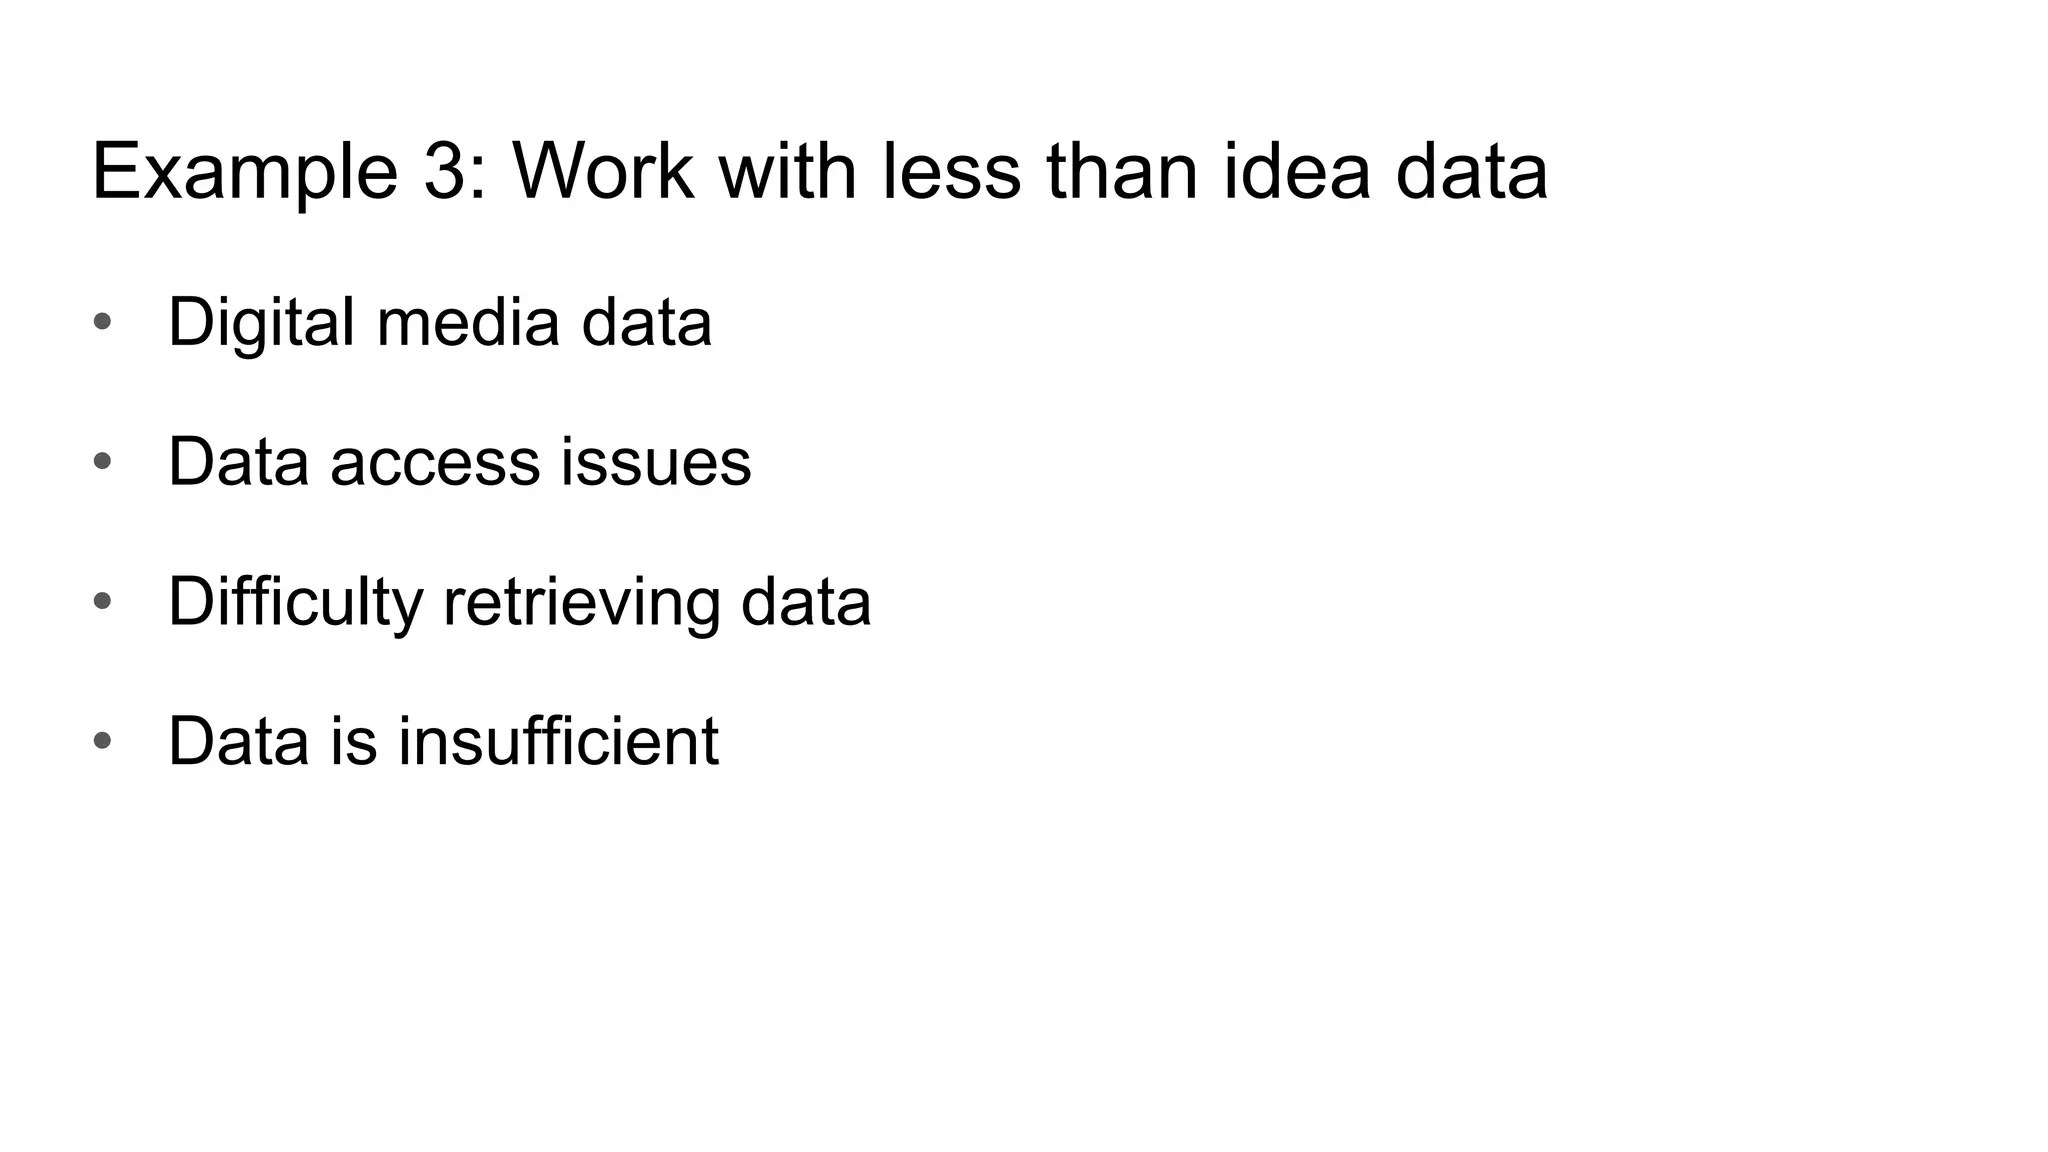
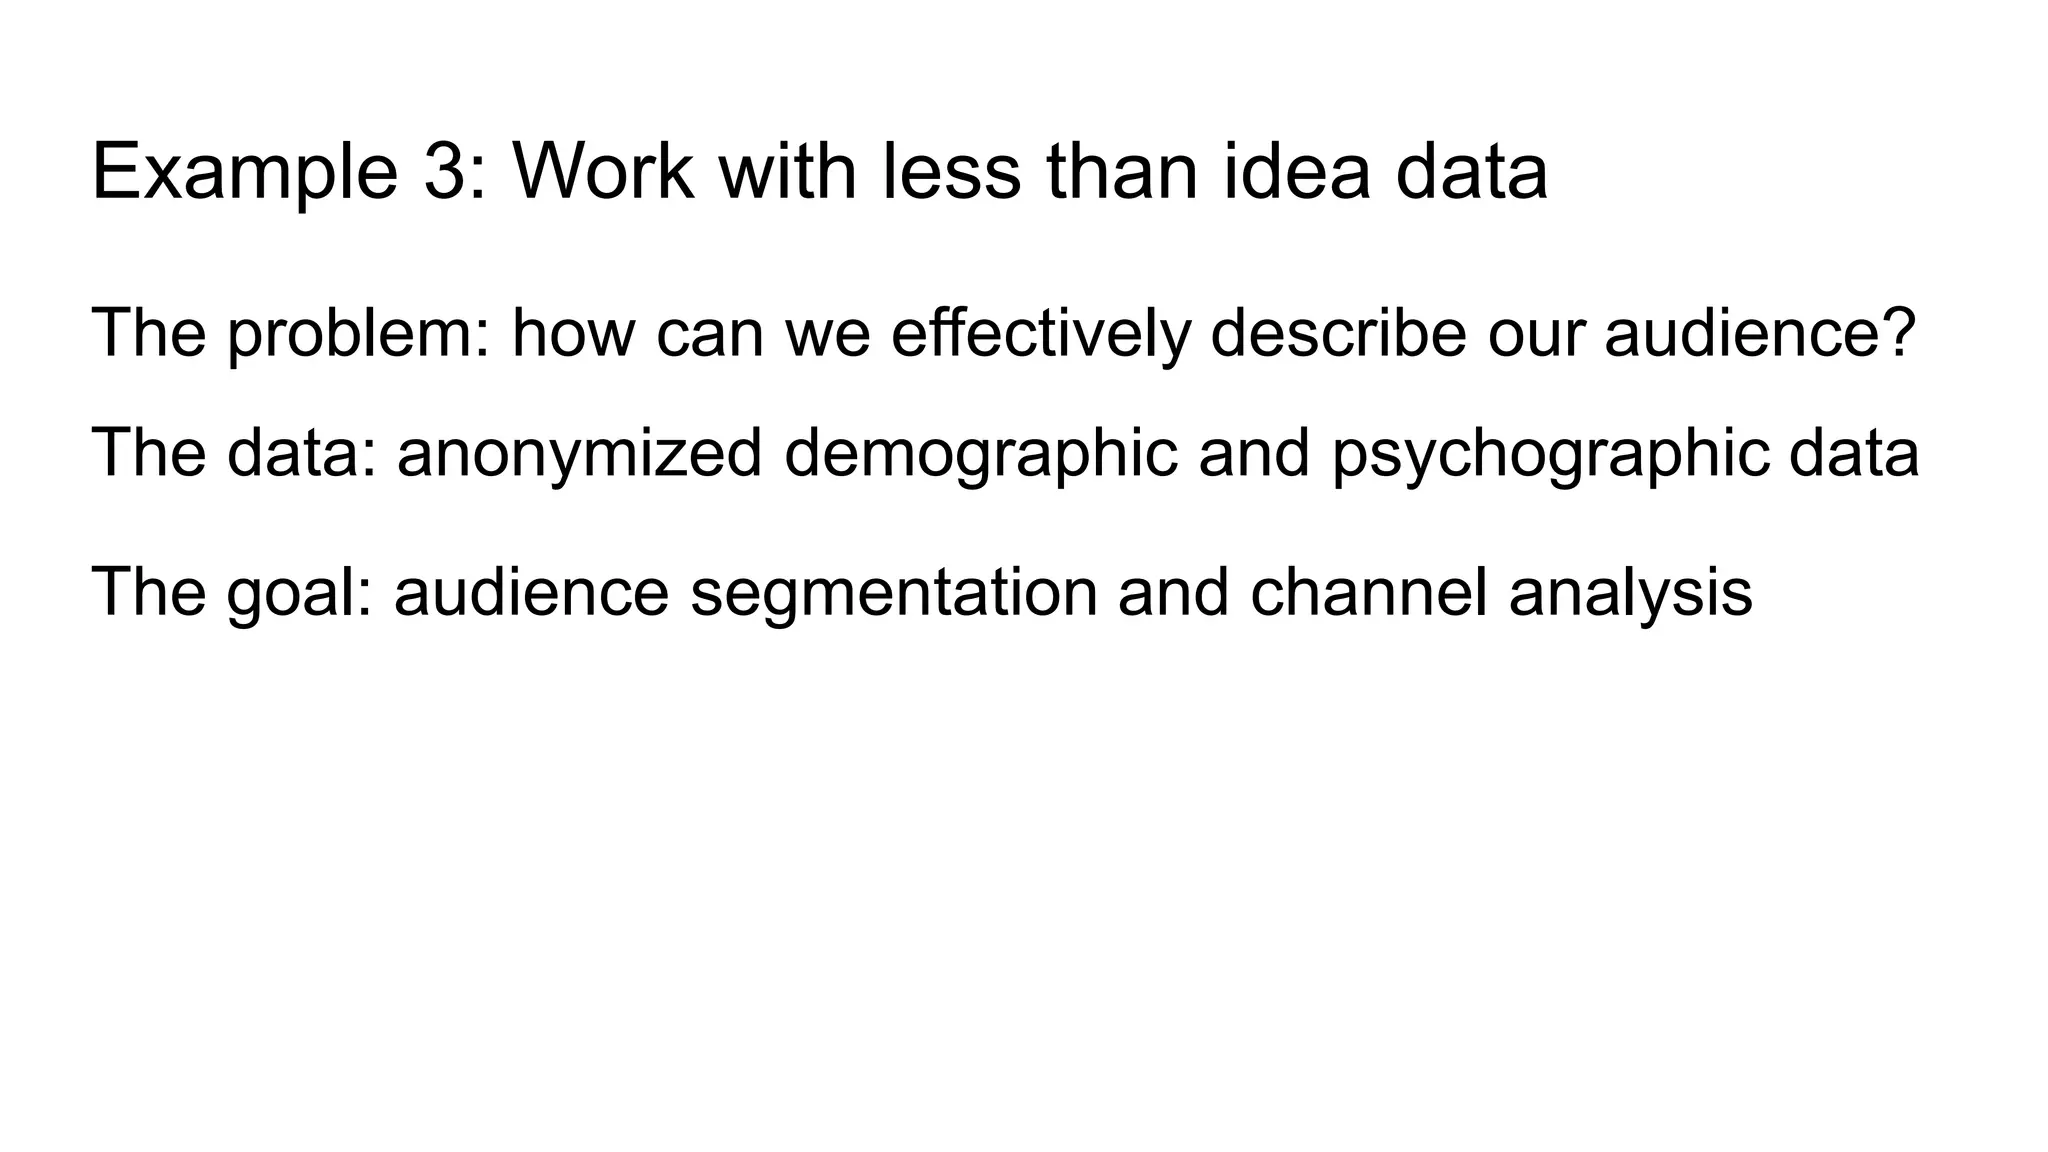
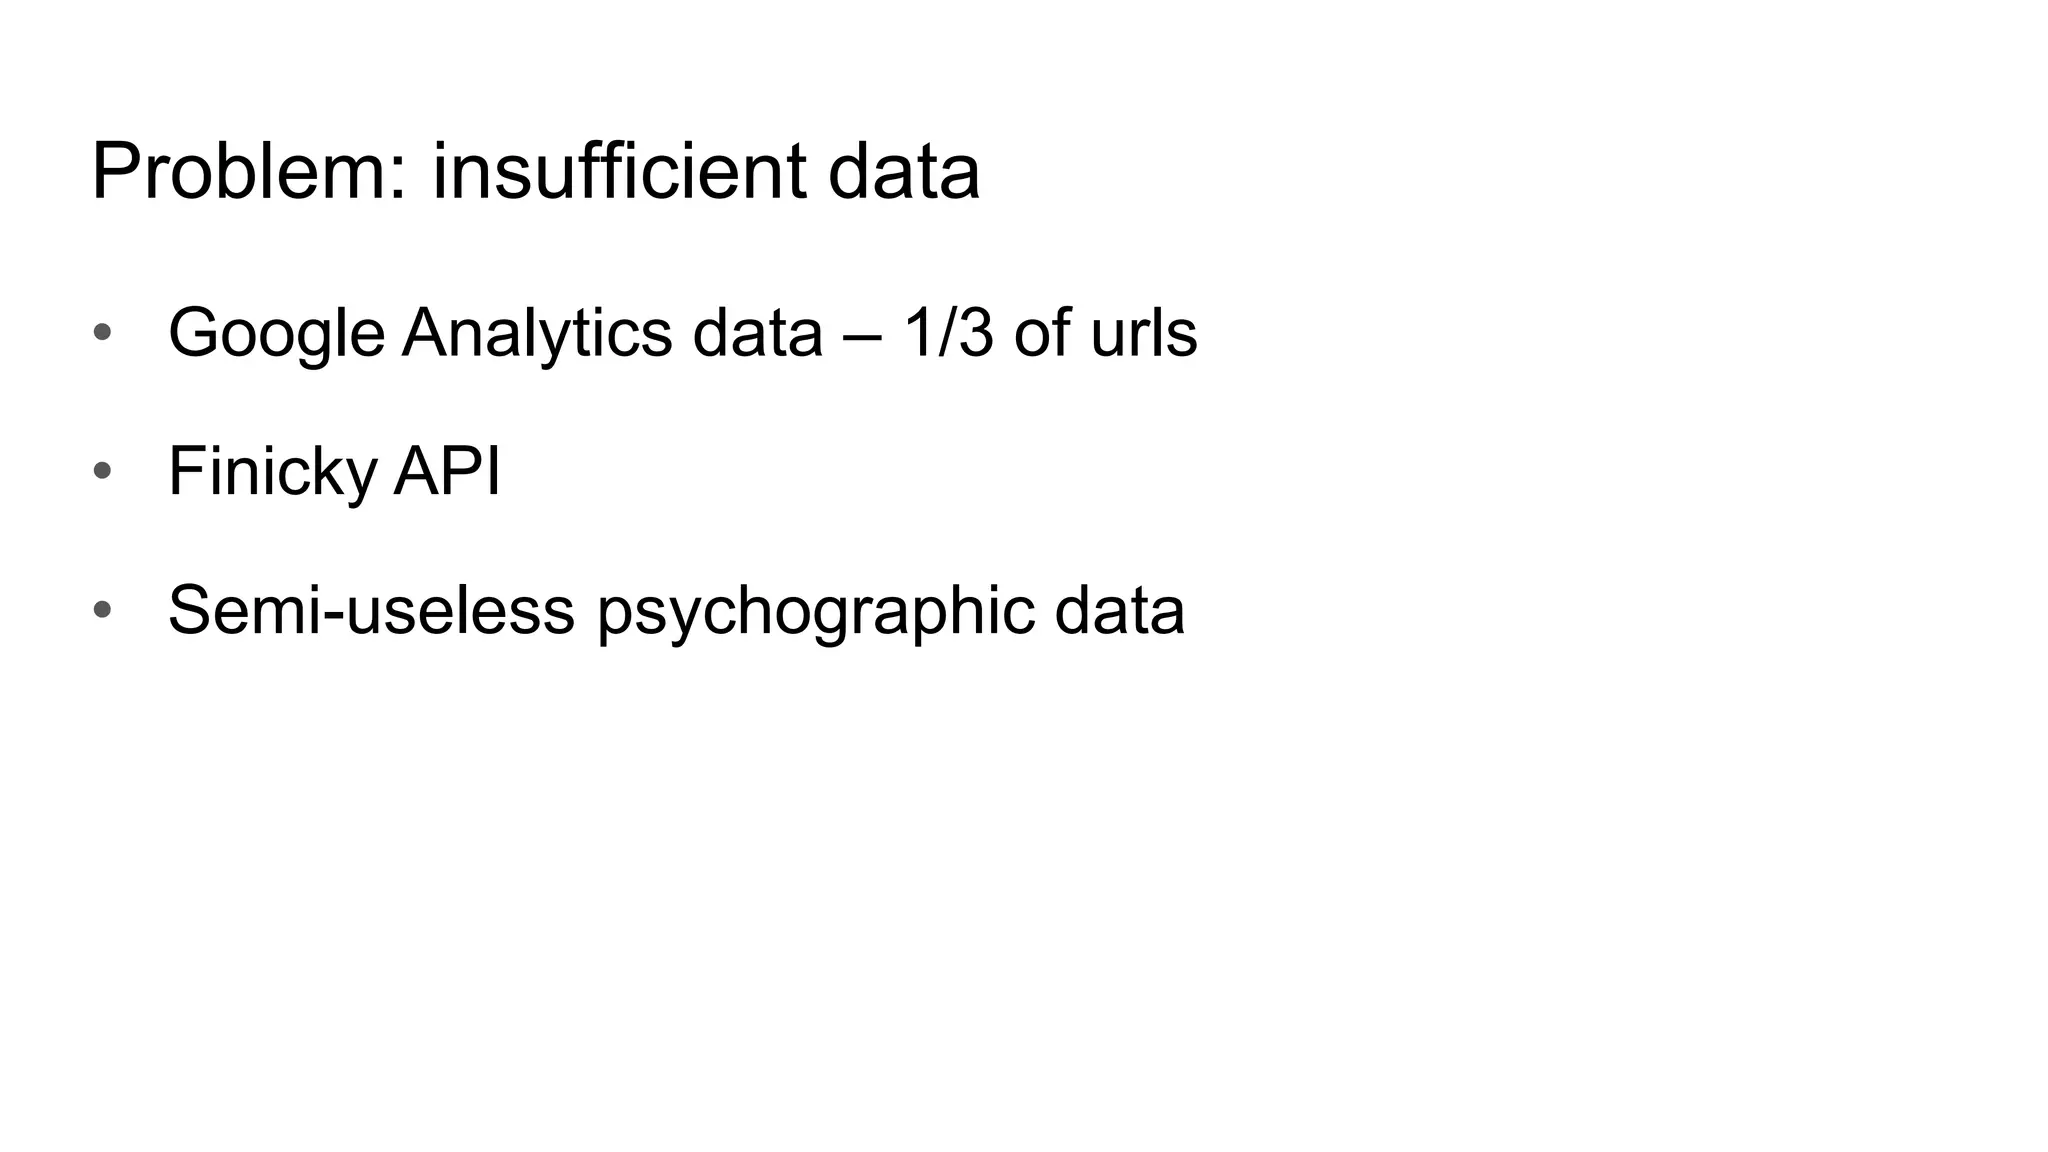
This talk discusses techniques for dealing with messy and imperfect data. Three examples are provided: (1) commercial real estate data with validity issues that were addressed through consensus, imputation, outlier removal and OCR; (2) click data with cookie issues that required transformations like sampling and clustering after preprocessing; (3) digital media data with access issues that necessitated working with insufficient data using decomposition and seeking more data. The overall message is to focus on the problem, identify data limitations, and apply creative solutions like reworking the data.


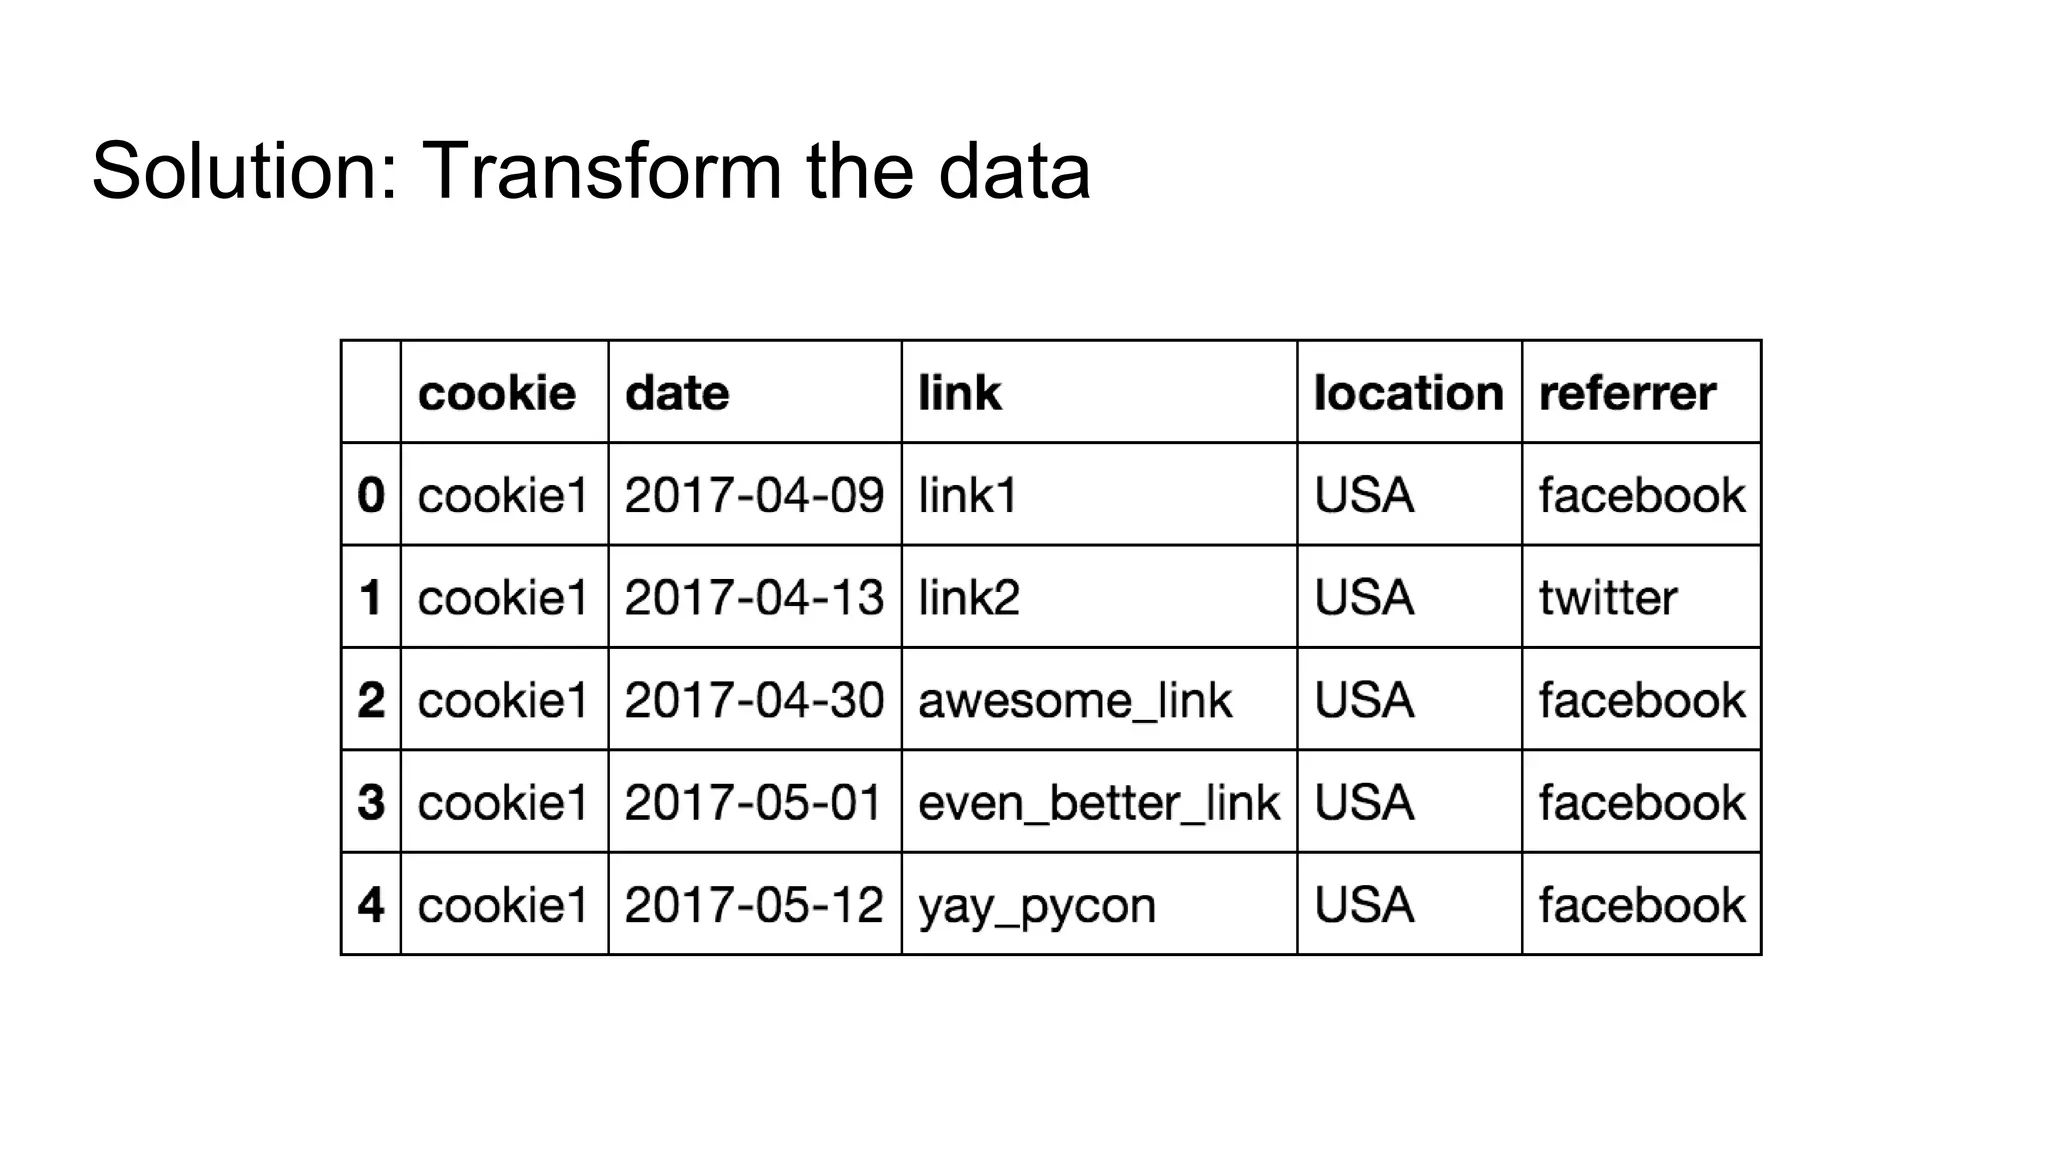
![Solution: Transform the data
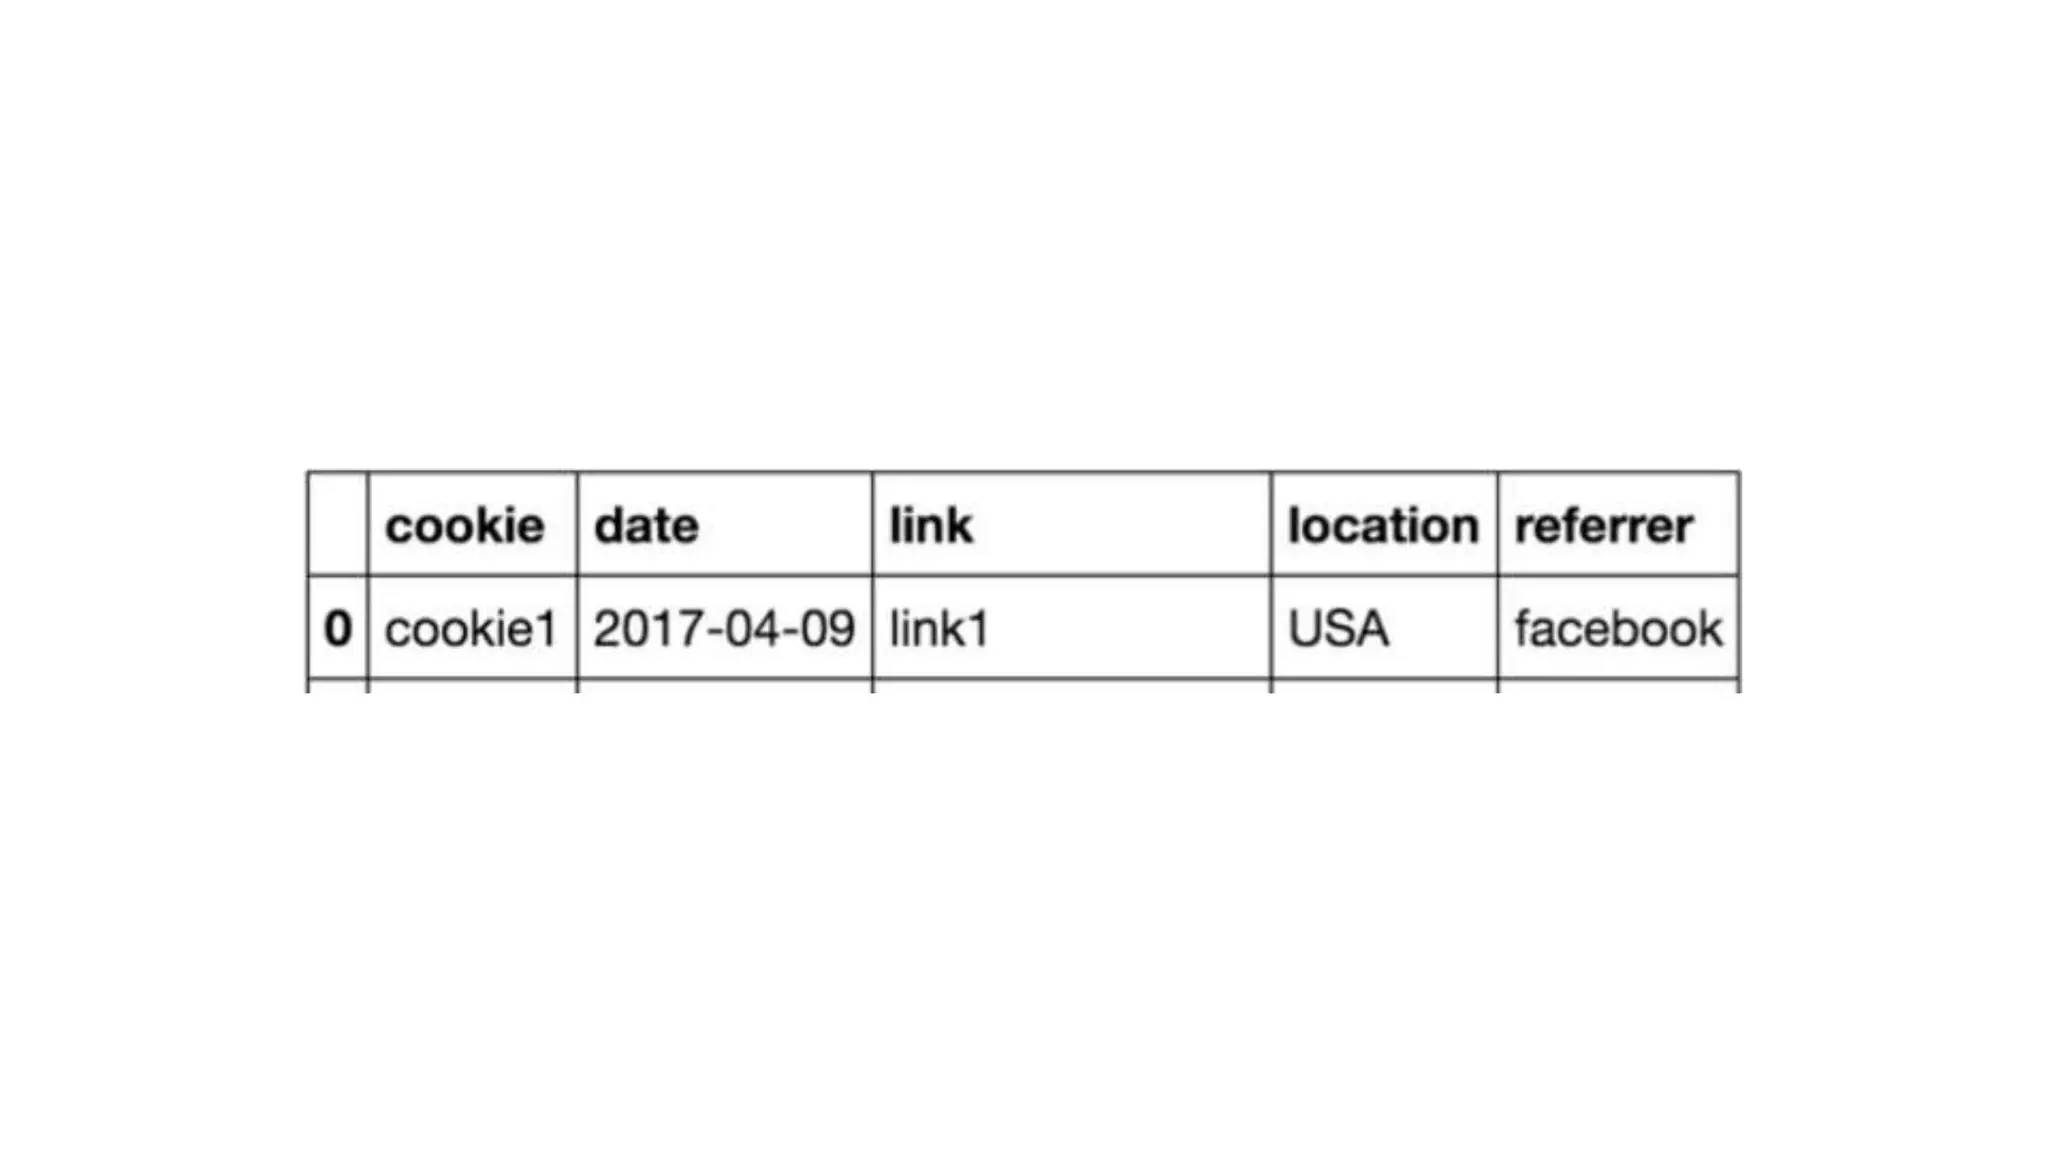
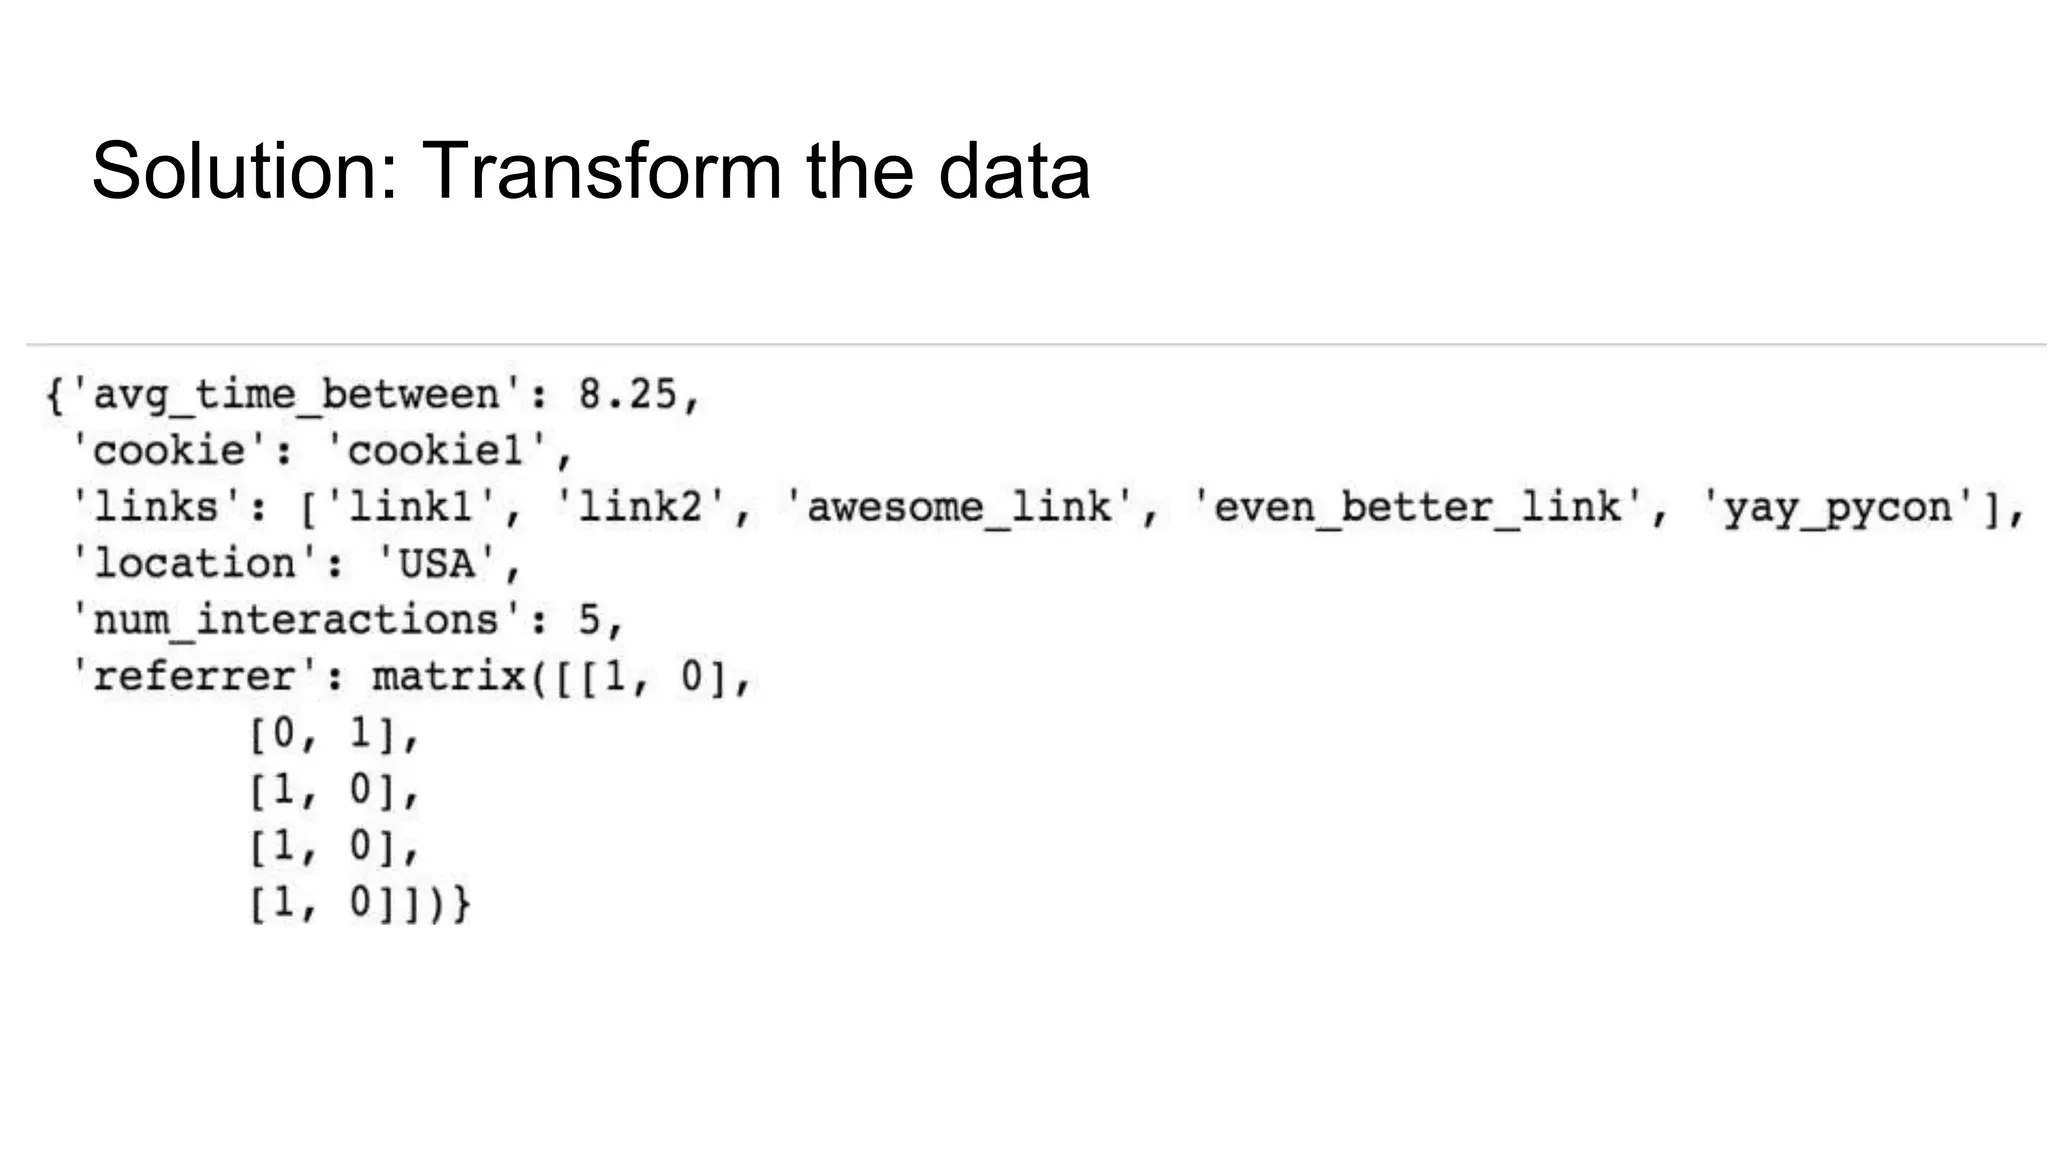
referrer: facebook, twitter
One-hot encode and transform to matrix
• Facebook: [1, 0]
• Twitter: [0, 1]](https://image.slidesharecdn.com/datawranglingupload-180210191145/75/The-Wild-West-of-Data-Wrangling-PyTN-38-2048.jpg)


![[DSC Europe 25] Goran Obradovic - The Rise of Sovereign AI: Building the Regi...](https://cdn.slidesharecdn.com/ss_thumbnails/7nw2xxixrxqdxvrb5wca-6-251205085714-ab09a2ac-thumbnail.jpg?width=640&height=640&fit=bounds)

![[DSC Europe 25] Marija Vlajkovic & Andrea Radonjanin - Integration of AI tool...](https://cdn.slidesharecdn.com/ss_thumbnails/qf1jrglttoc3bm8s3aop-final-integration-of-ai-tools-251208151905-394f3a6a-thumbnail.jpg?width=640&height=640&fit=bounds)
![[DSC Europe 25] Bogdan Daniel Maruneac - AI - It starts with you.pptx](https://cdn.slidesharecdn.com/ss_thumbnails/odov3snhrcqs9hx5ny2n-4-251205085715-f1daacfe-thumbnail.jpg?width=640&height=640&fit=bounds)
![[DSC Europe 25] Petar Zivanov - AI meets documents From chatbots to AI-powere...](https://cdn.slidesharecdn.com/ss_thumbnails/xer2bb6nrdc8pdpev0pc-8-251204082258-7c2fa4a1-thumbnail.jpg?width=640&height=640&fit=bounds)


![[DSC Europe 25] Max Talanov - Non digital NNs.pptx](https://cdn.slidesharecdn.com/ss_thumbnails/wif8tr3gtua74qvtopke-non-digital-nns-251205090438-26b0eea6-thumbnail.jpg?width=640&height=640&fit=bounds)


