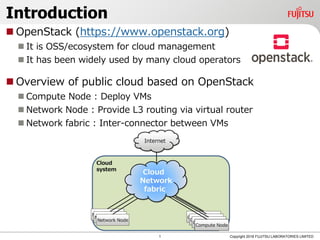
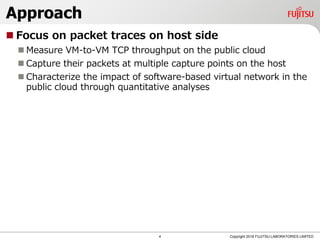
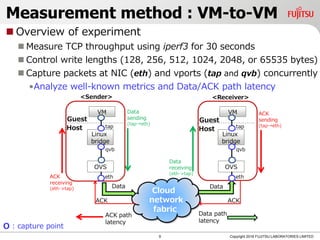
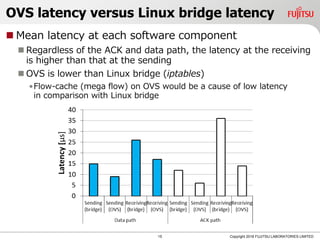
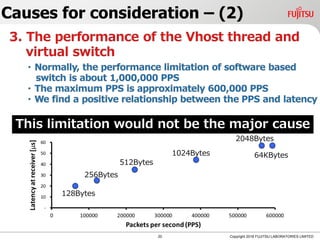
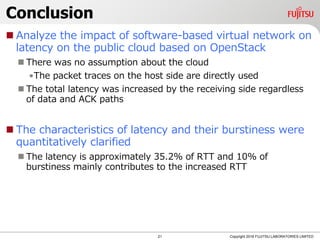
The document discusses research on the latency of software-based virtual networks in public clouds using OpenStack. It presents methodologies for measuring VM-to-VM TCP throughput and analyzes latency characteristics, revealing that total latency accounts for approximately 35.2% of round-trip time (RTT), largely influenced by receiver-side delays and burstiness events. The study concludes that understanding these latency dynamics is crucial for optimizing cloud network performance.


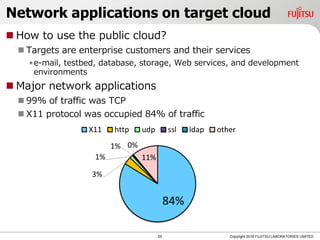
![Previous works on measuring cloud network
Many studies have focused on cloud network
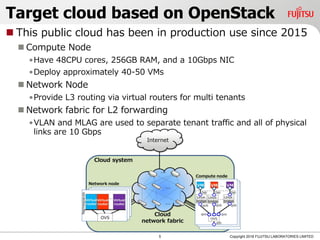
performance and depended on information at VM side
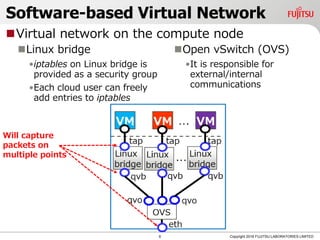
Few prior works of the latency on the virtual network
One study measured the latency of virtual networks, such as Xen,
Linux, and VServer, in a local environment [Sigcomm CCR 41]
Their results are too limited to be generalized to the latency
of cloud network architecture based on OpenStack
2 Copyright 2018 FUJITSU LABORATORIES LIMITED](https://image.slidesharecdn.com/pvesdn02-180709025611/85/The-Impact-of-Software-based-Virtual-Network-in-the-Public-Cloud-3-320.jpg)
![Node selection
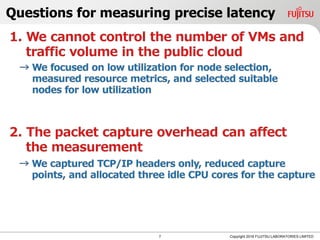
We focused on low utilization for suitable nodes
Measure CPU and memory usage, traffic volume, and the number
of VMs at each node
Consider the resource metrics as candidates for low utilization
Overview of selected nodes
There were no abrupt changes in the metrics
•We believe that it can indicate the low utilization
VMs that had one CPU core and 4GB RAM were deployed for the
measurement at different racks
•To avoid extra overhead by iptables (Linux bridge),
we did not add any rules to the security group
8 Copyright 2018 FUJITSU LABORATORIES LIMITED
Number of VMs Idle CPUs [%] Memory [%] Traffic volume [Gbps]
40 VMs (48 CPUs) 95 70 Smaller than 1Gbps*
* The traffic volume is in the night
< Resource metrics >](https://image.slidesharecdn.com/pvesdn02-180709025611/85/The-Impact-of-Software-based-Virtual-Network-in-the-Public-Cloud-9-320.jpg)
![Write lengths
[bytes]
128 256 512 1024 2048 65535
(64 KB)
Mean throughput
[Mbps]
721 1375 2524 4389 6382 6707
TCP Throughput
Throughput statistics
We ran our experiments in the night
•The traffic volume was smaller than 1 Gbps in the night
Throughput with 2048 bytes is similar to that with 65535 bytes
•The TCP throughput with 64 KB was similar to the maximum
throughput on our cloud
While each result had different throughput, well-known metrics
were fundamentally similar
11 Copyright 2018 FUJITSU LABORATORIES LIMITED
We select the representative result
with 1024 bytes](https://image.slidesharecdn.com/pvesdn02-180709025611/85/The-Impact-of-Software-based-Virtual-Network-in-the-Public-Cloud-12-320.jpg)
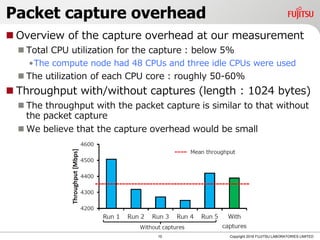
![RTT between capture points
RTT (1024 bytes)
Compare statistics of RTT with those on MS DCN (Sigcomm 2015)
Find the overhead induced by the software-based virtual network
13 Copyright 2018 FUJITSU LABORATORIES LIMITED
RTT Mean [μs] 50%tile [μs] 99%tile [μs]
tap 386 377 871
qvb 331 322 714
eth 305 300 666
MS DCN NO result 268 1340](https://image.slidesharecdn.com/pvesdn02-180709025611/85/The-Impact-of-Software-based-Virtual-Network-in-the-Public-Cloud-14-320.jpg)
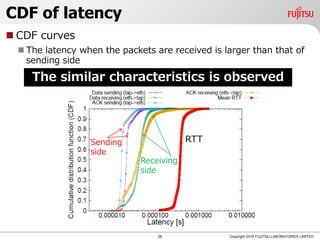
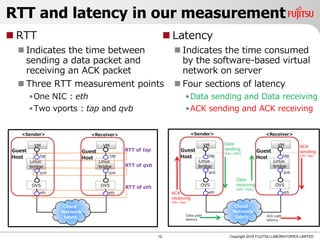
![Latency on virtual network
Latency (1024 bytes)
The total latency is 136μs and
it is approximately 35.2% of RTT
The receiving side (eth→tap) is
heavier than the sending
side (tap→eth)
14 Copyright 2018 FUJITSU LABORATORIES LIMITED
Latency Mean [μs] 50%tile [μs] 99%tile [μs]
RTT of tap on our cloud 386 377 871
Total latency on our cloud 136 124 461
Total latency on local 26 26 46
Receiving
side
Data sending (tap→eth) 24 22 54
Data receiving (eth→tap) 44 44 99
ACK sending (tap→eth) 18 17 42
ACK receiving (eth→tap) 50 41 266](https://image.slidesharecdn.com/pvesdn02-180709025611/85/The-Impact-of-Software-based-Virtual-Network-in-the-Public-Cloud-15-320.jpg)
![Burstiness of latency – (1)
What is the burstiness of latency in this research?
The abrupt fluctuation of latency can occur due to software
processing
RTT and latency behavior
Similar behavior is observed between RTT and total latency
16 Copyright 2018 FUJITSU LABORATORIES LIMITED
Latency[s]RTT[s]
Elapsed time [s]](https://image.slidesharecdn.com/pvesdn02-180709025611/85/The-Impact-of-Software-based-Virtual-Network-in-the-Public-Cloud-17-320.jpg)
![Burstiness of latency – (2)
The quantitative characteristics of burstiness of latency
Apply the burst detection algorithm by Kleinberg (SIGKDD’02)
Detect the 856 burstiness events
Mark 10% of burstiness on the RTT
17 Copyright 2018 FUJITSU LABORATORIES LIMITED
<RTT and 10% of burstiness (a red bar corresponds to the burstiness)>
Mean Top 10% Greatest
Burst period [ms] 1.9 5.5 25
The burstiness of latency can be
a major cause of the increased RTT](https://image.slidesharecdn.com/pvesdn02-180709025611/85/The-Impact-of-Software-based-Virtual-Network-in-the-Public-Cloud-18-320.jpg)

![TCP Throughput with 1024 bytes
Throughput at eth(NIC)
Mean throughput is 4389 [Mbps]
Major traffic is the measurement
There is a small fraction of
background traffic
•The impact of background
would be small to the measurement
24 Copyright 2018 FUJITSU LABORATORIES LIMITED](https://image.slidesharecdn.com/pvesdn02-180709025611/85/The-Impact-of-Software-based-Virtual-Network-in-the-Public-Cloud-25-320.jpg)