Downloaded 10 times
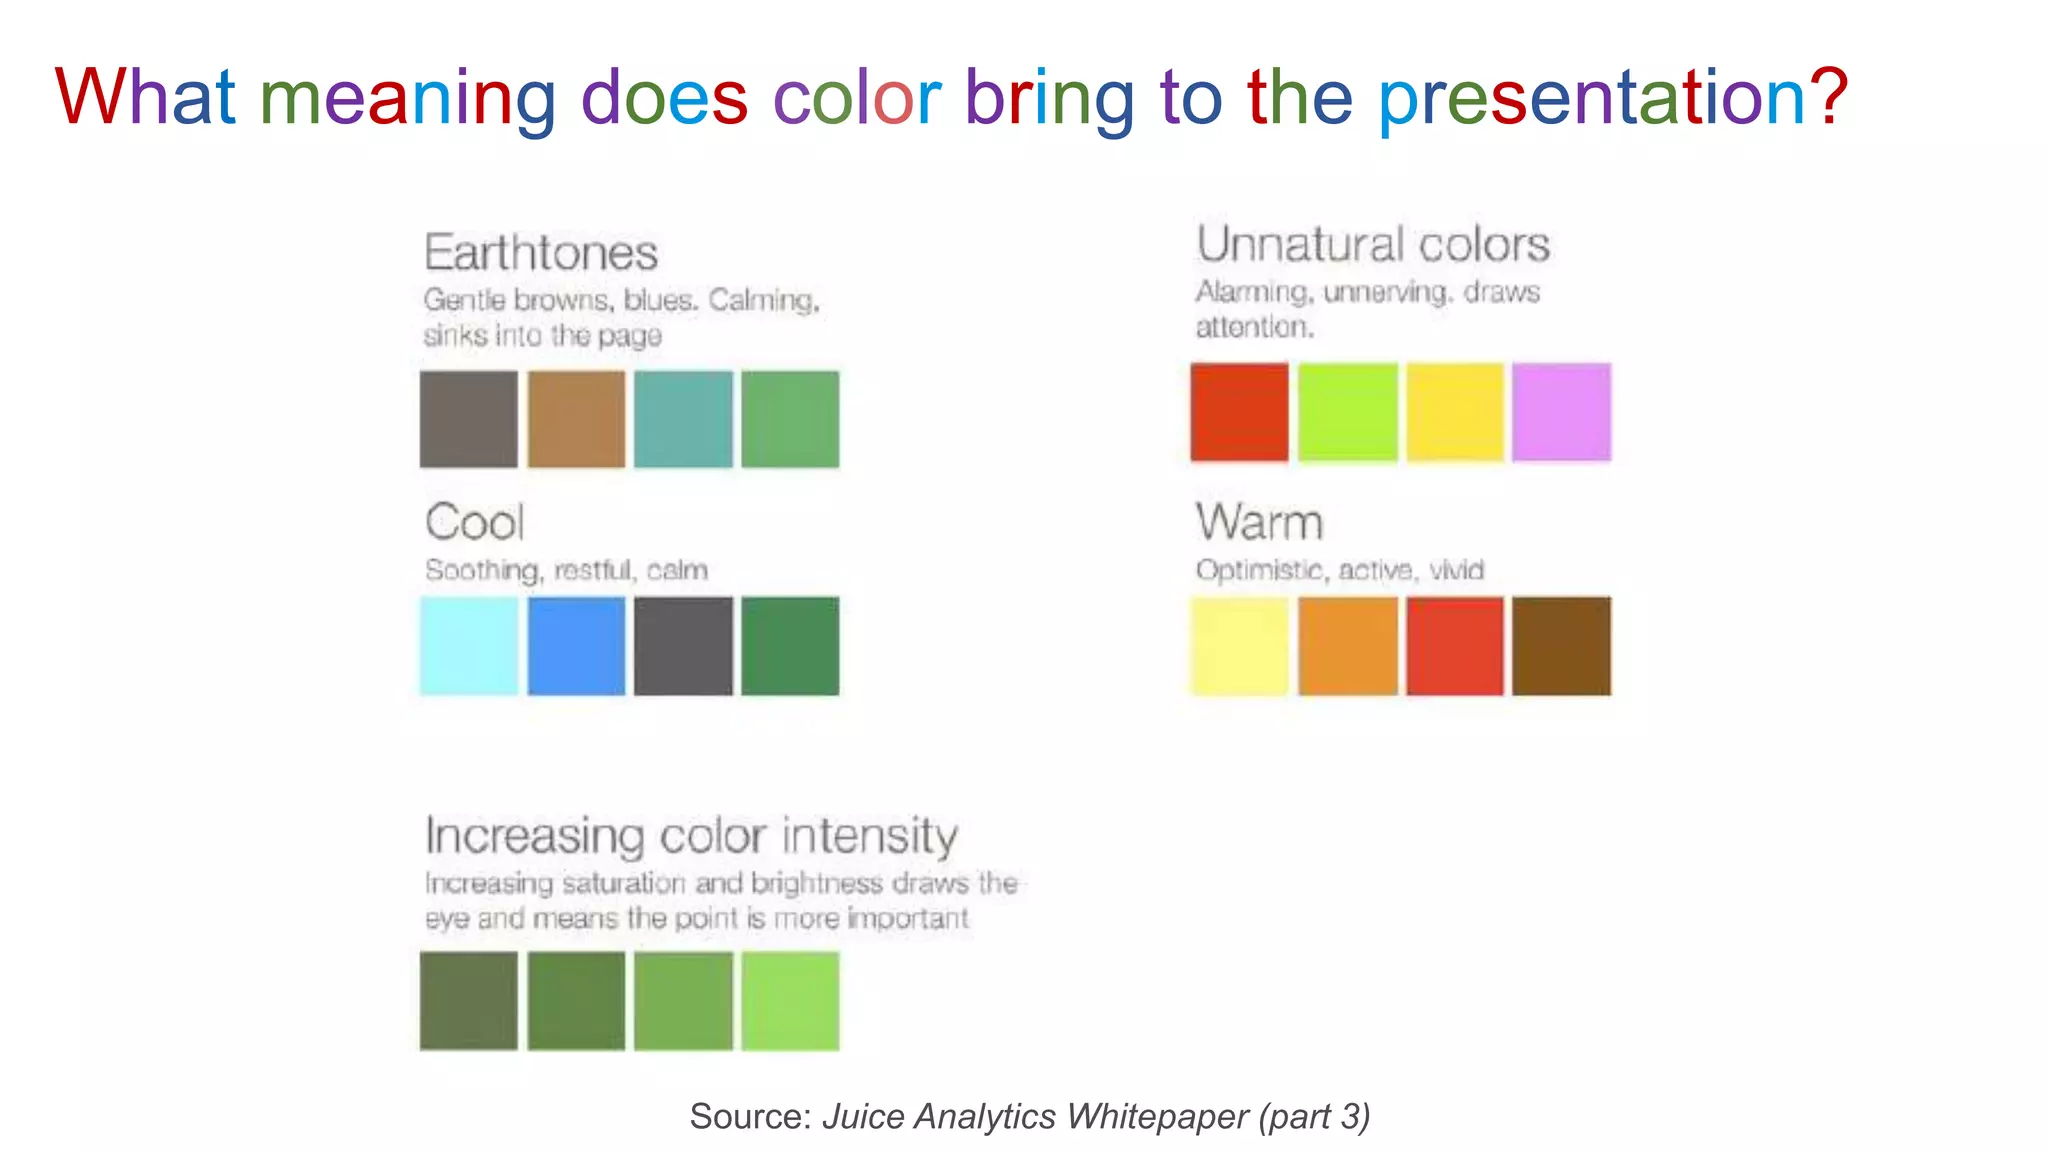
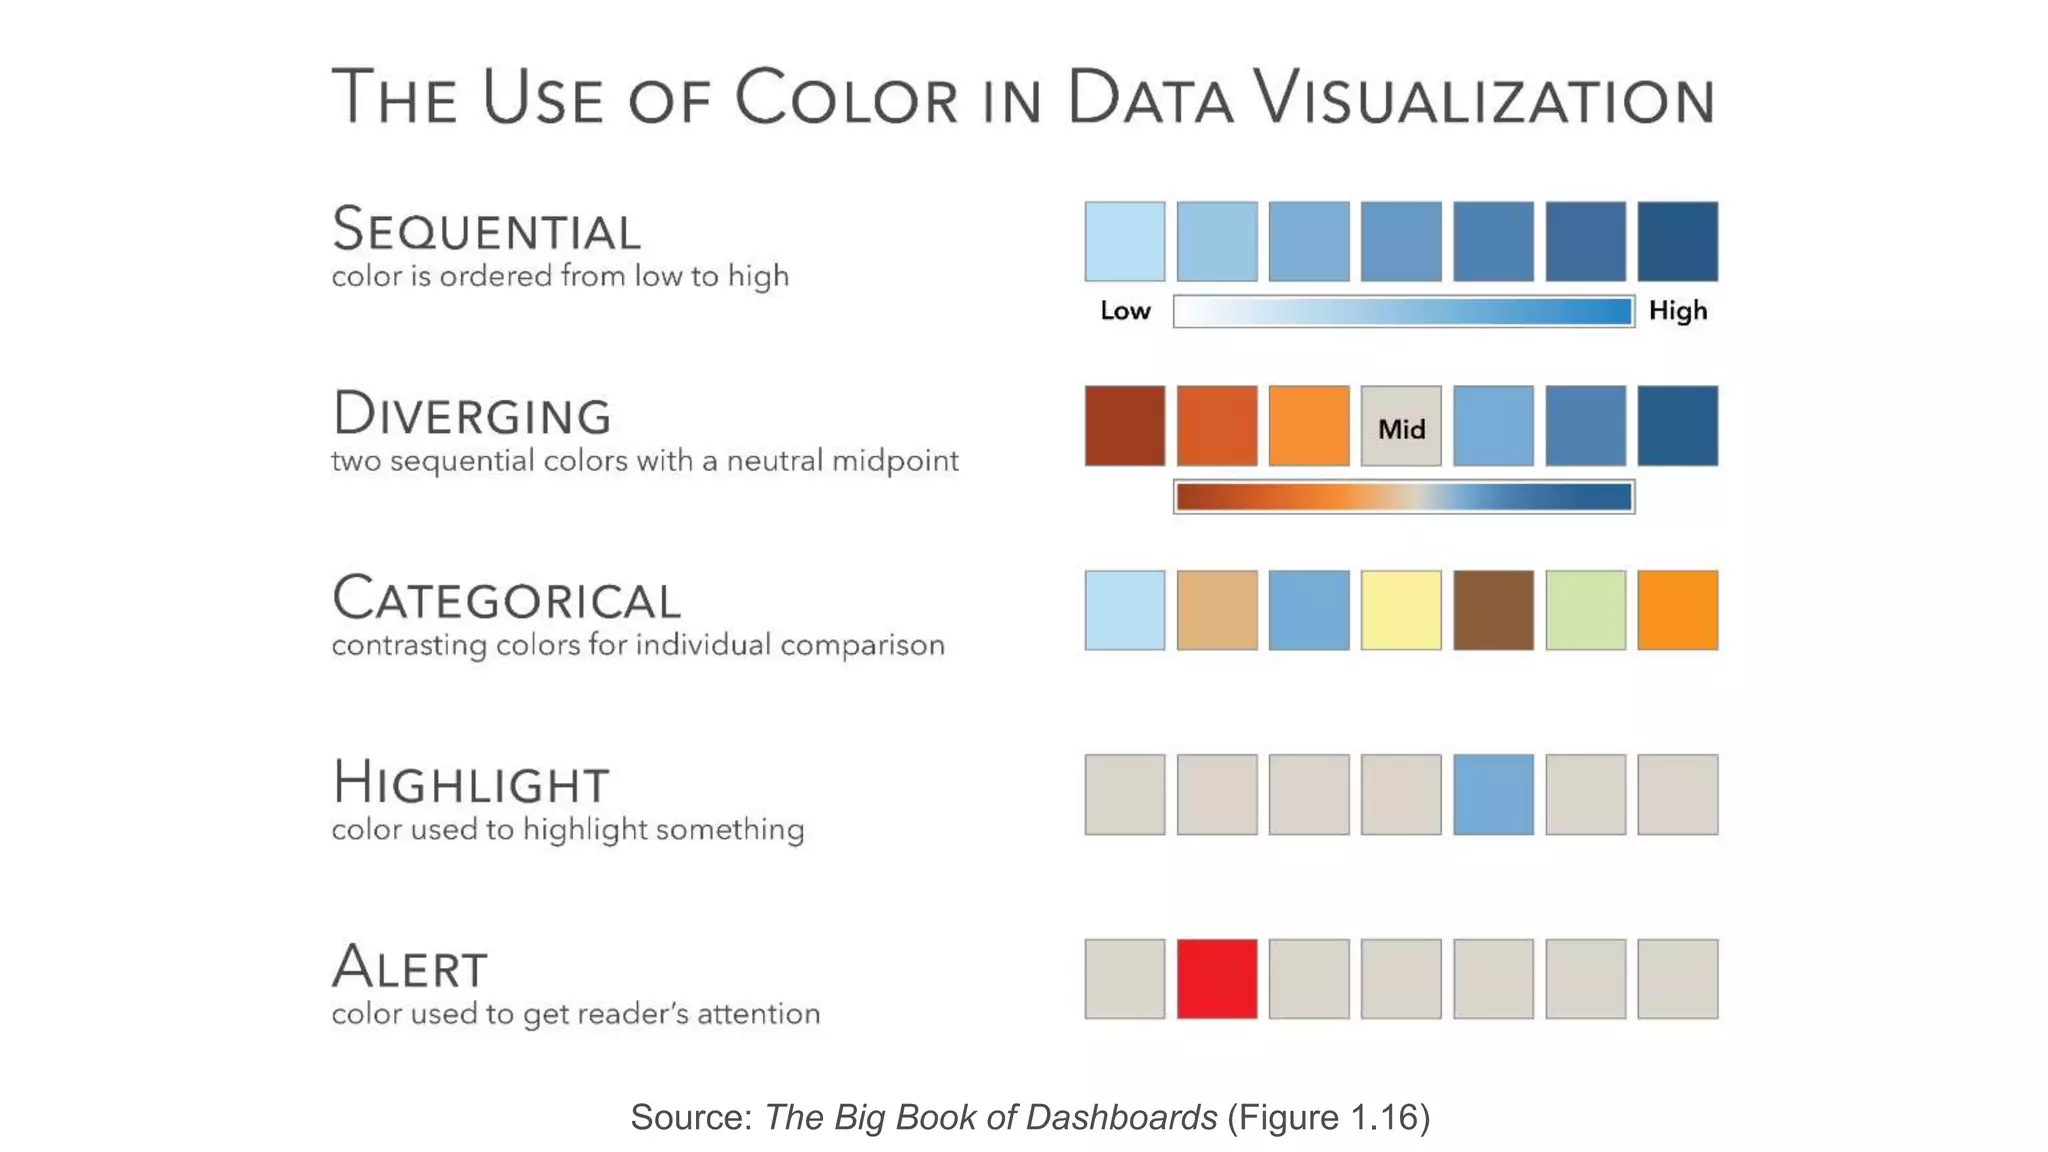


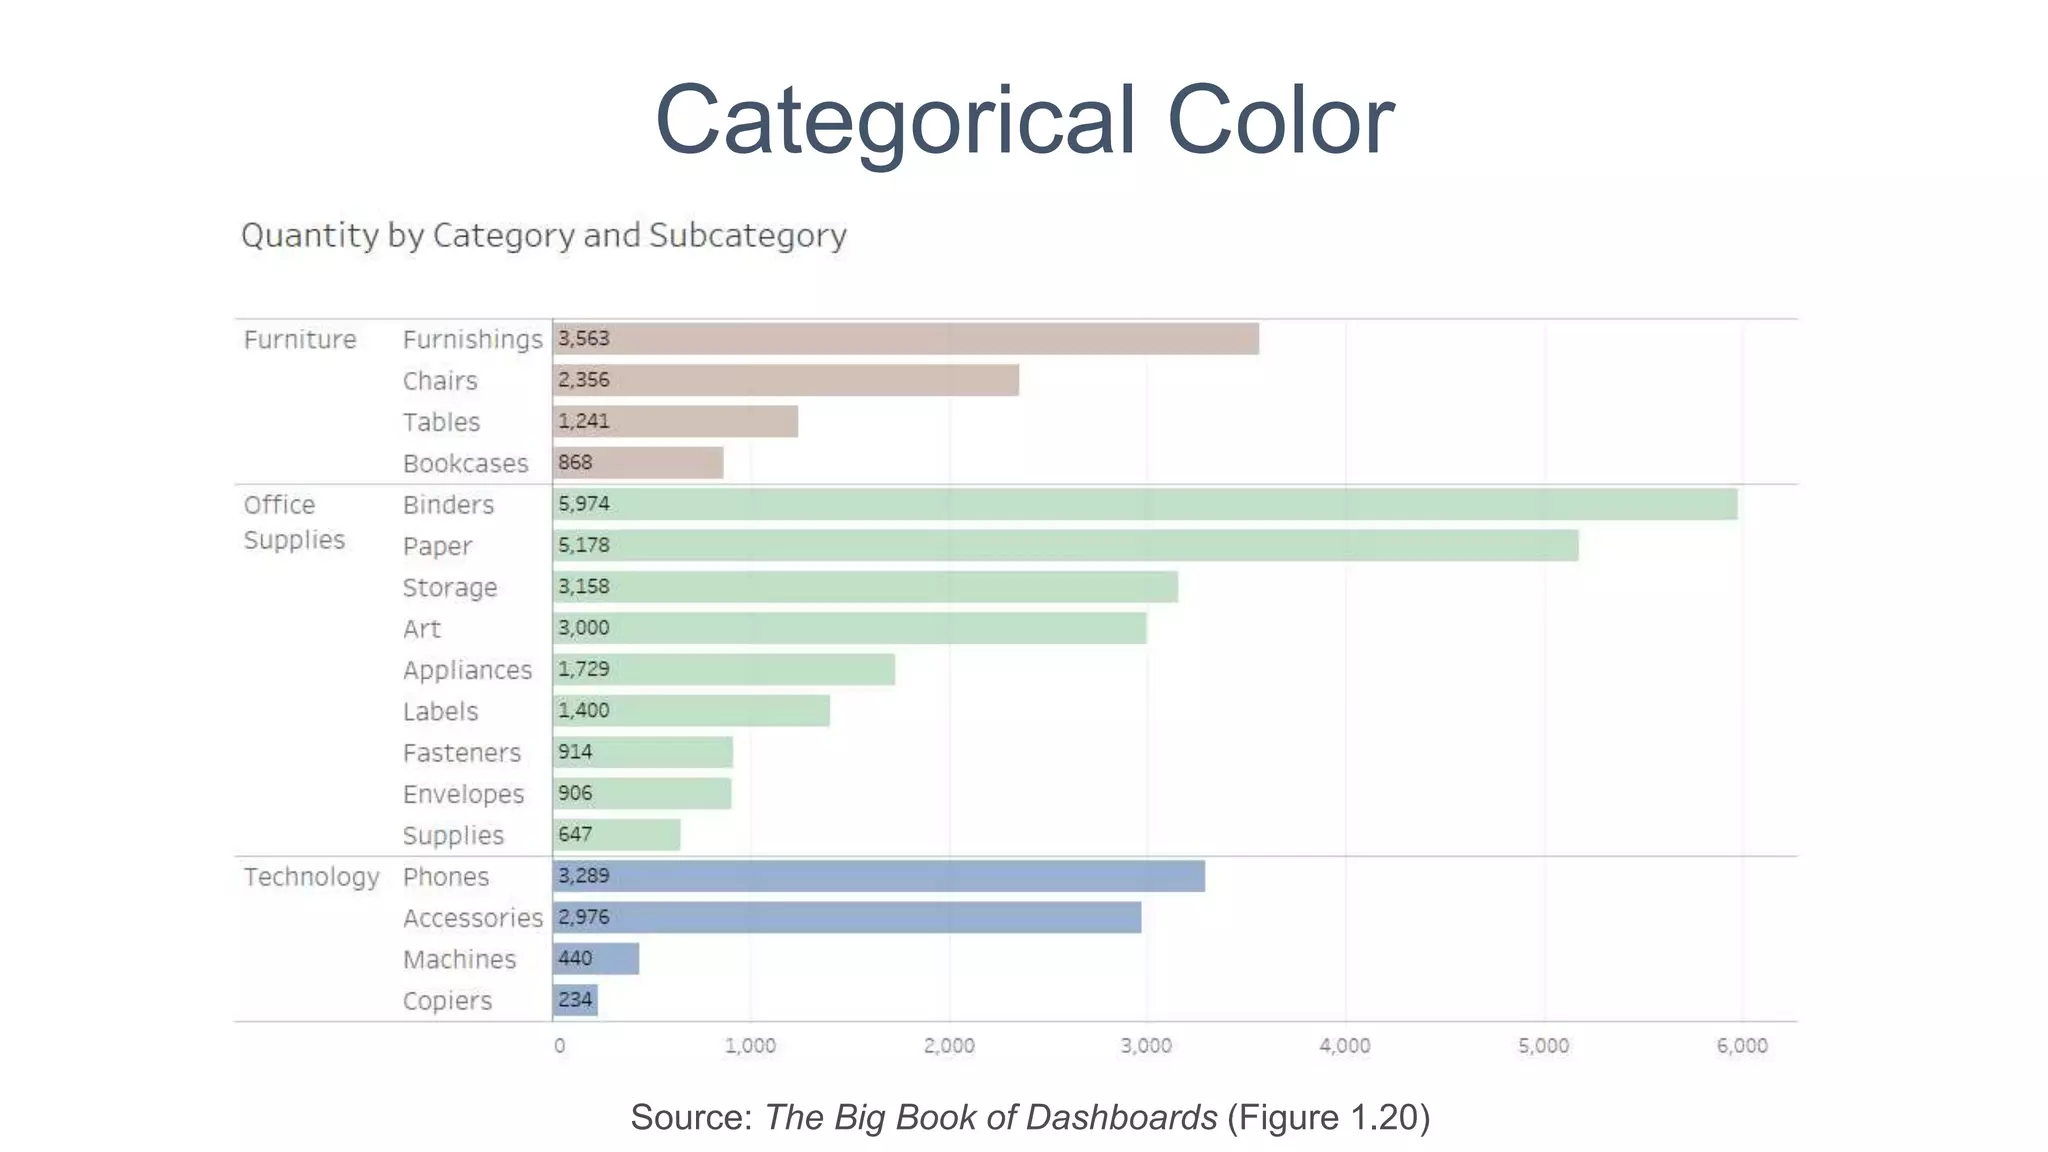
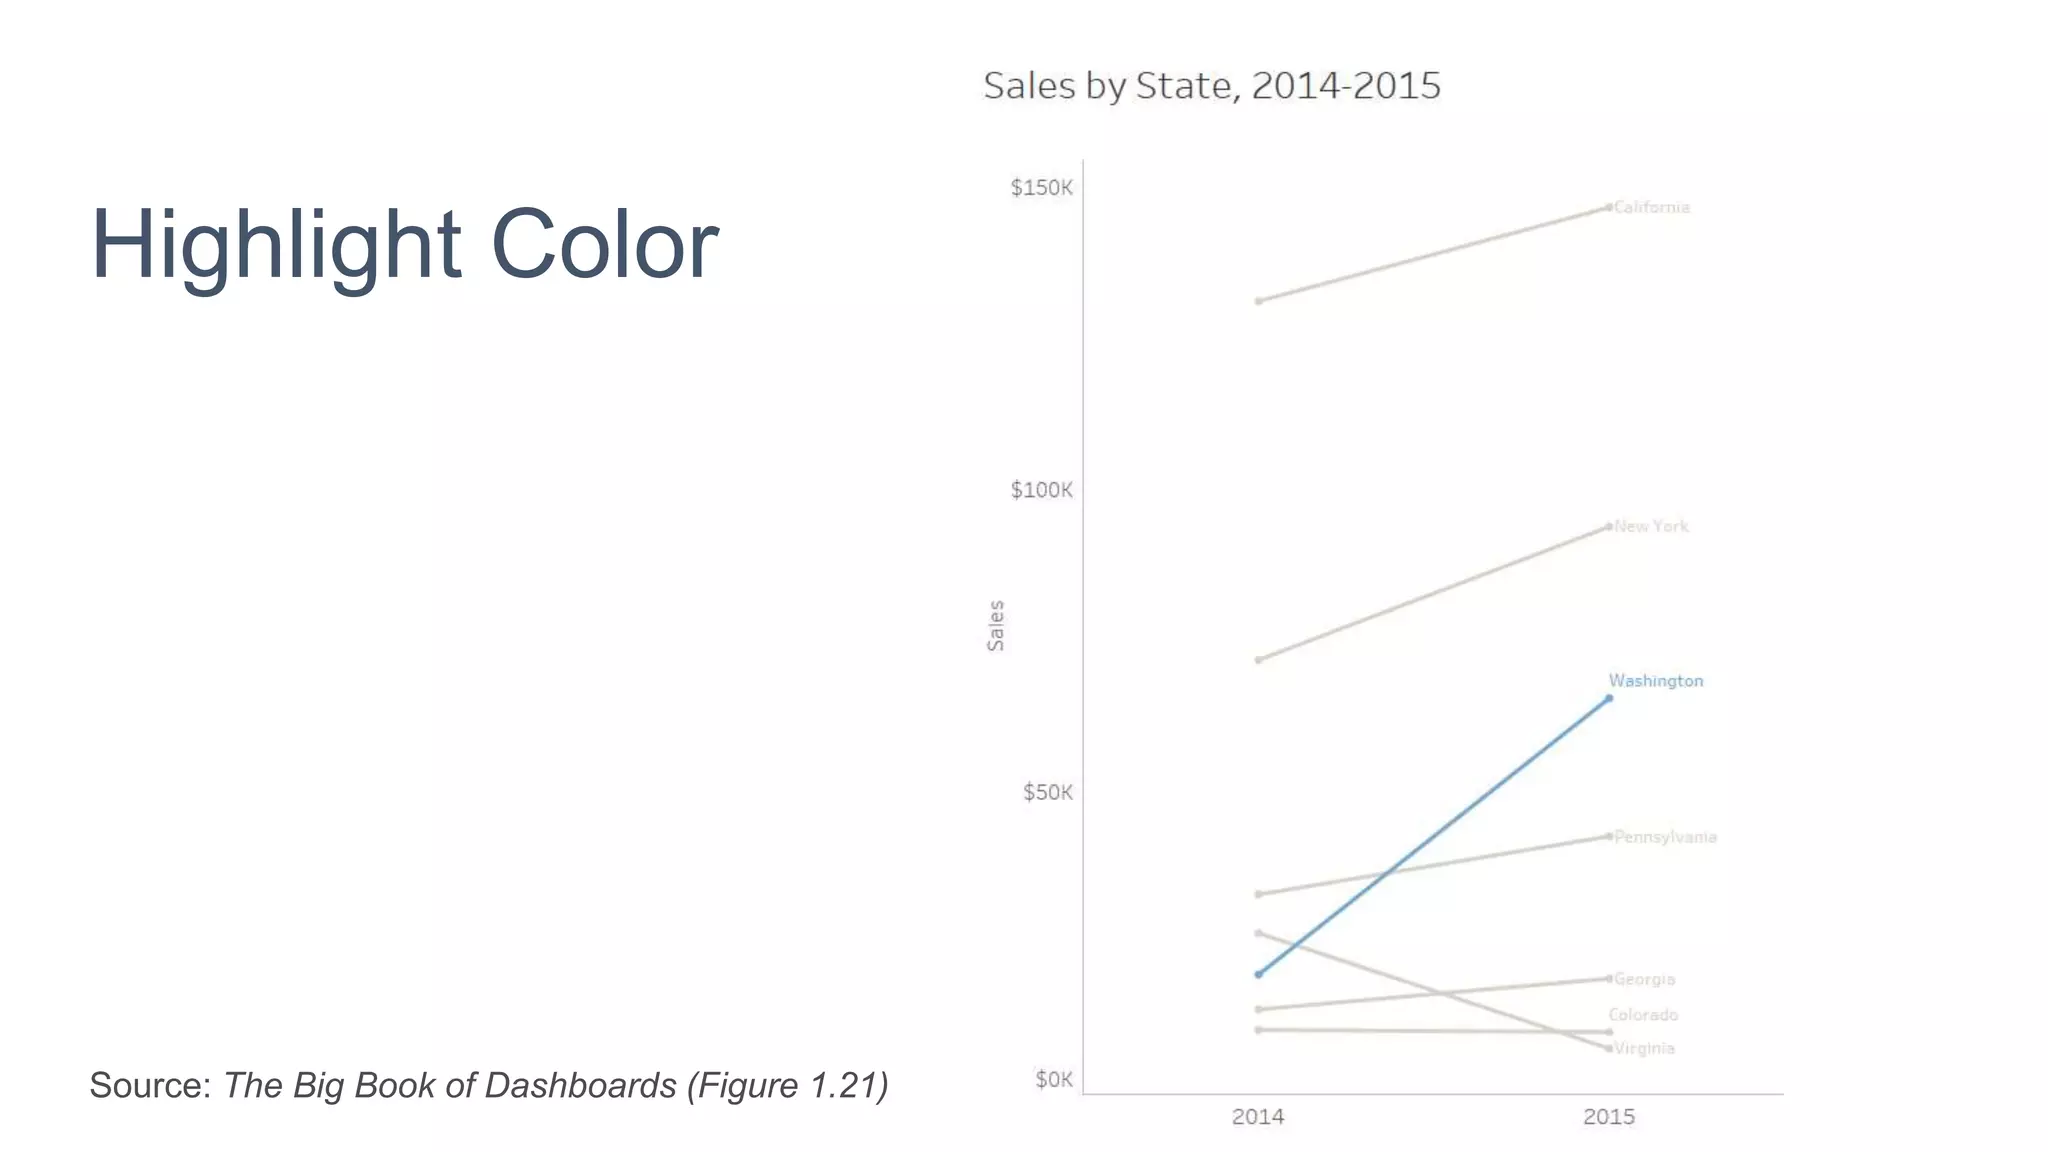
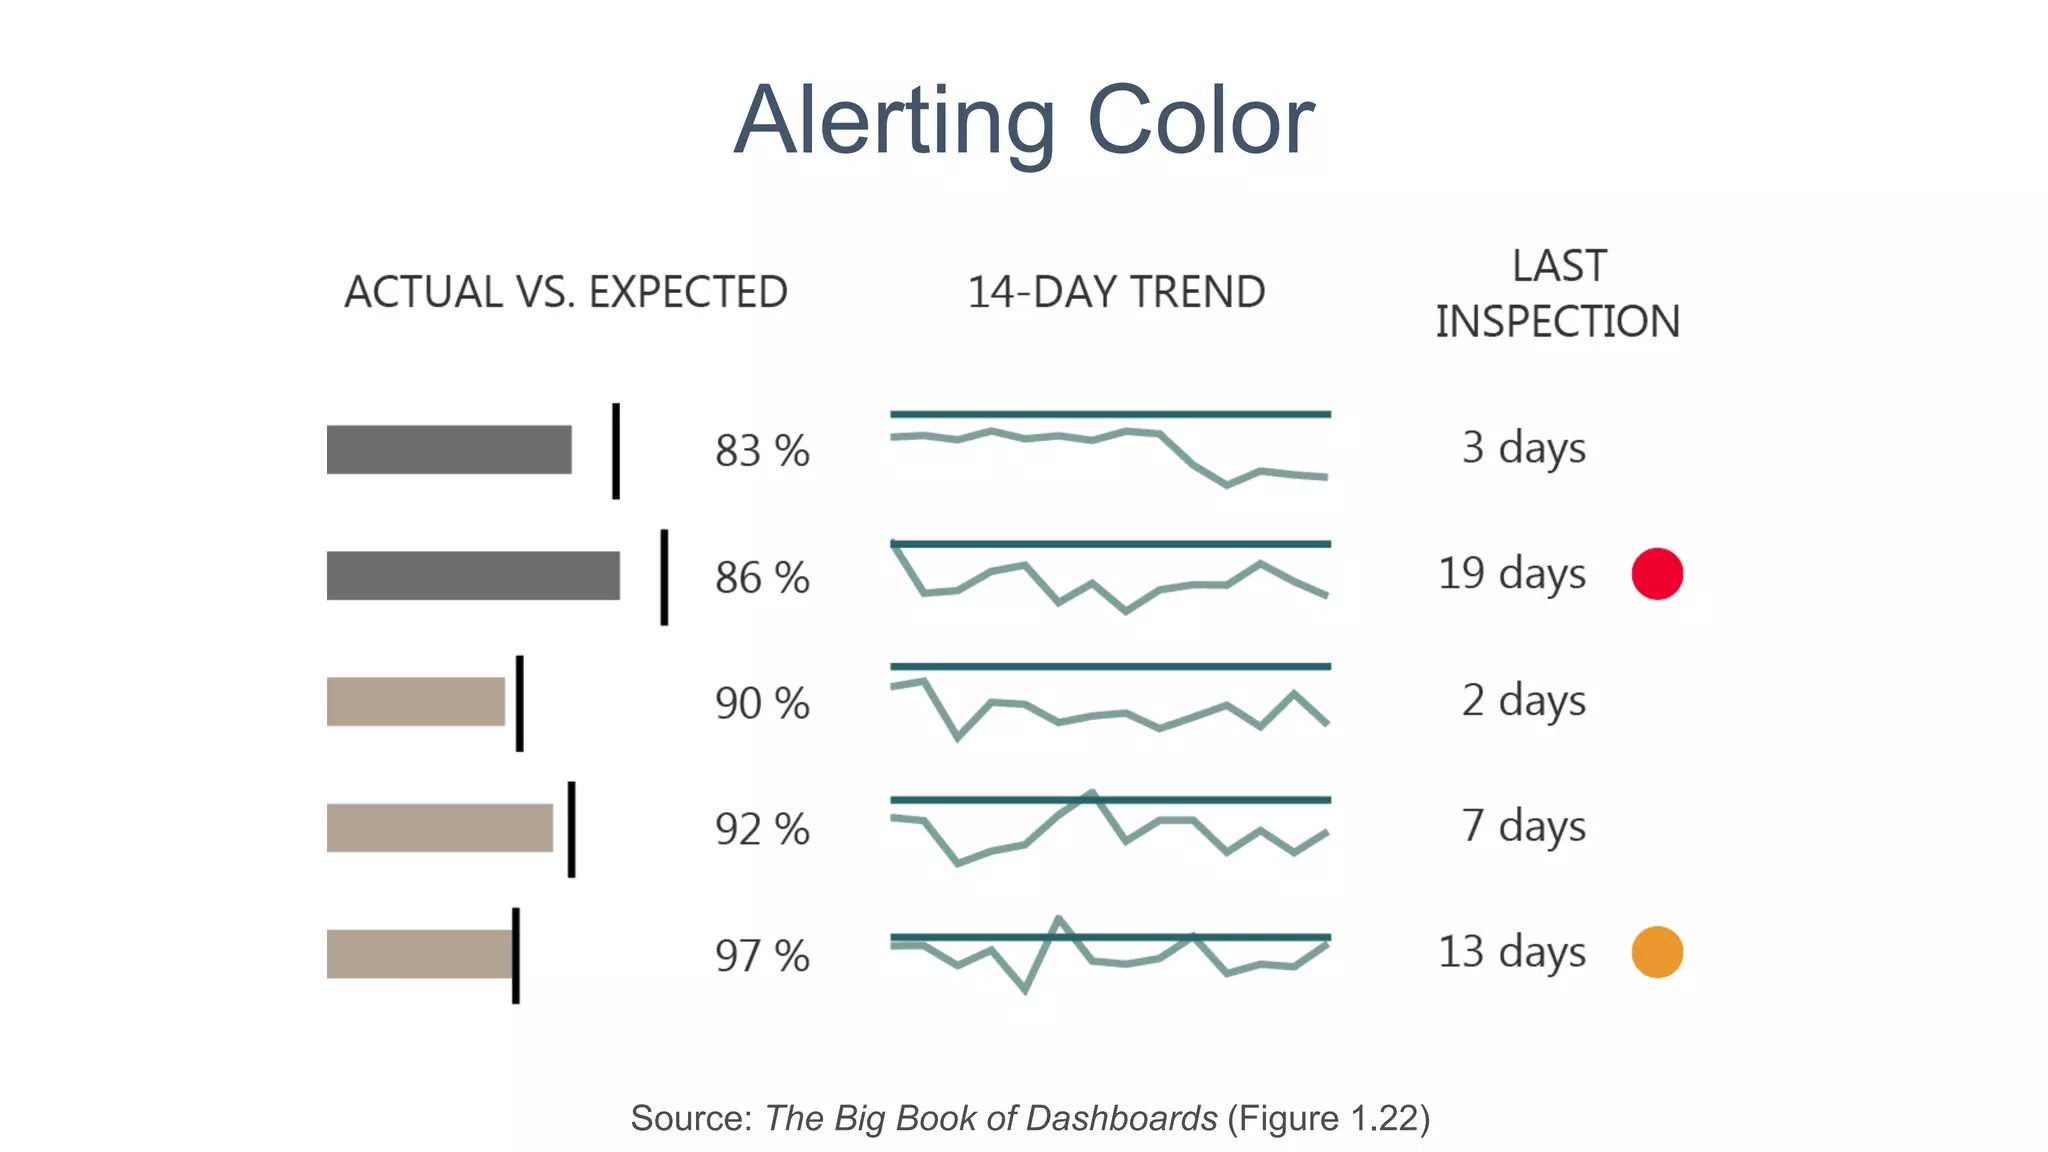
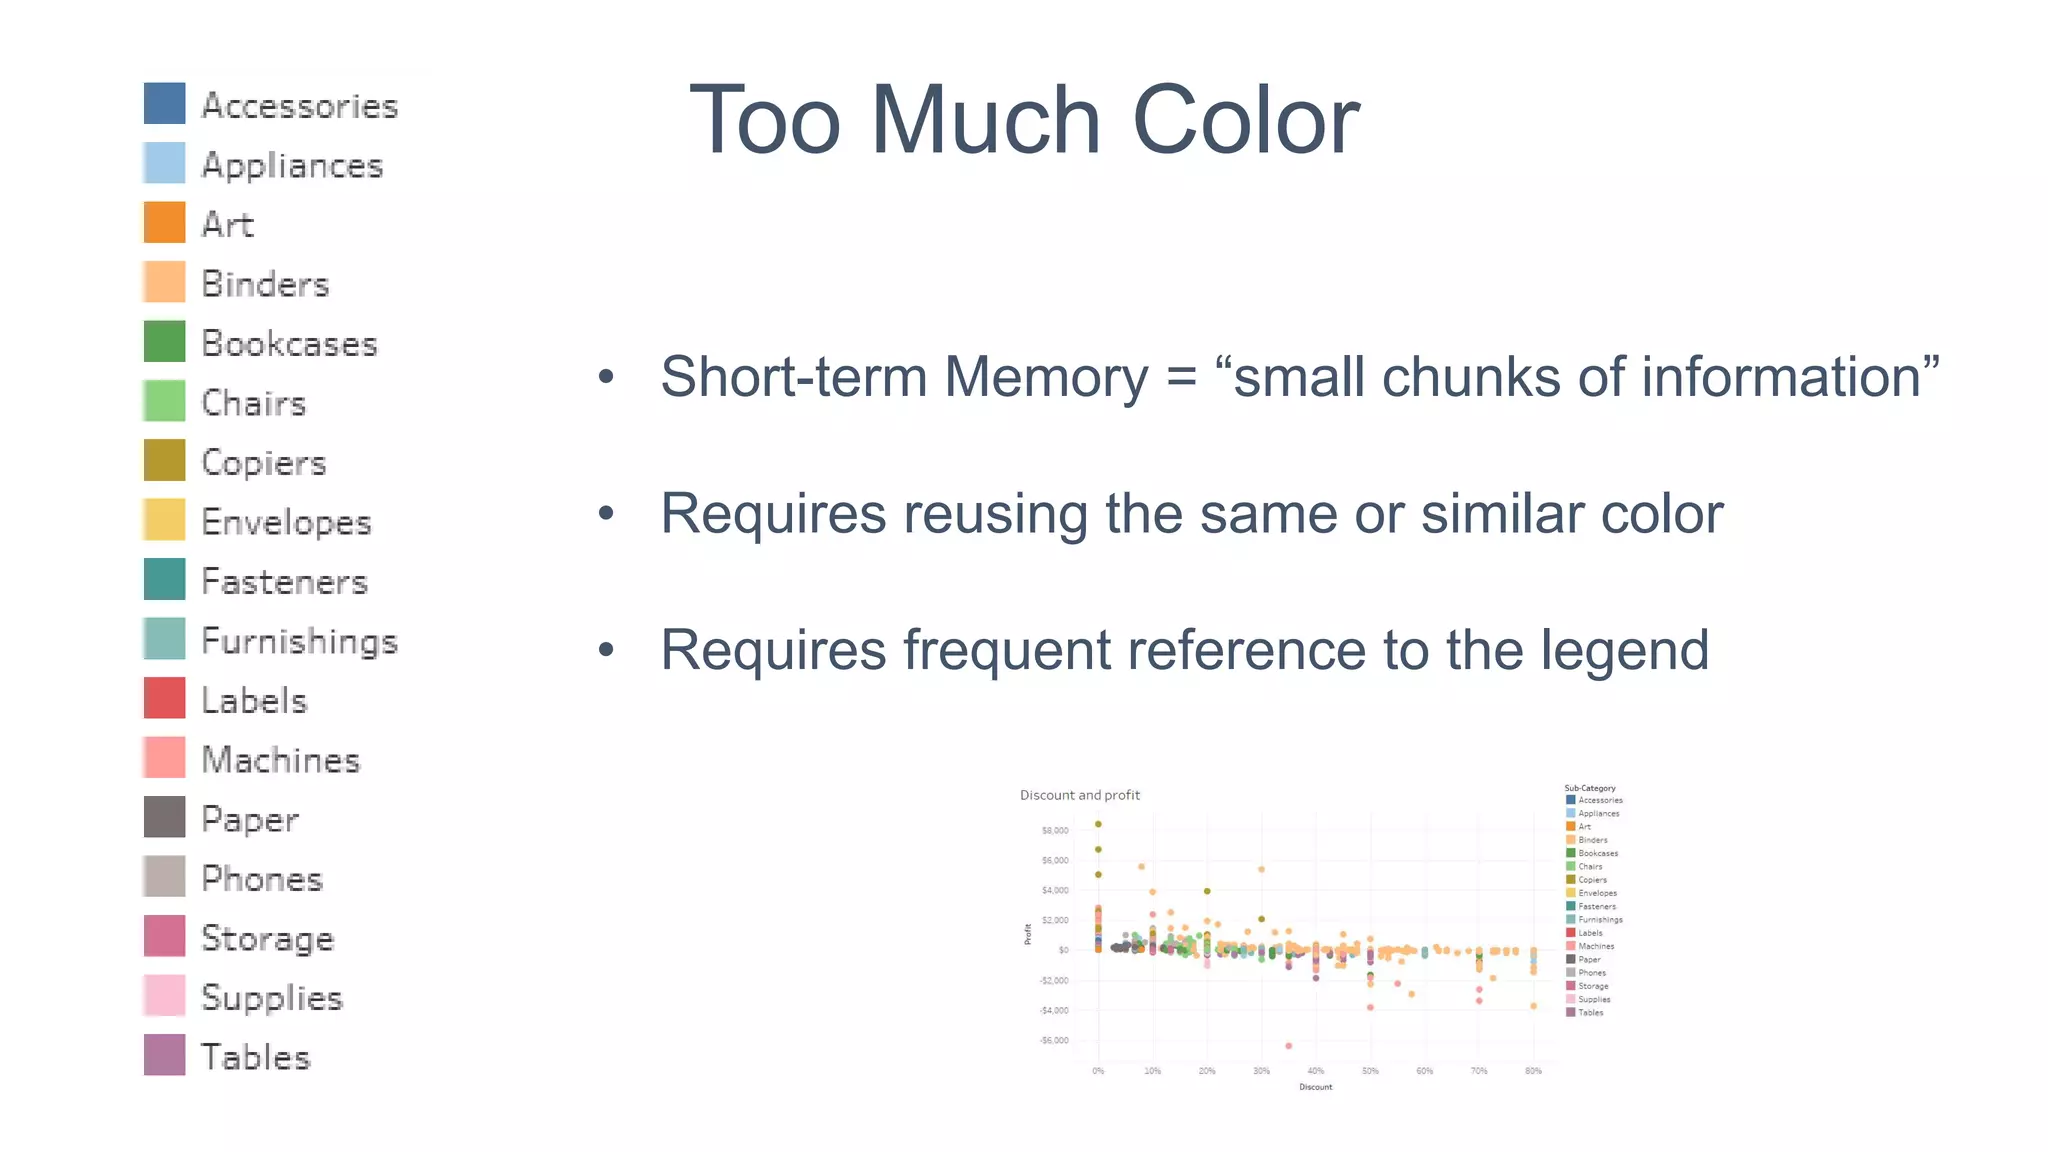
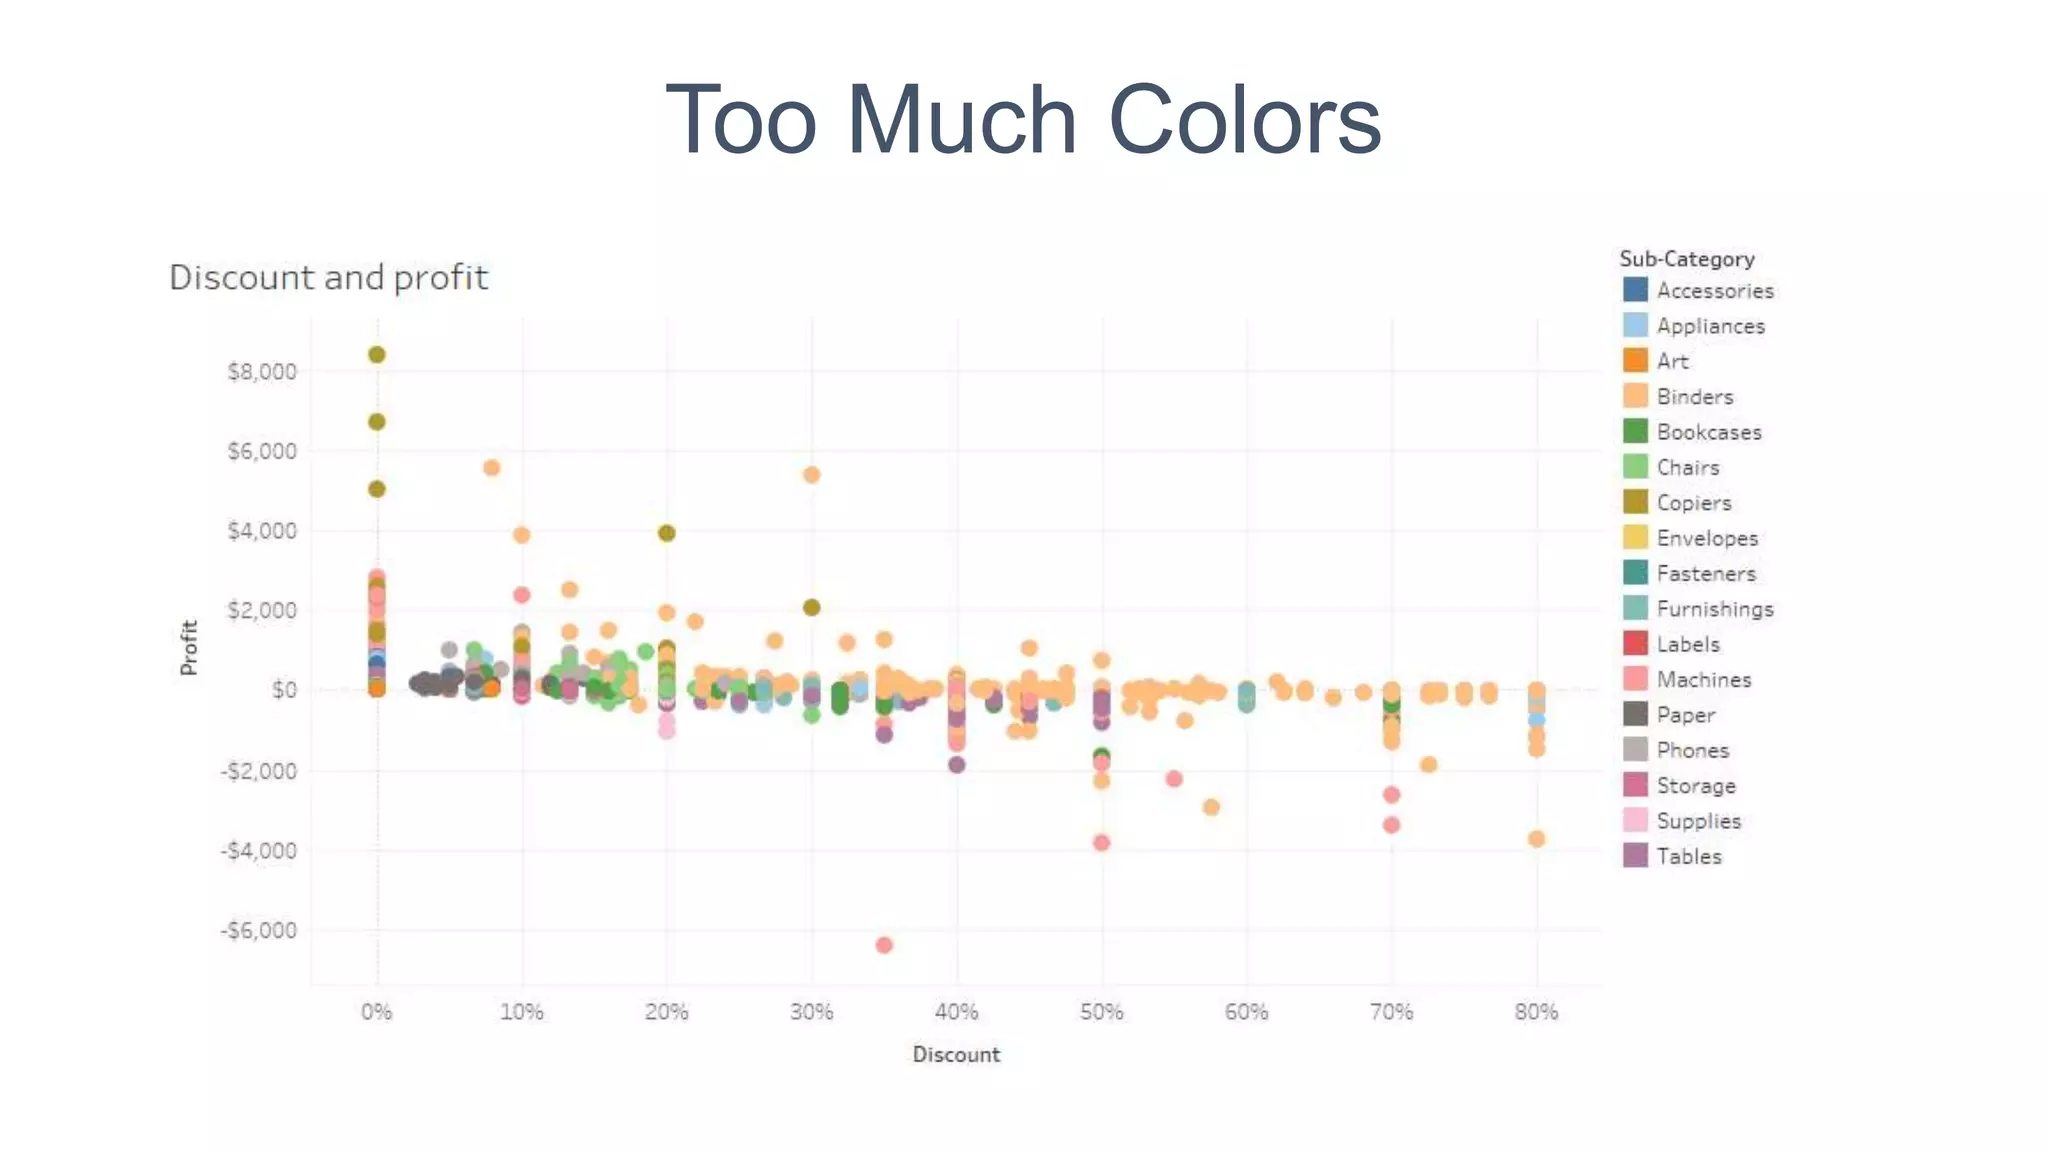
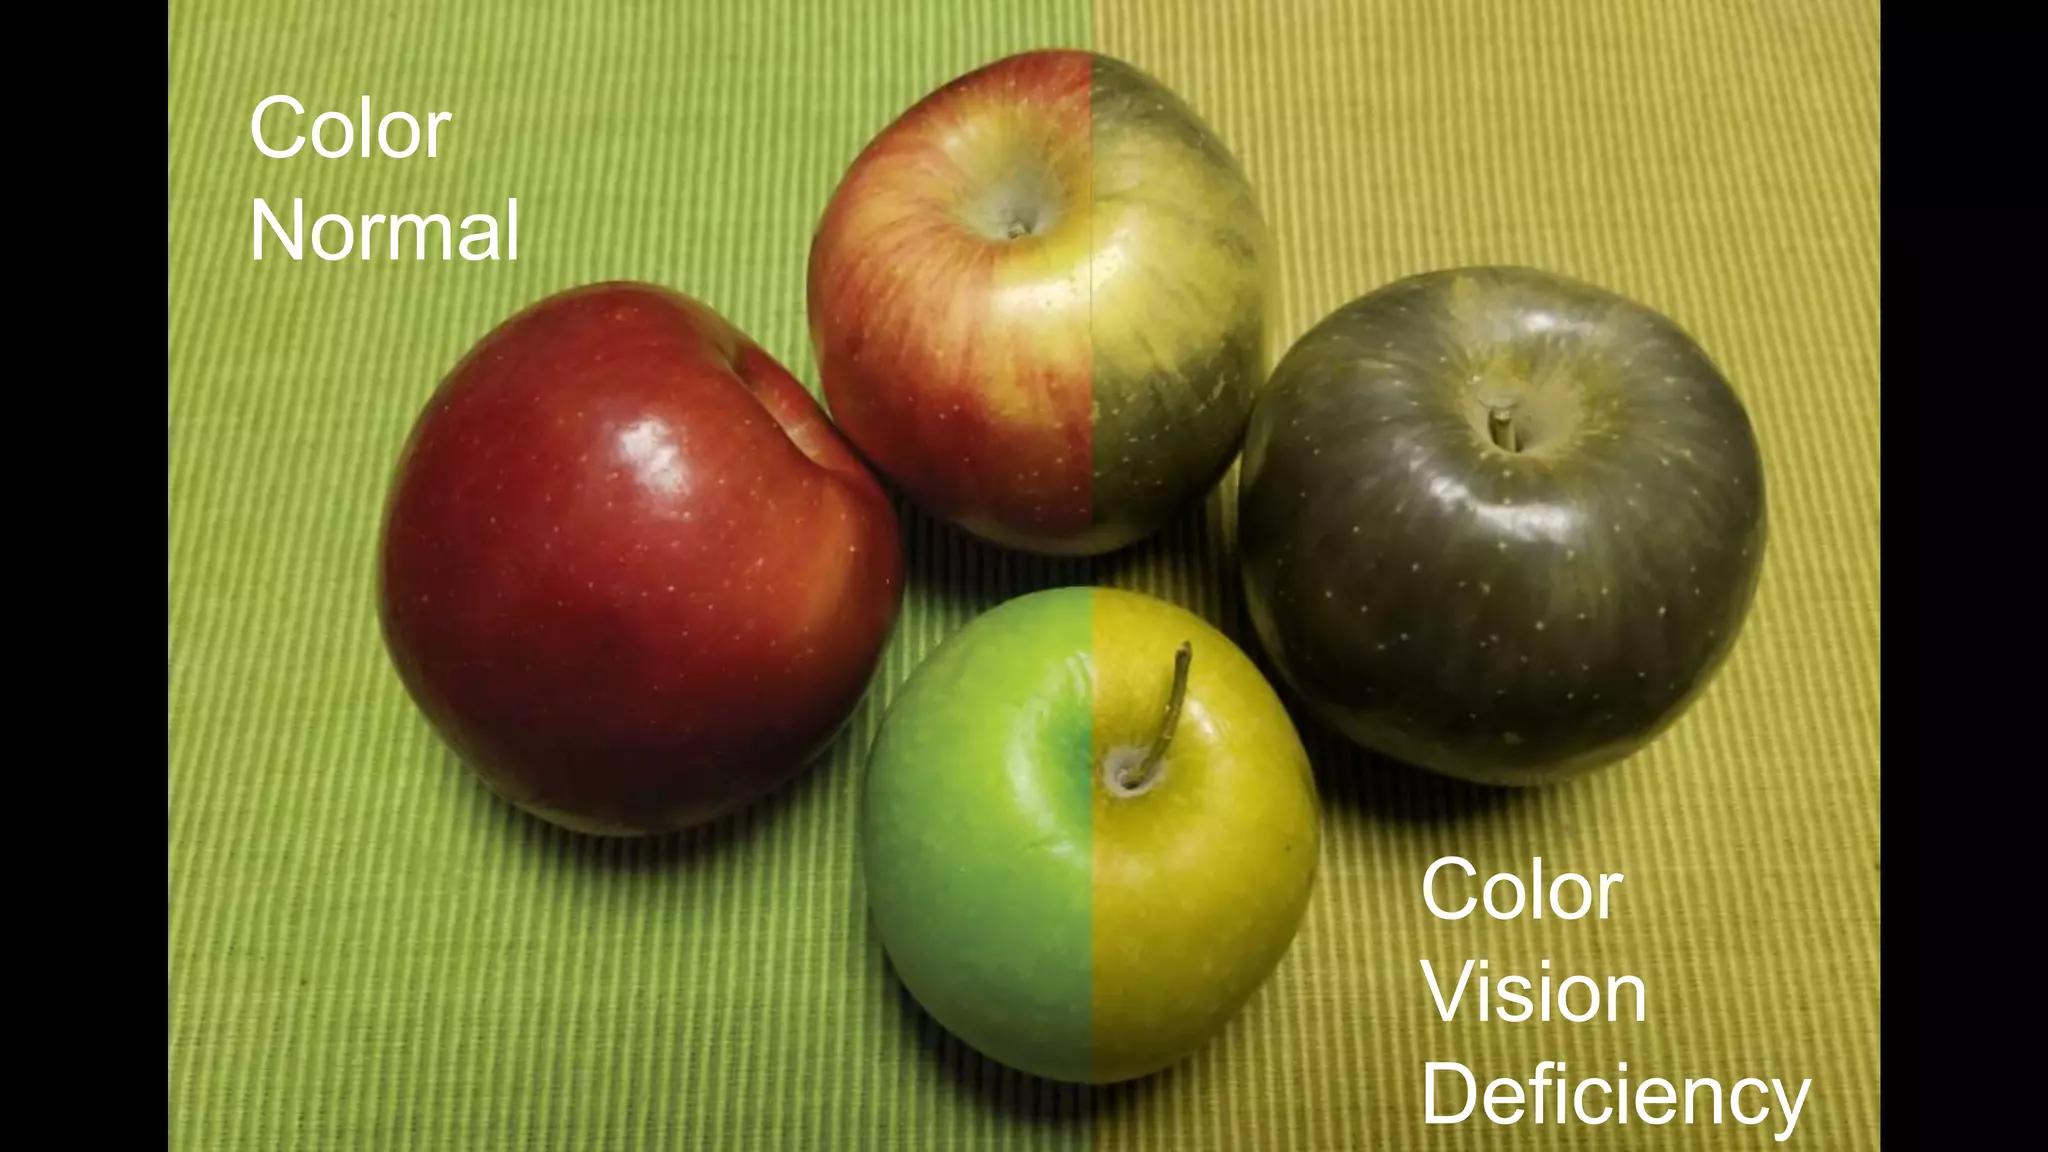
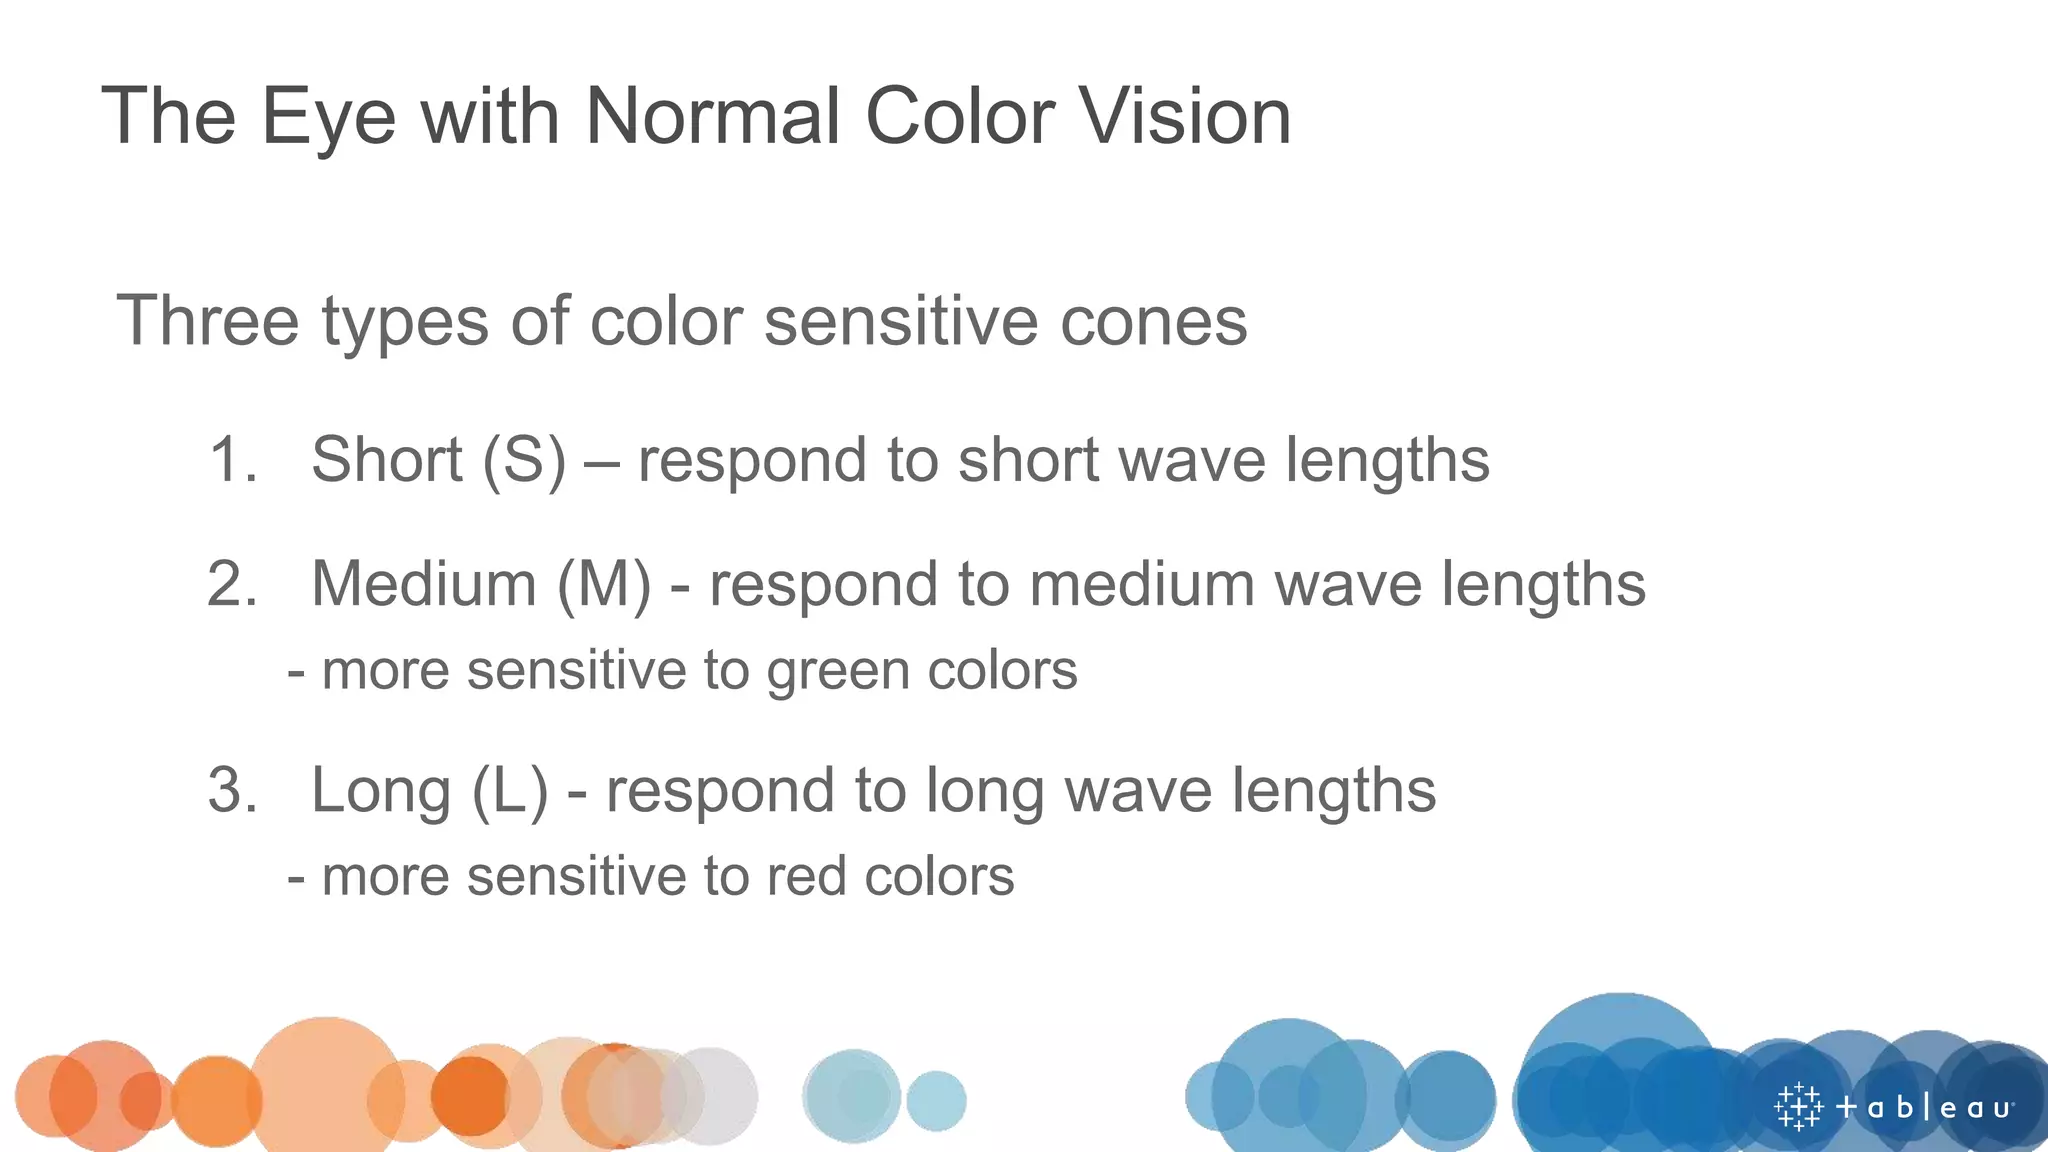
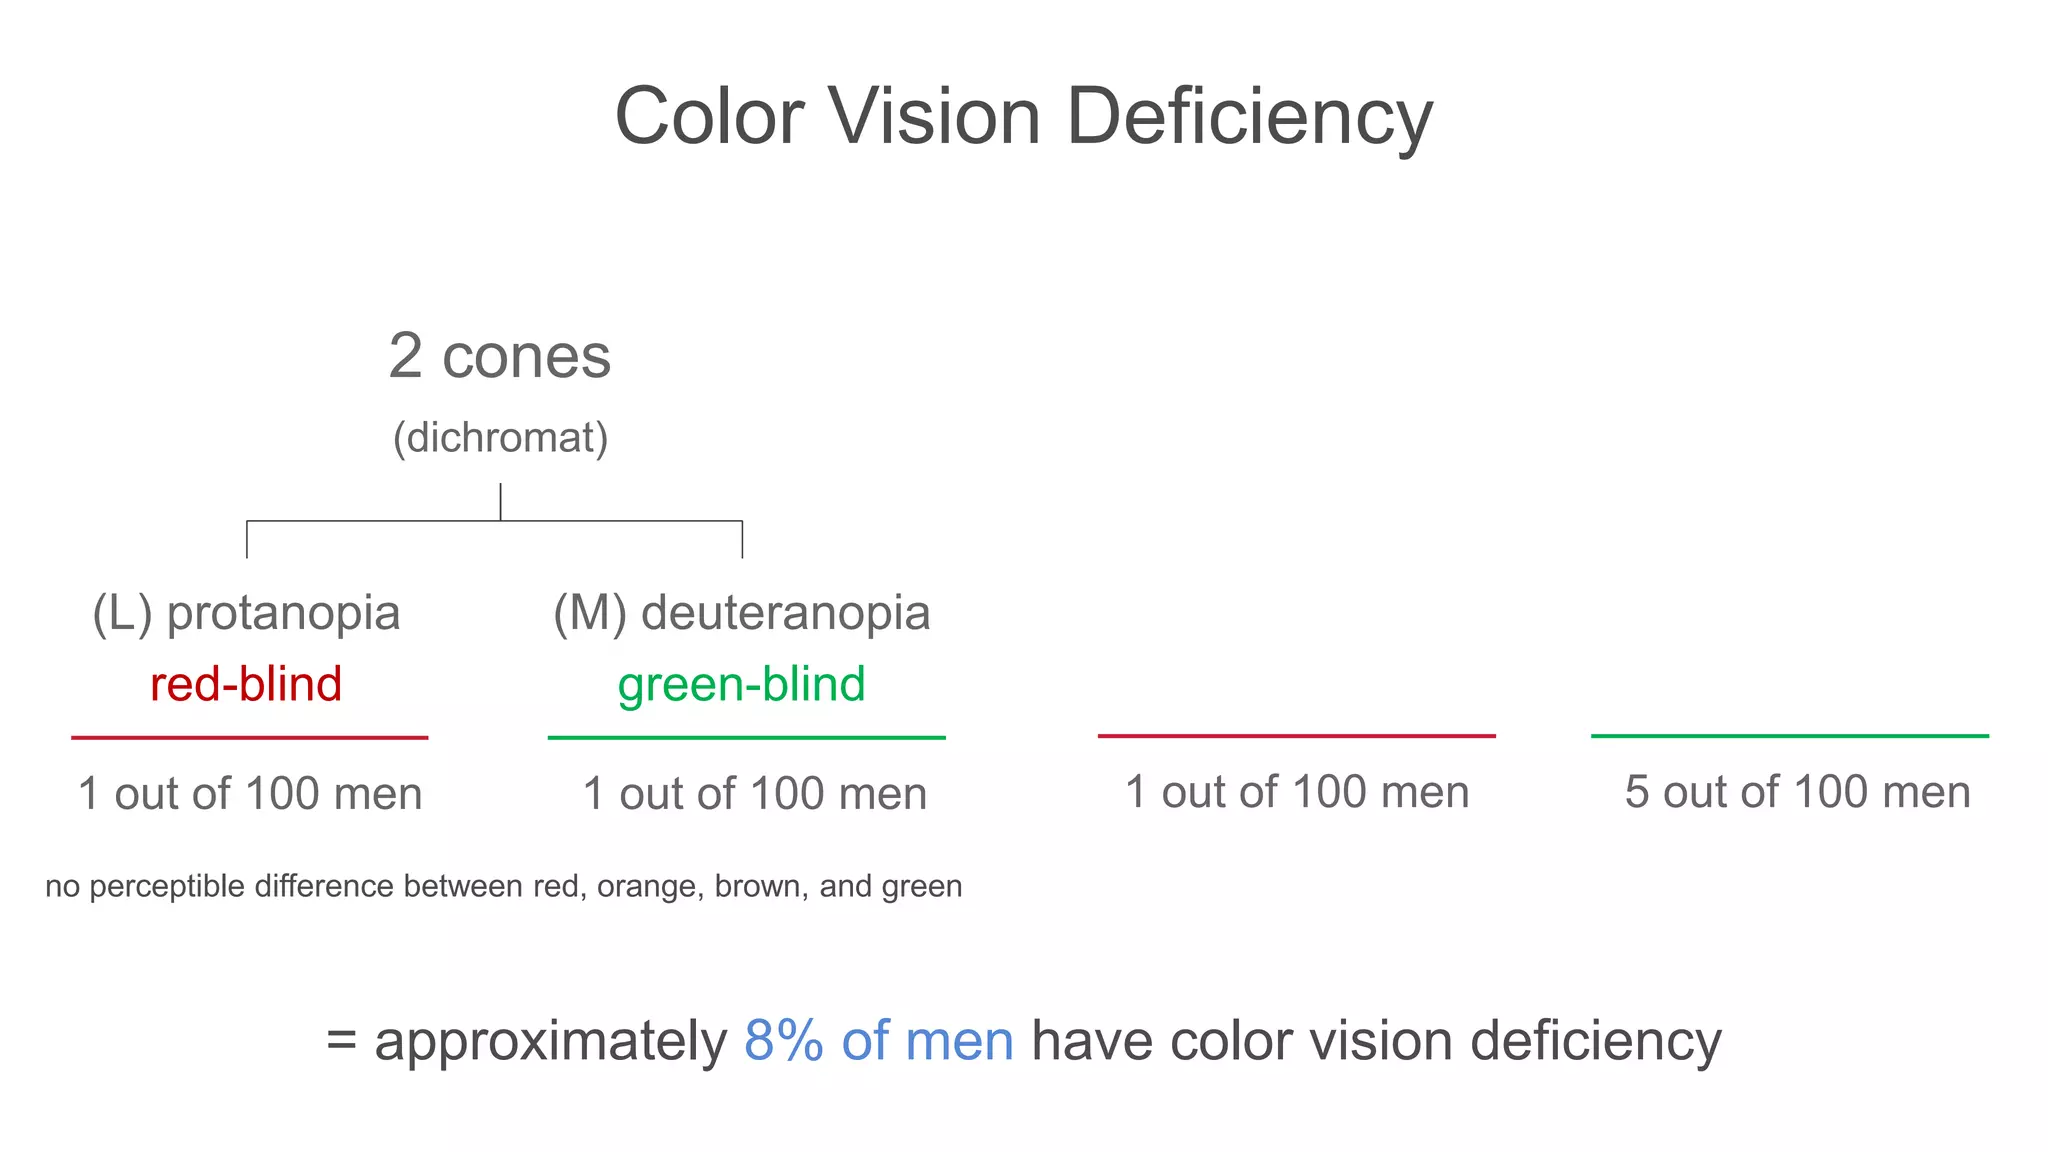
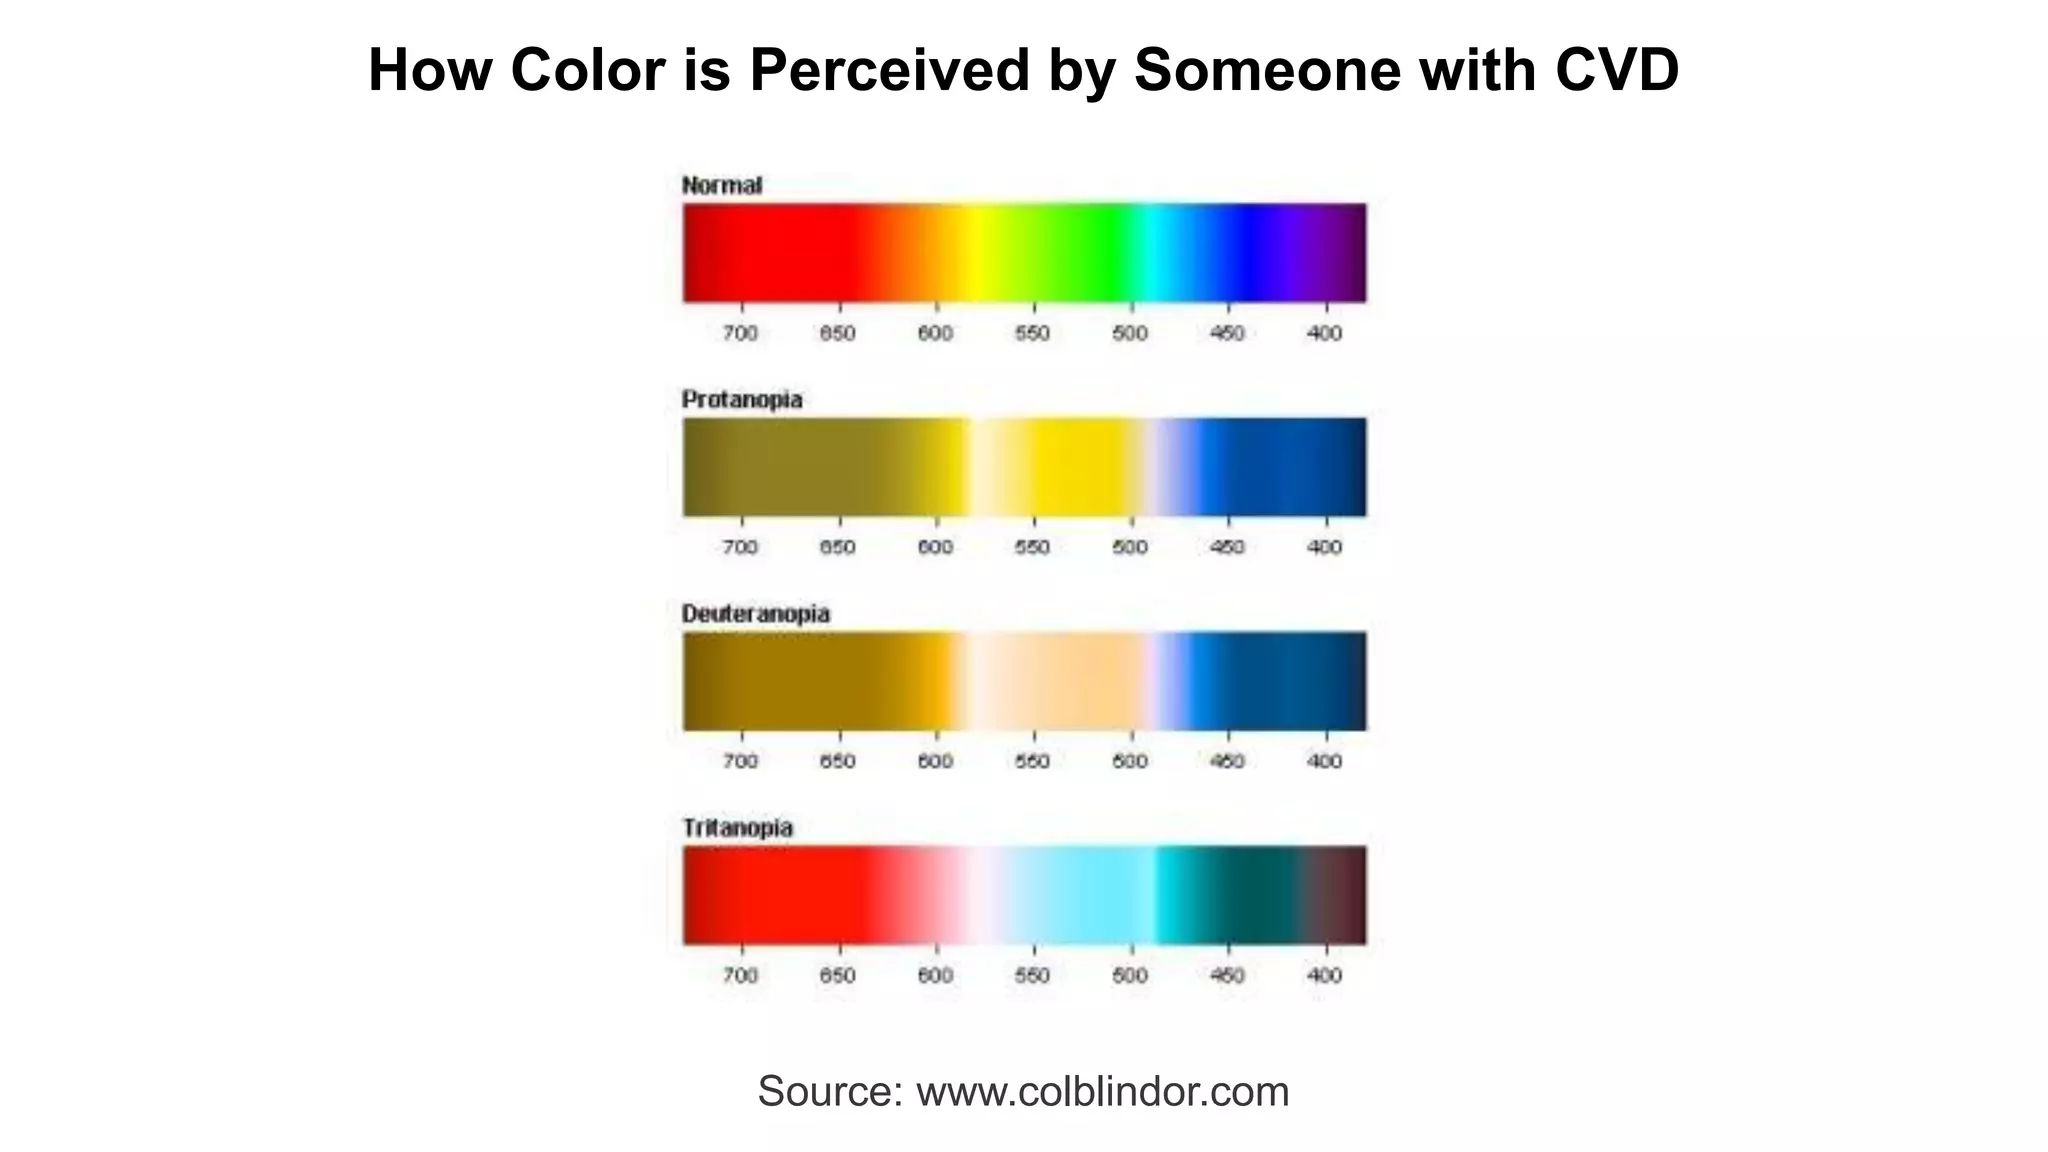
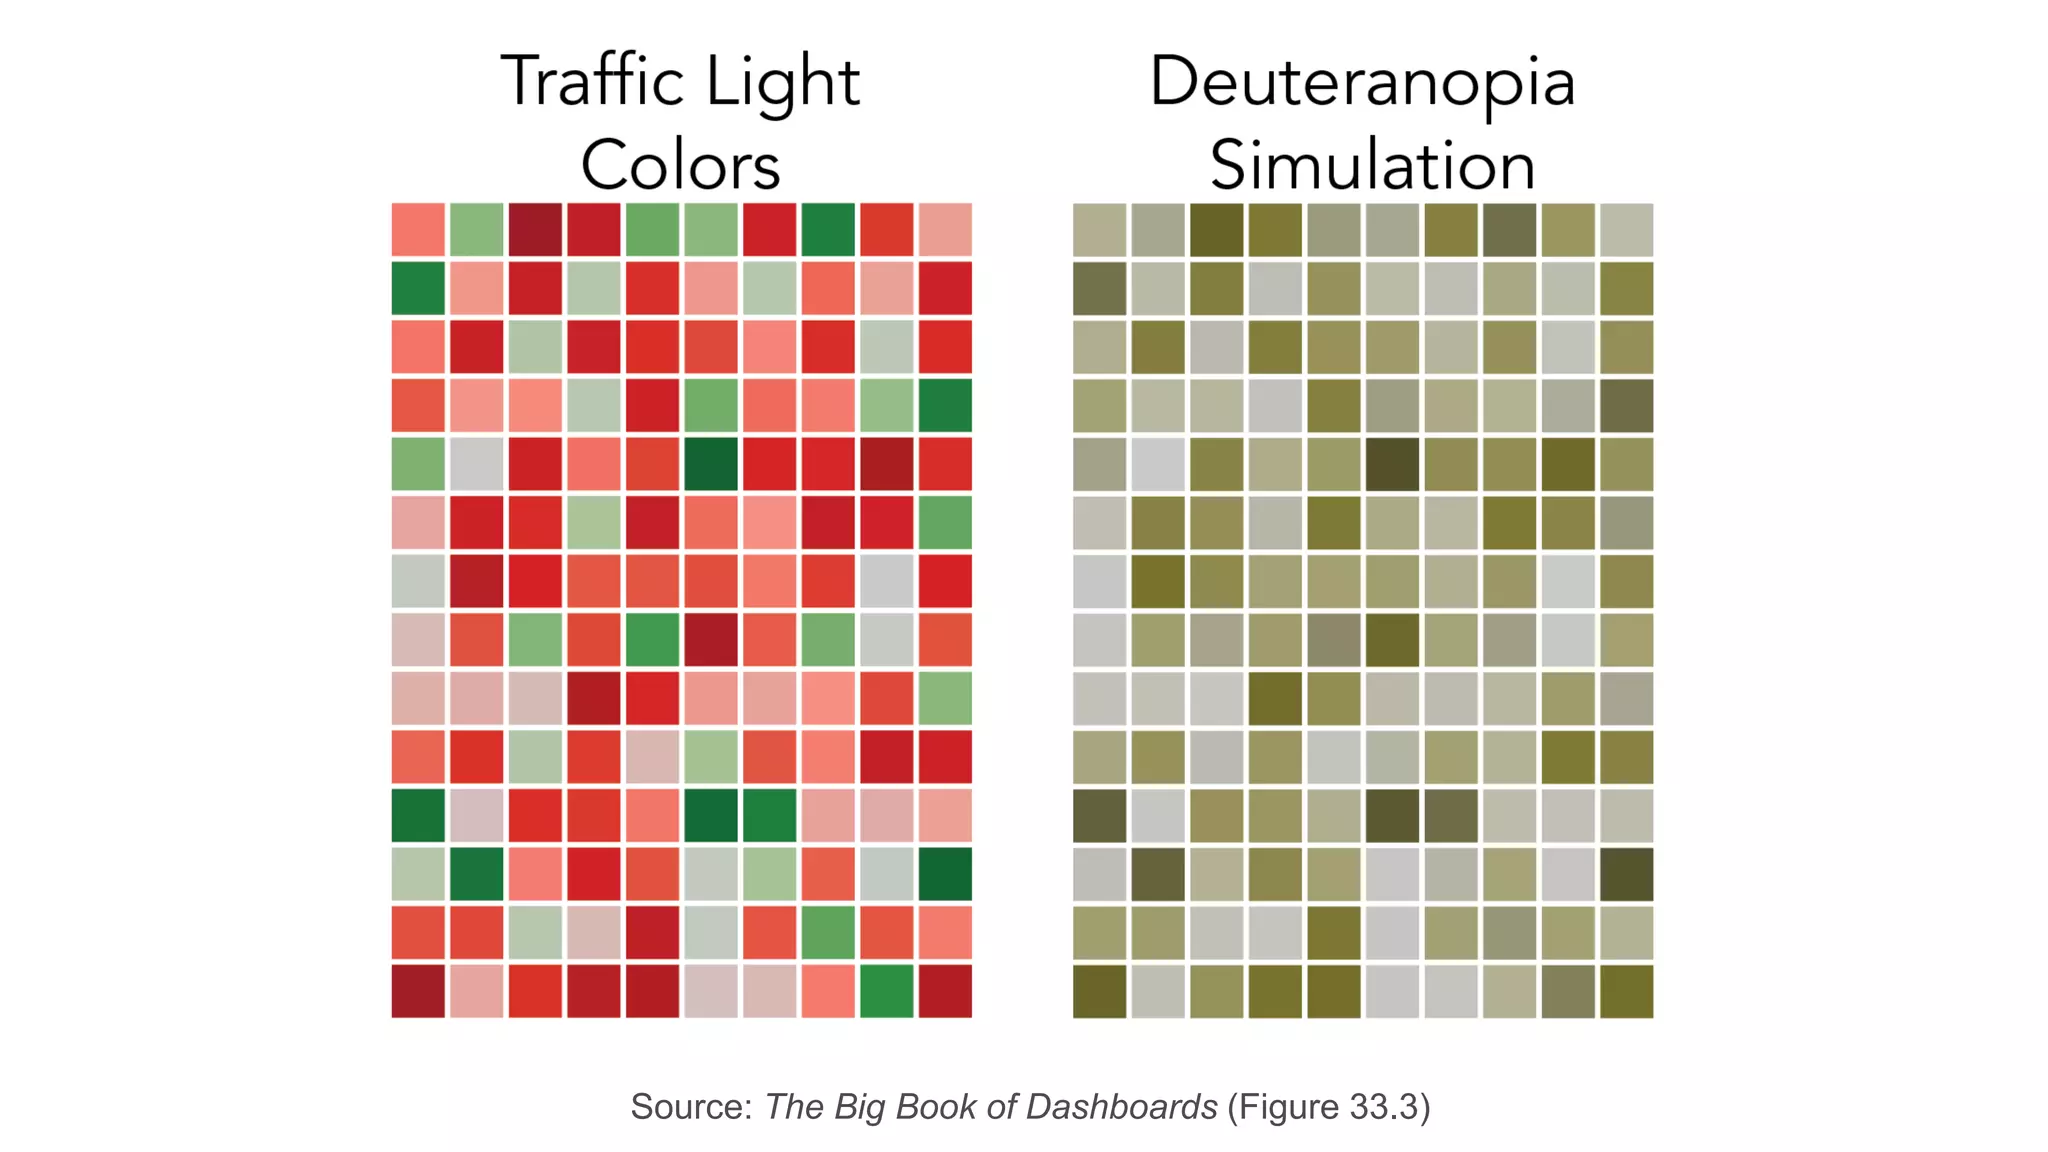
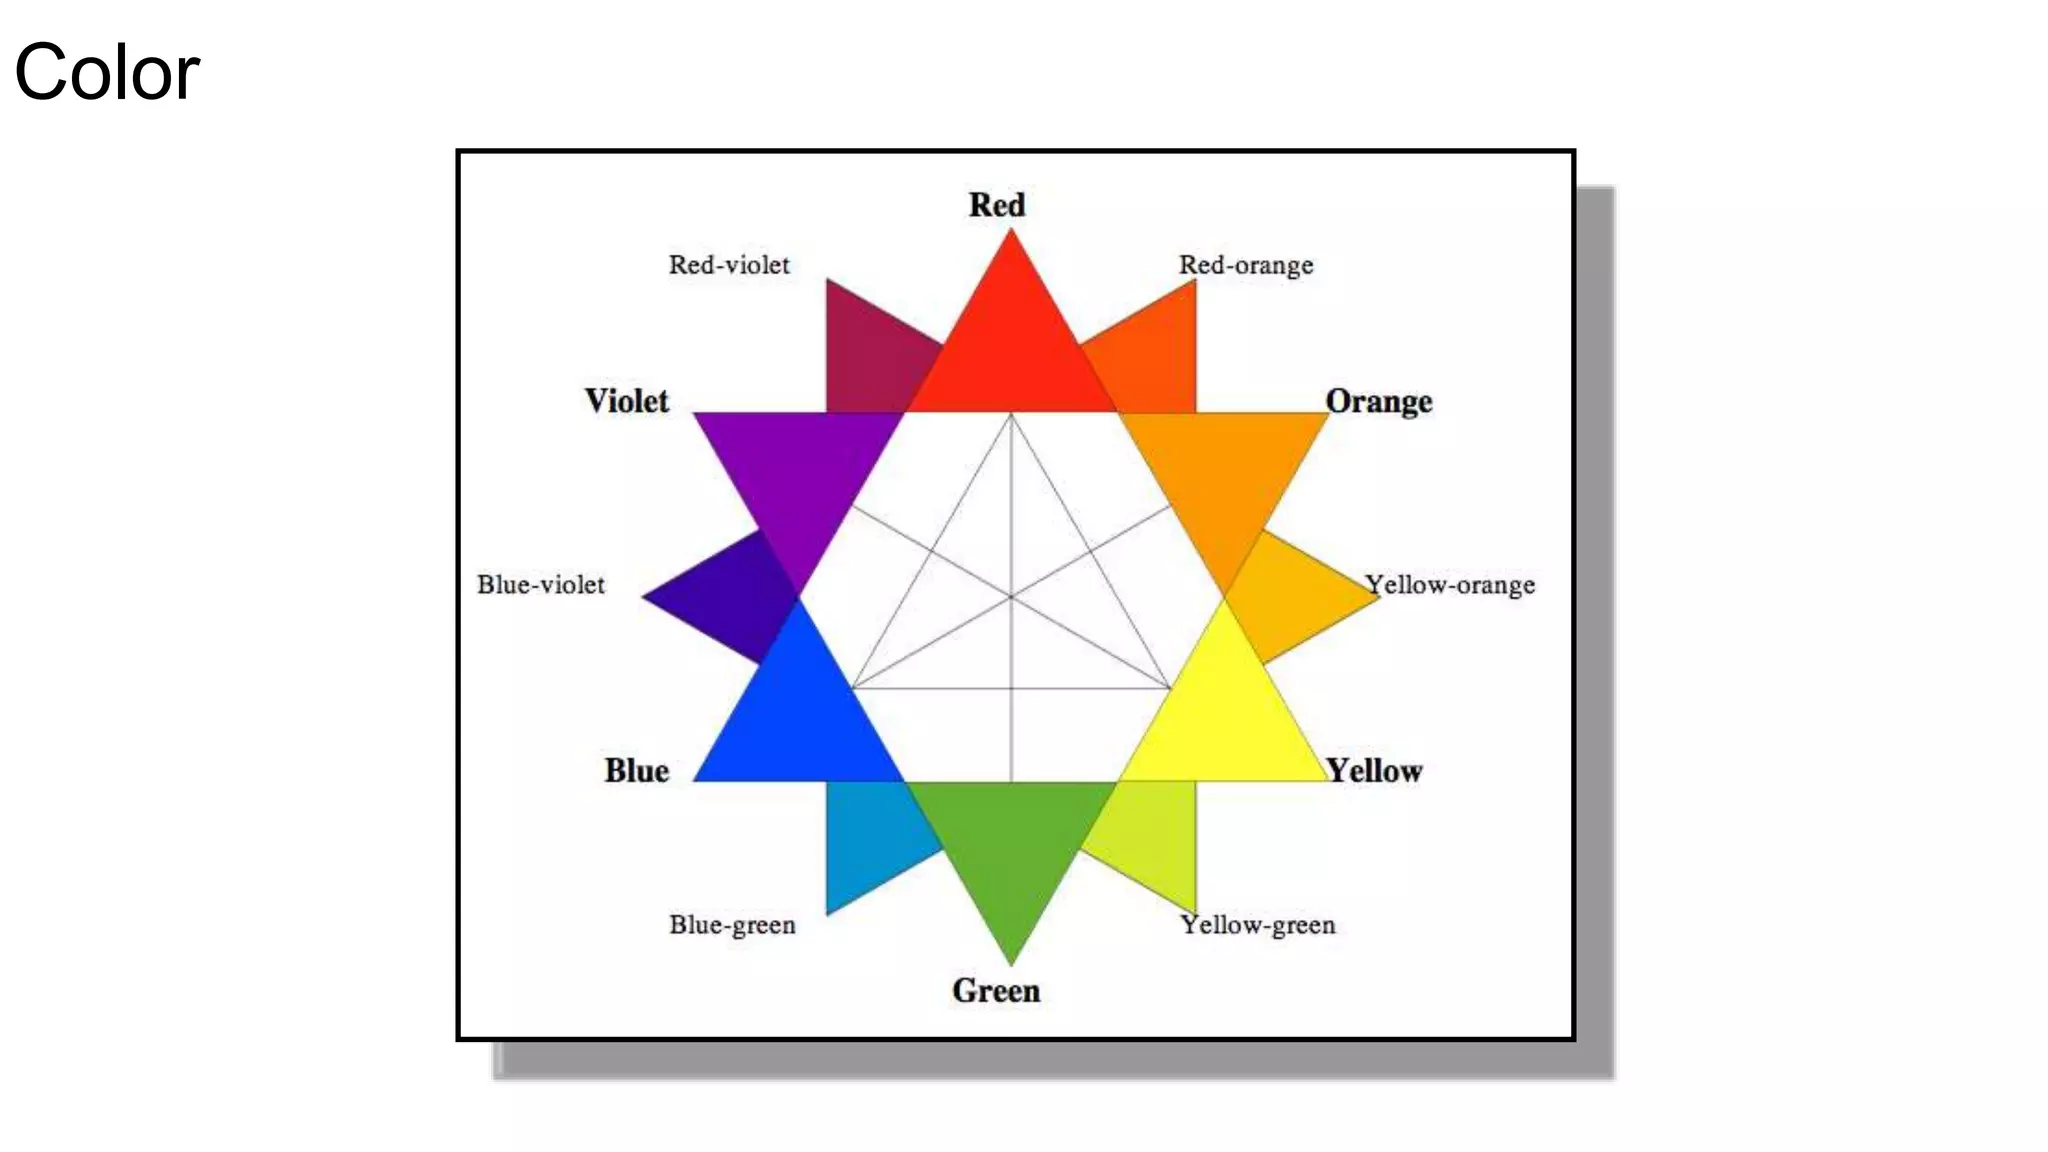
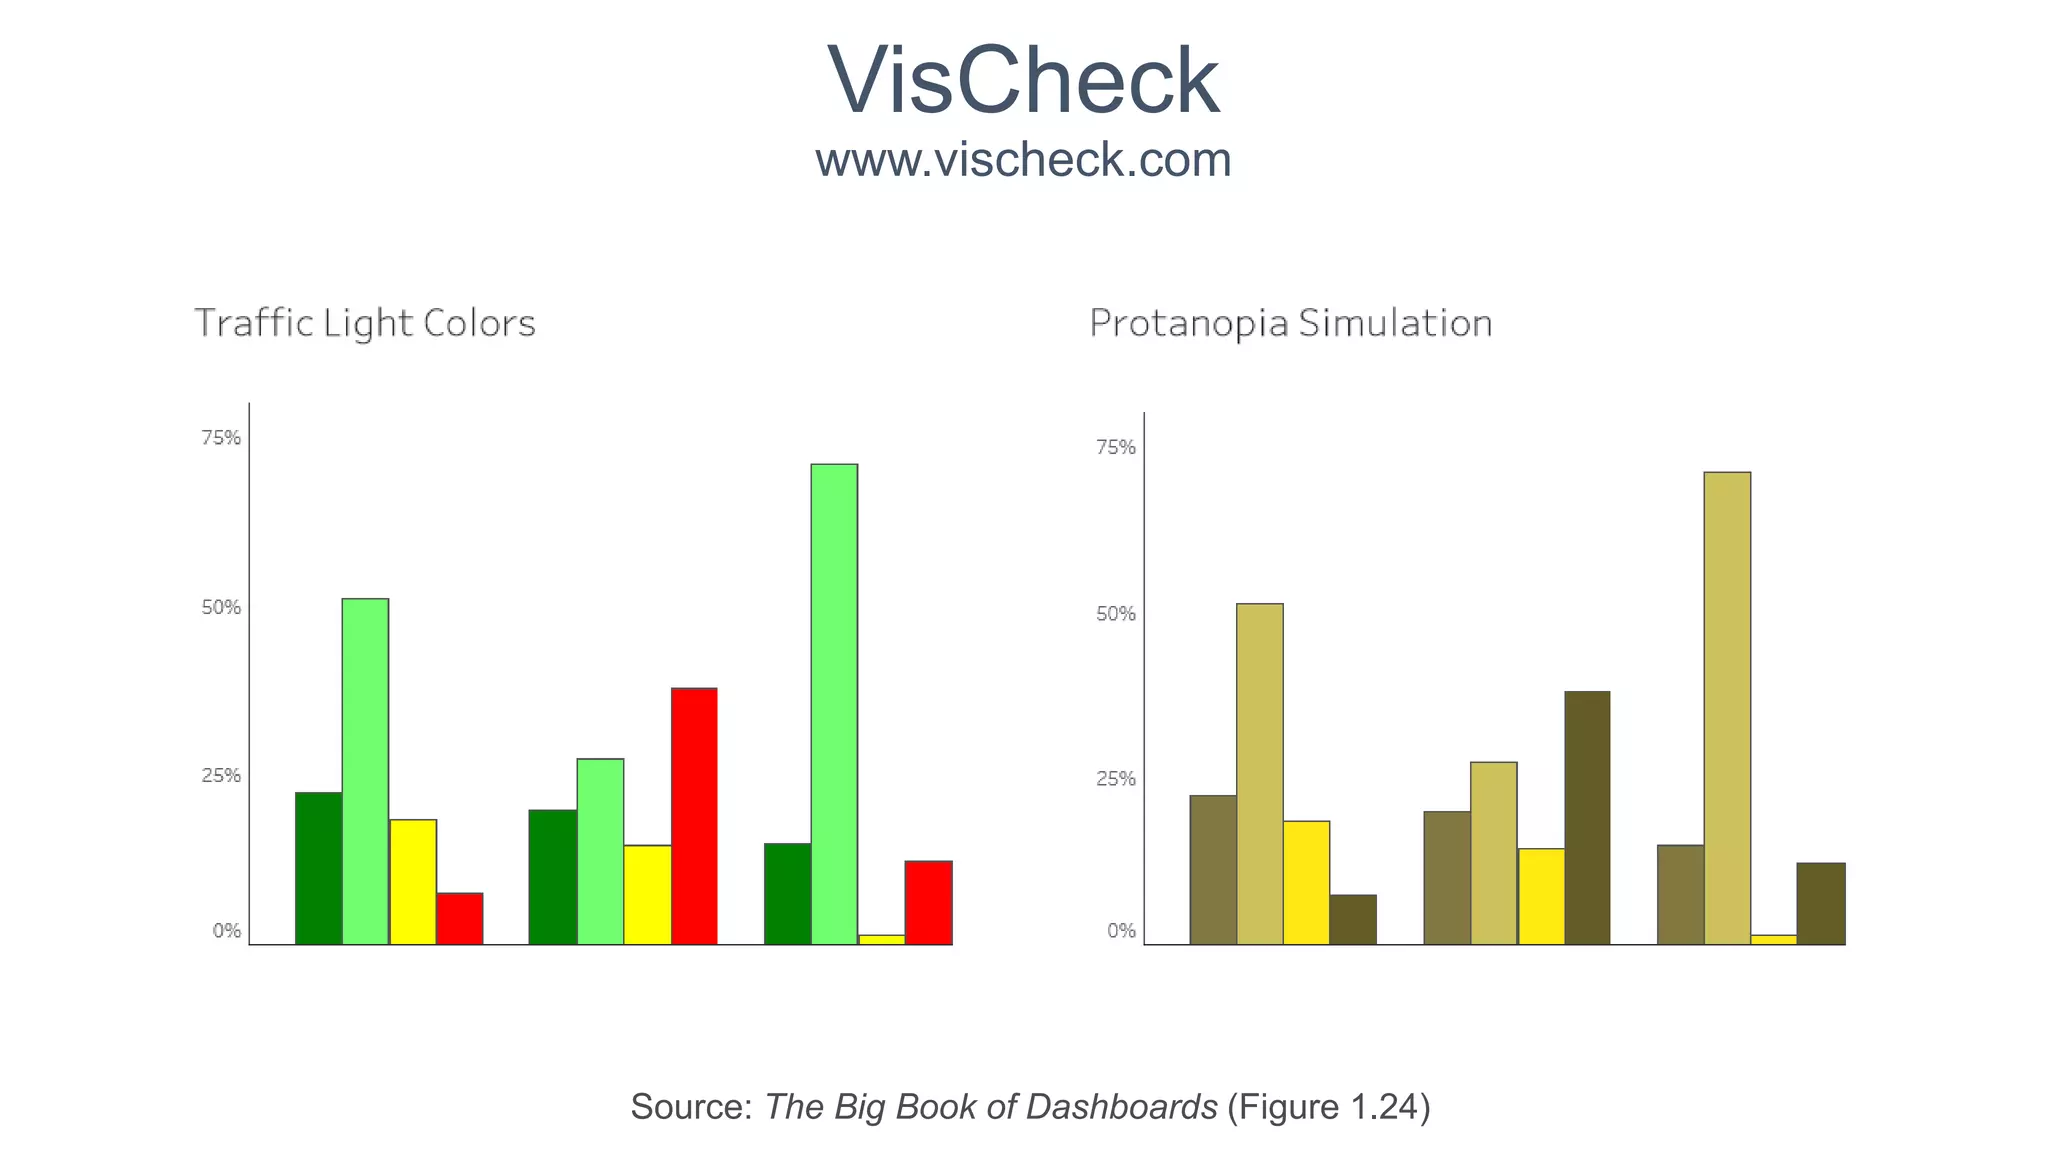
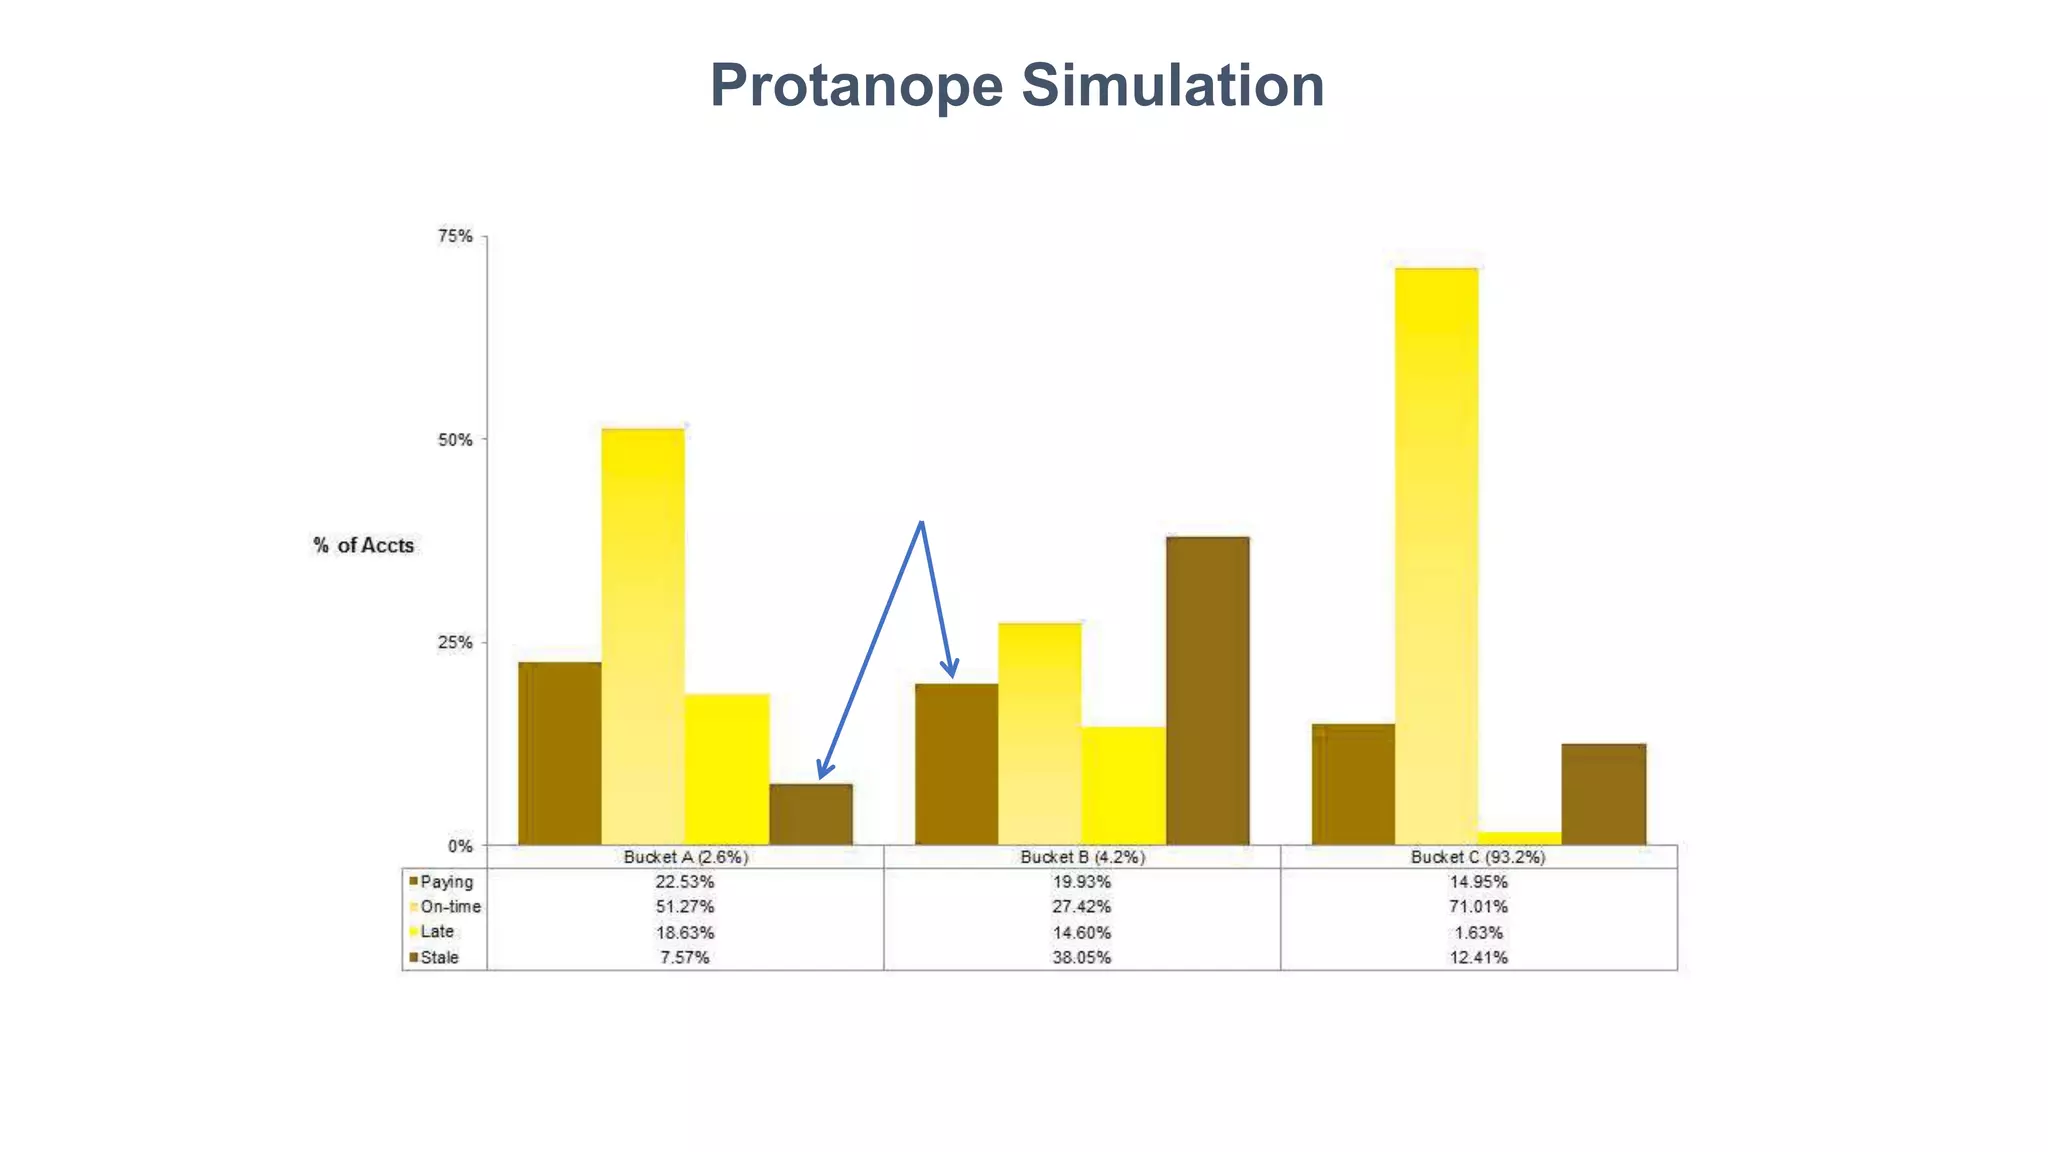
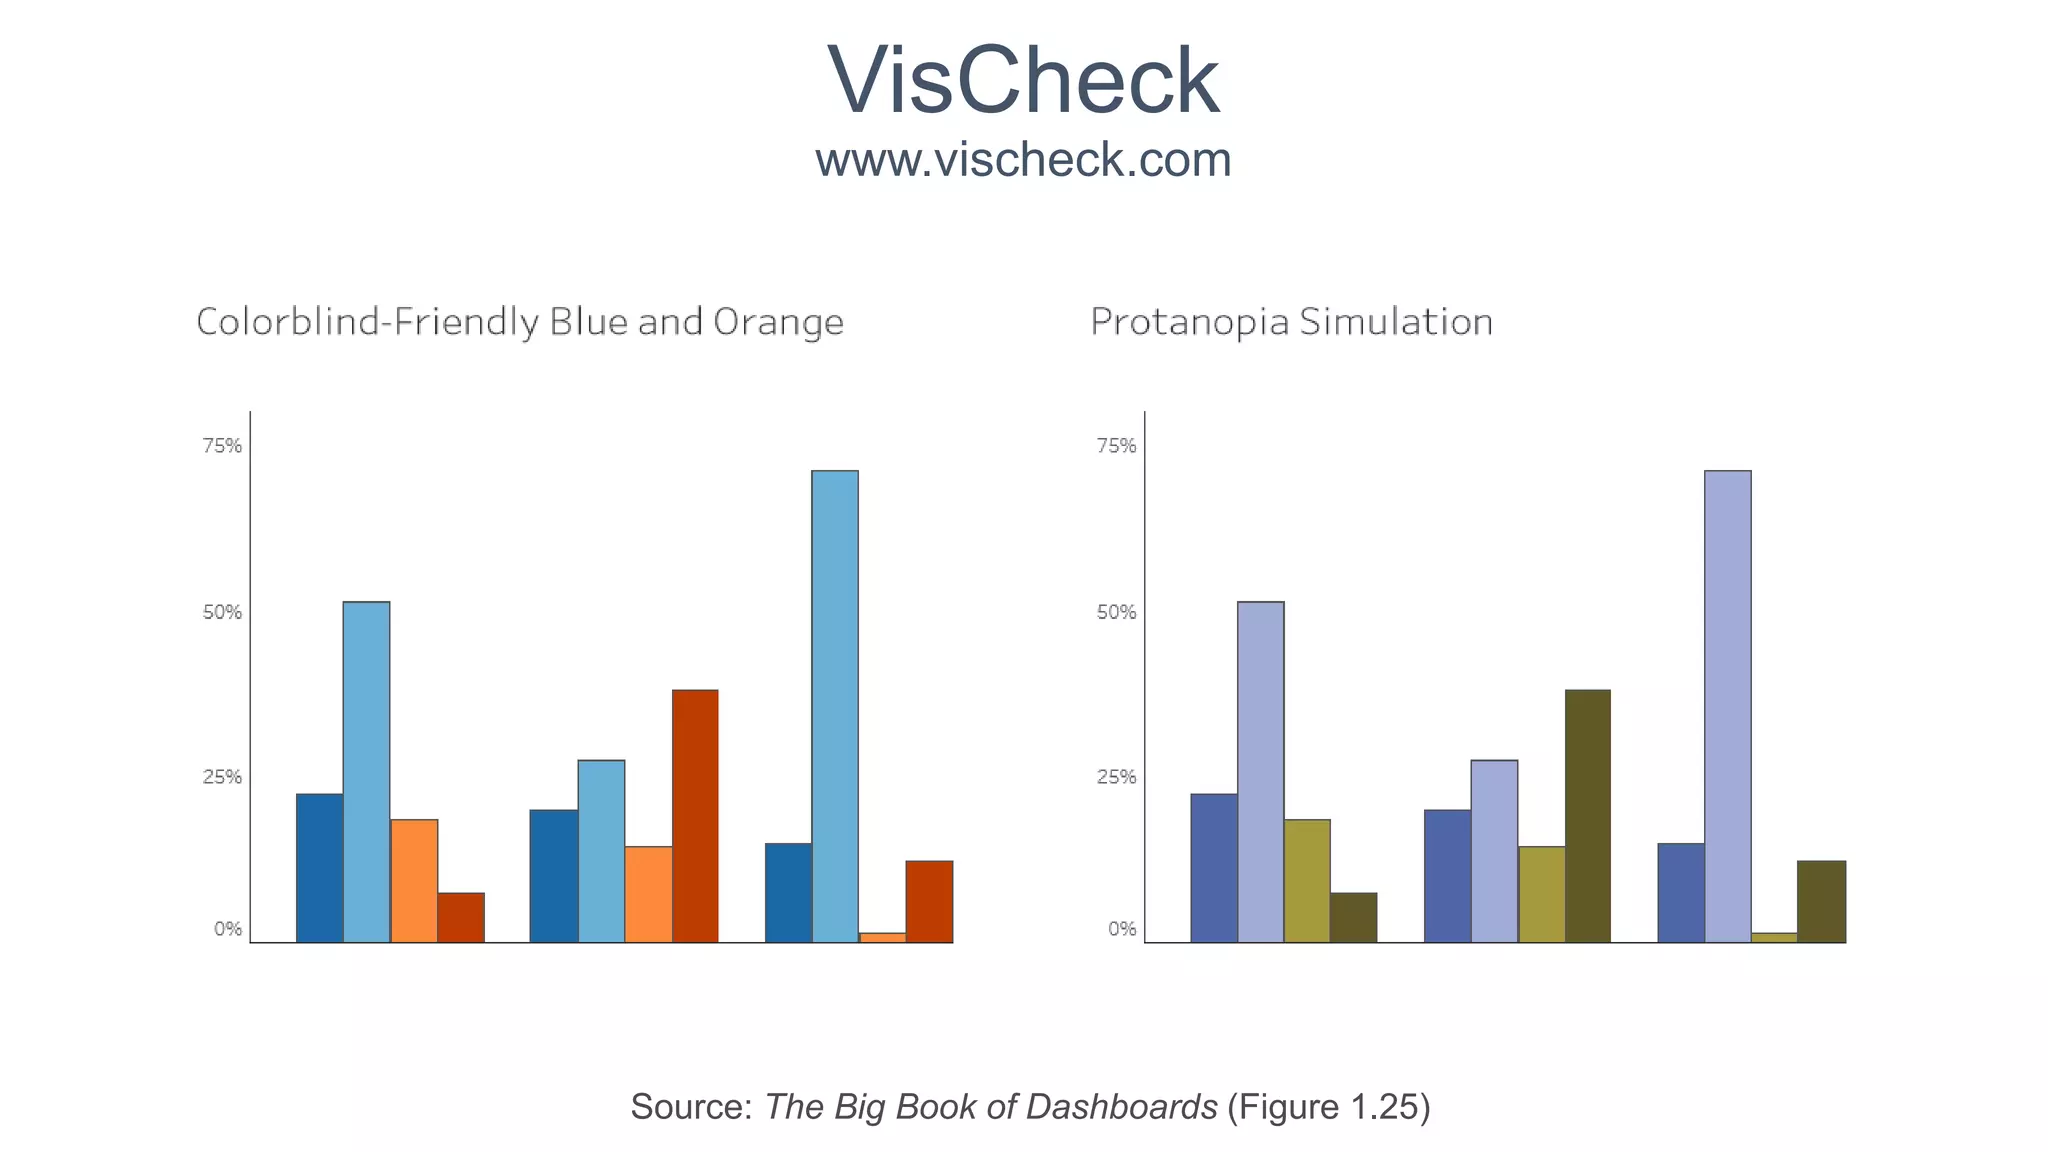
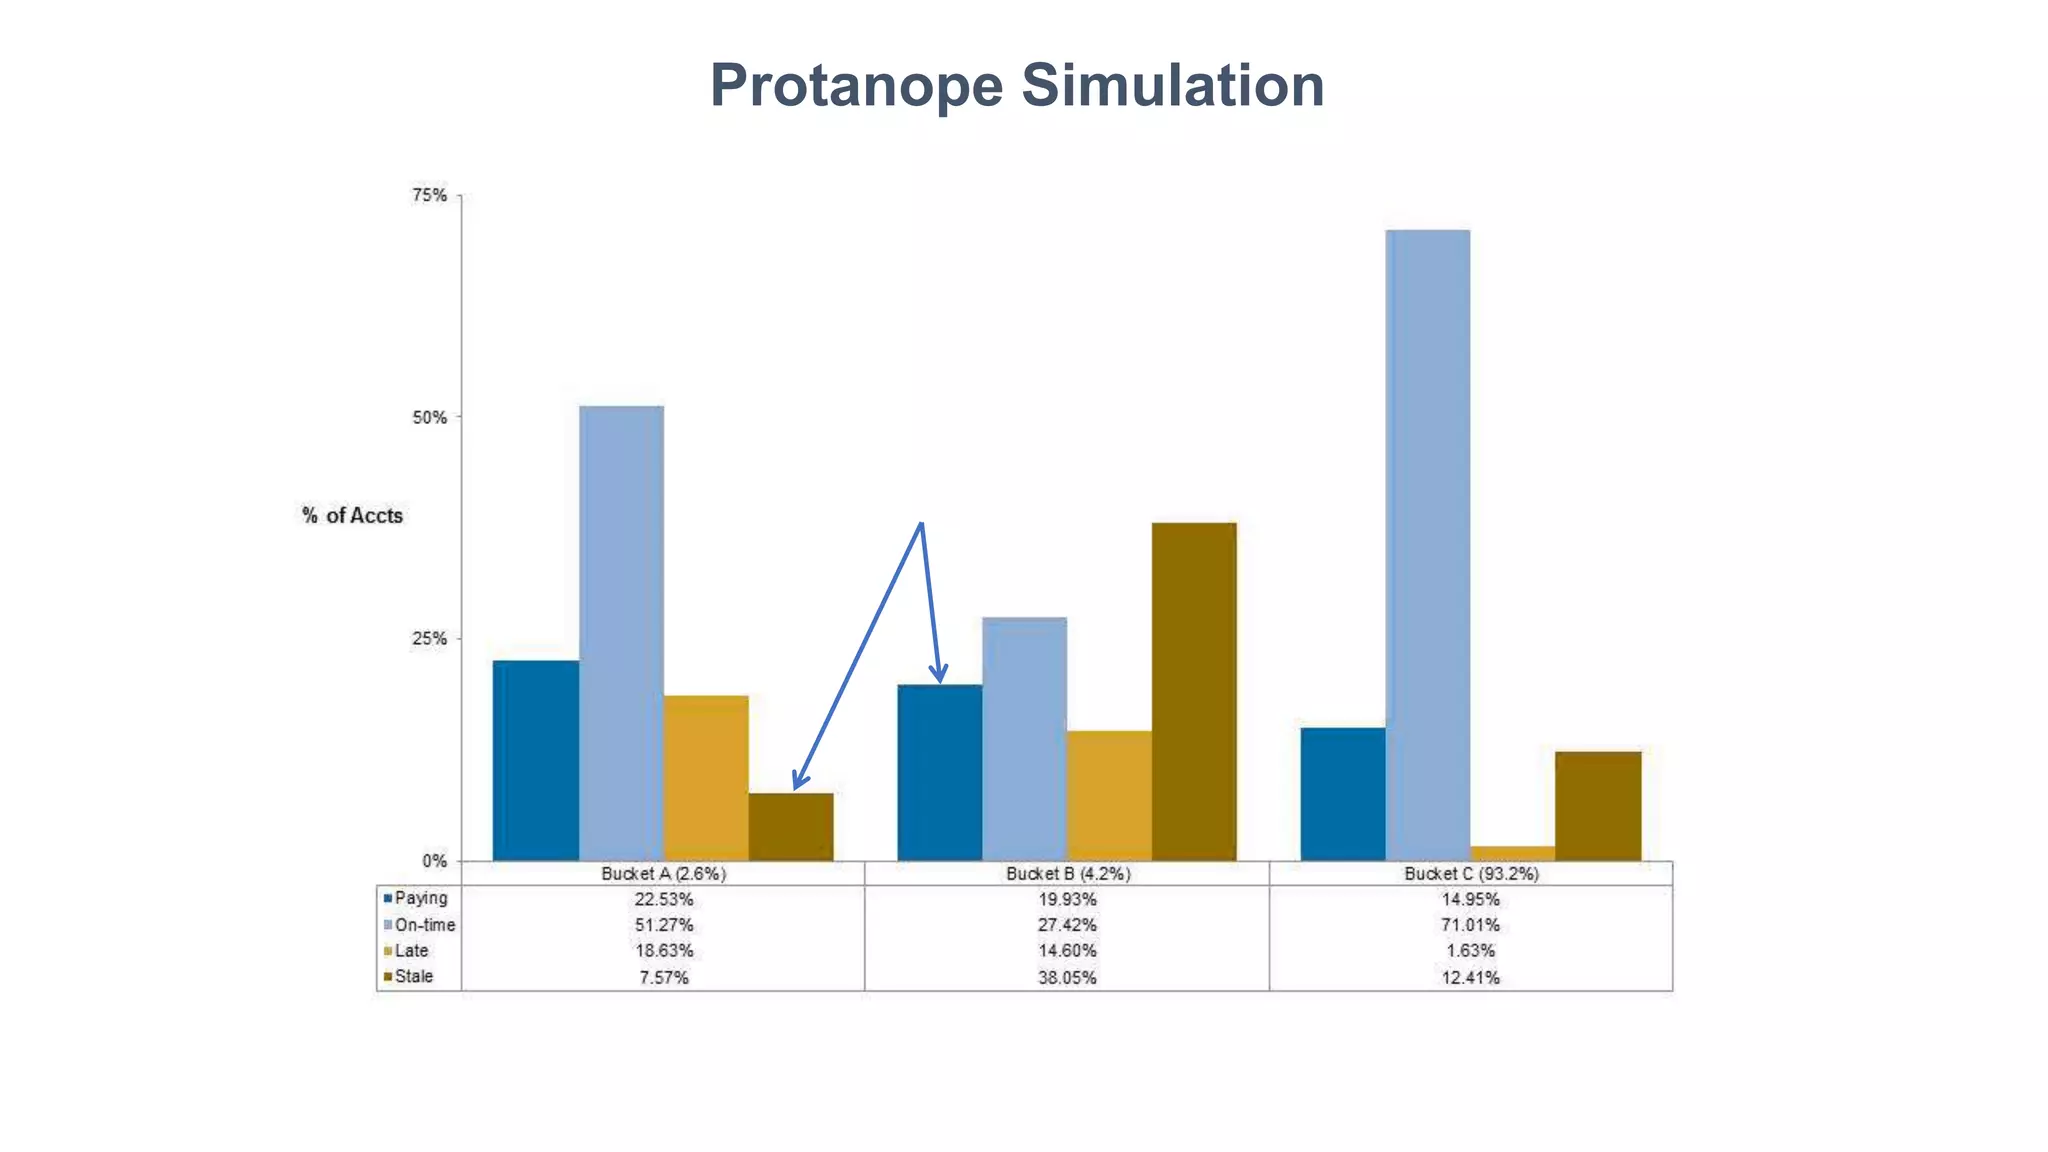
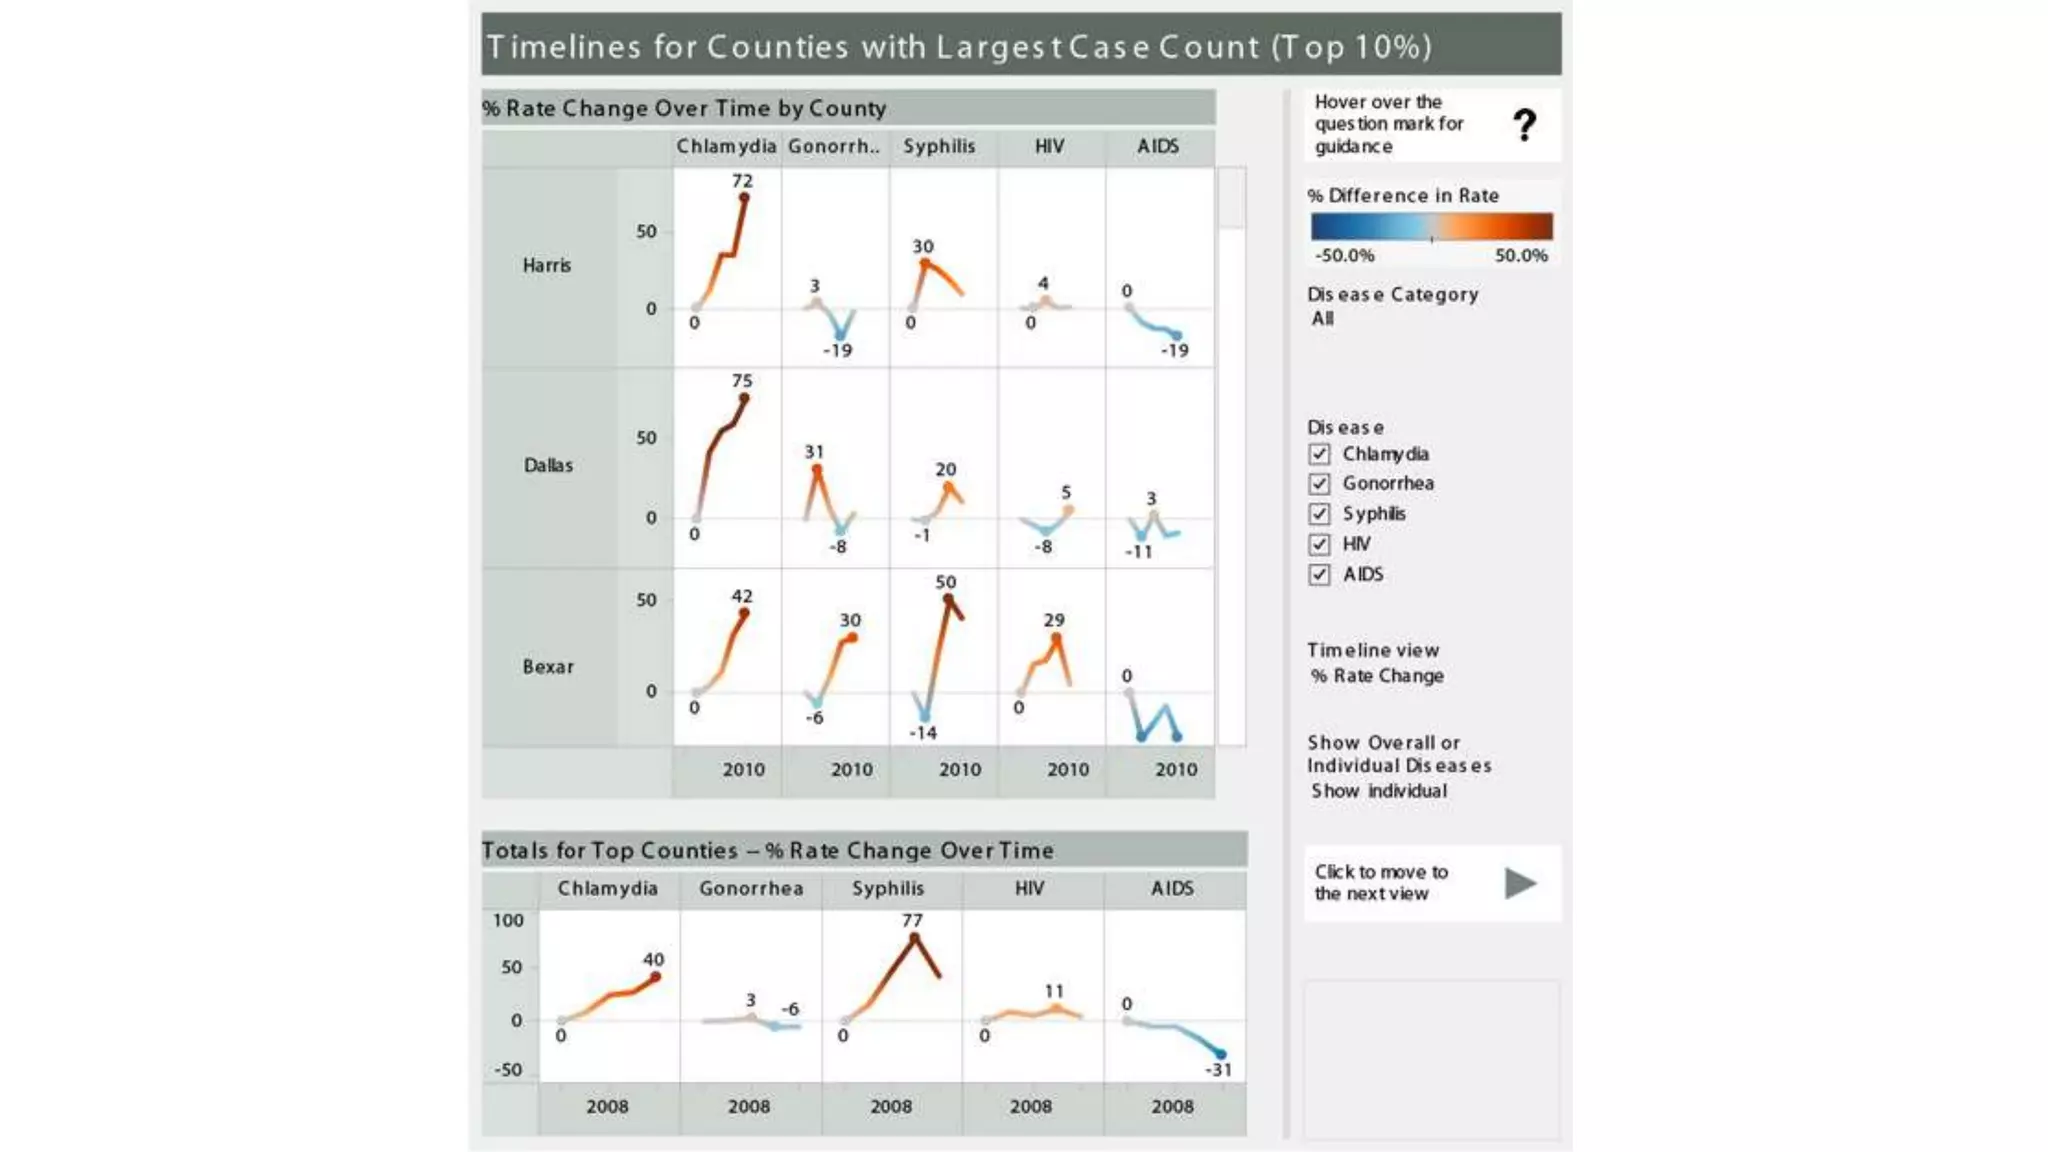
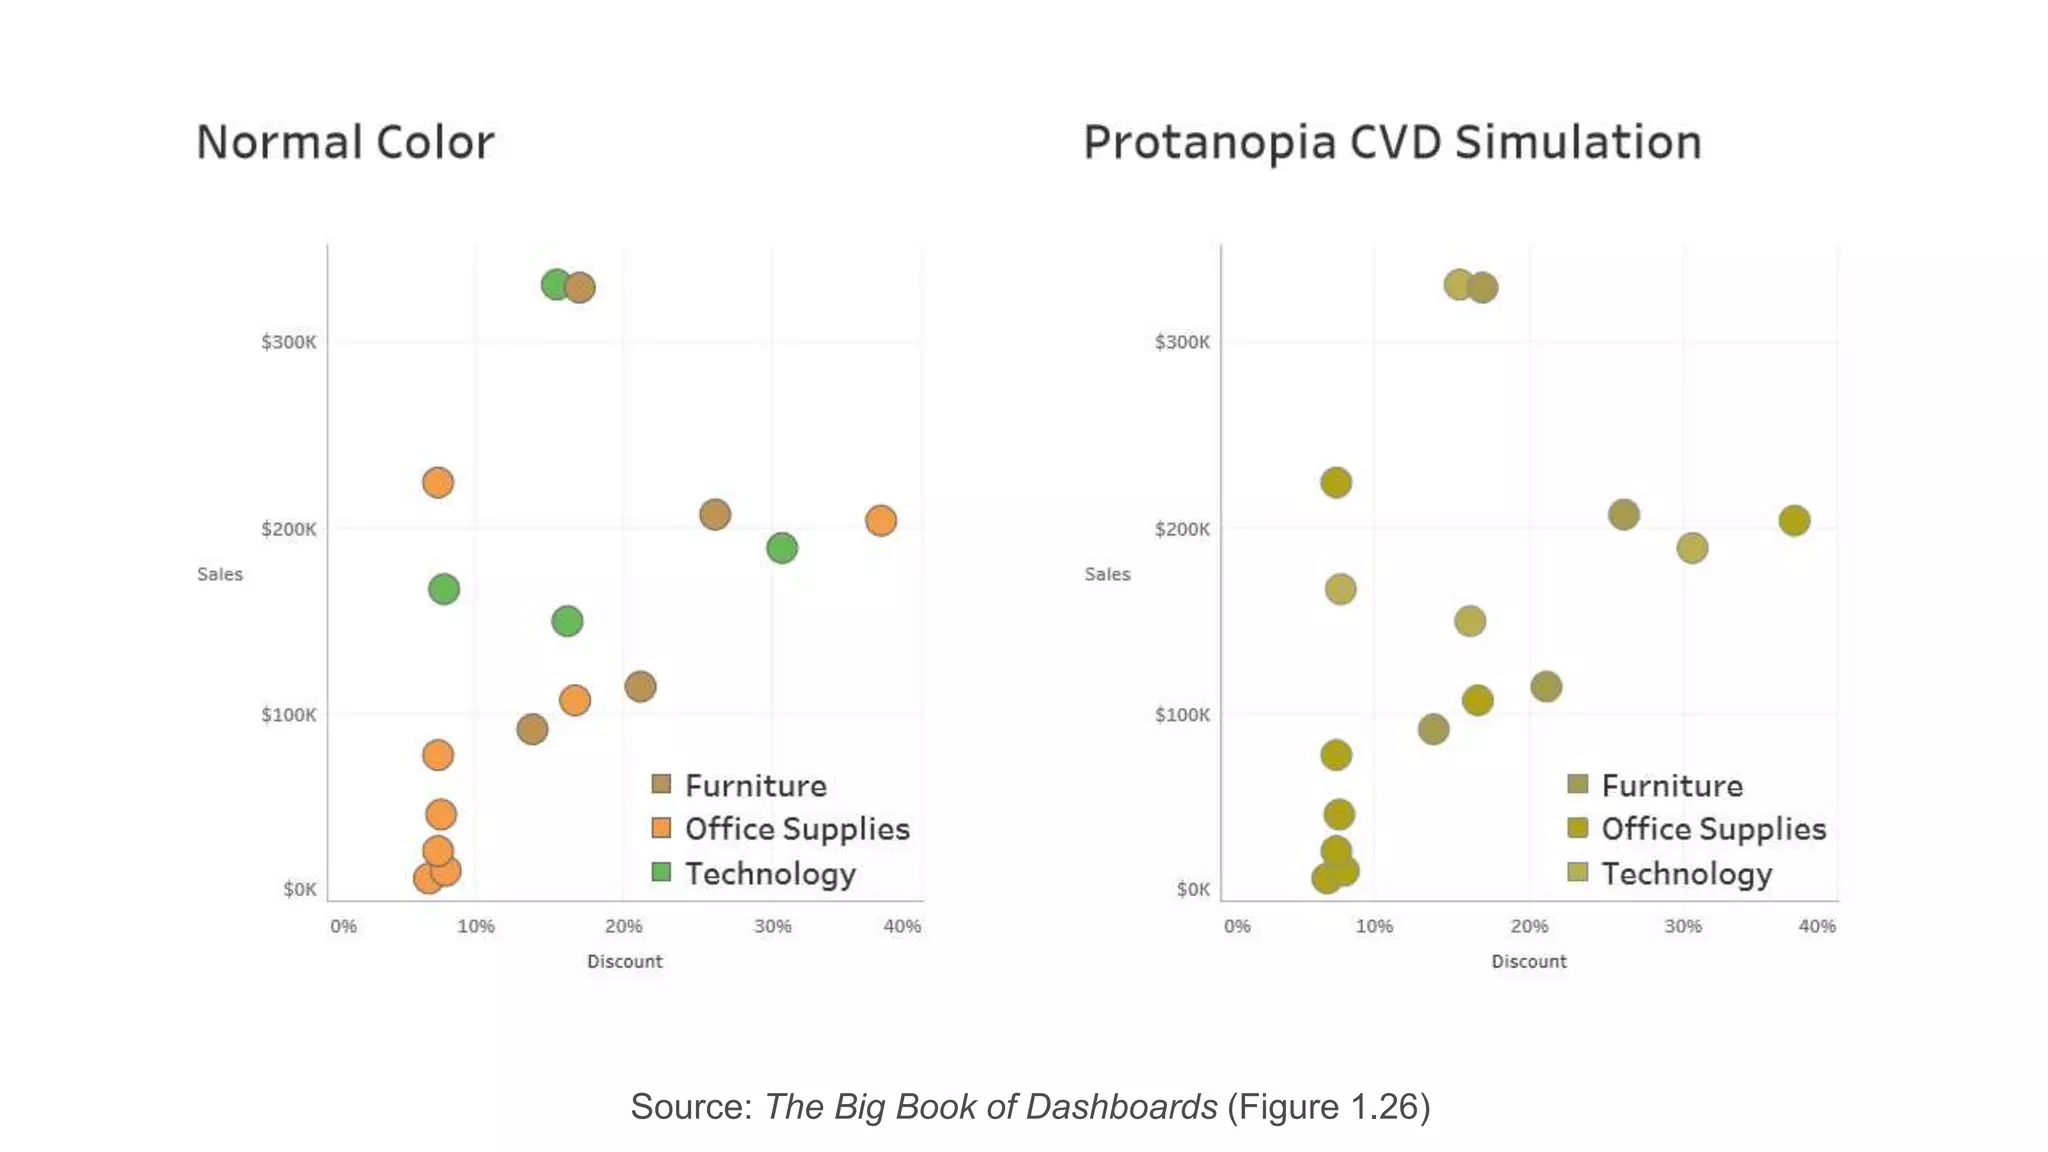
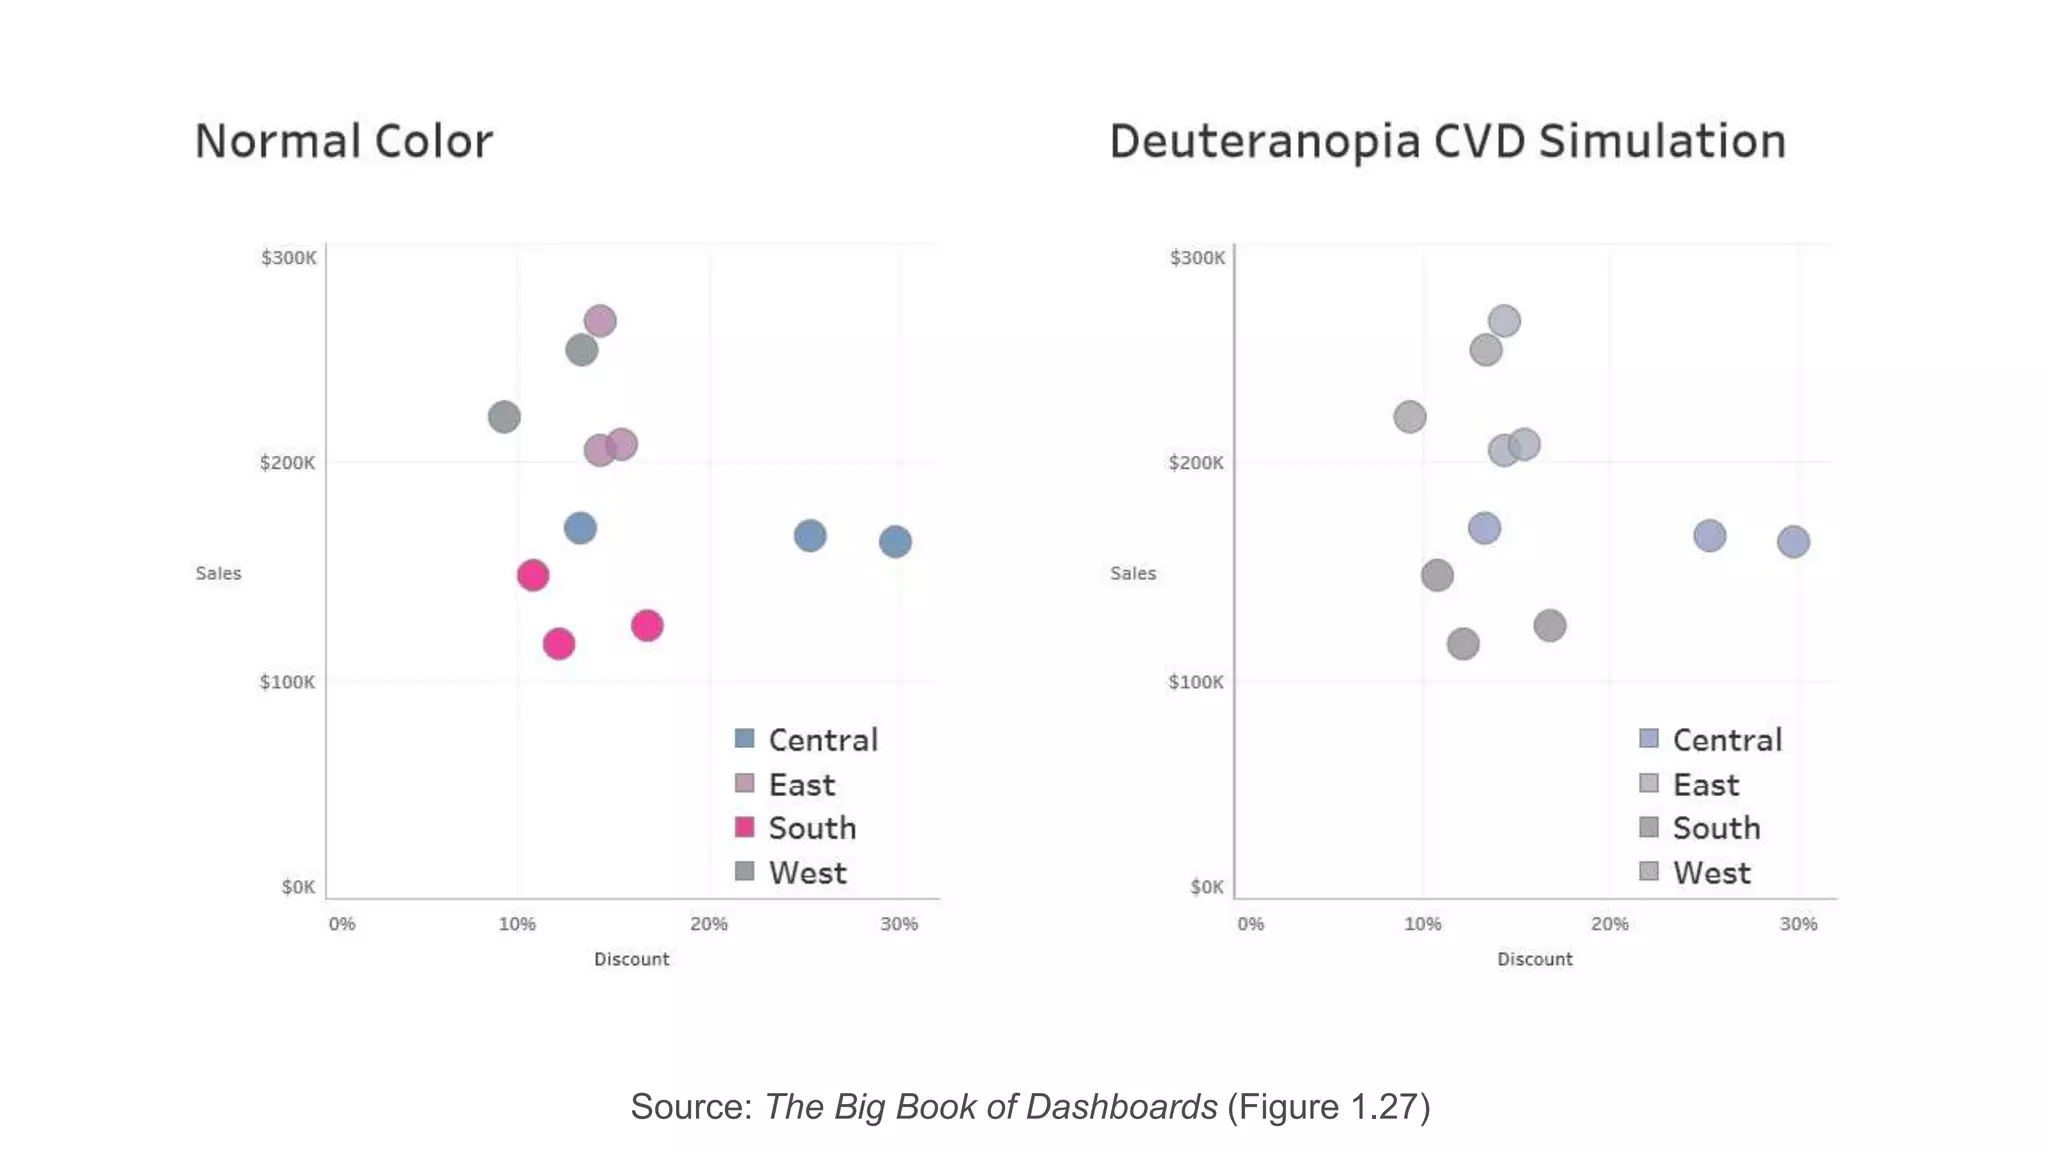
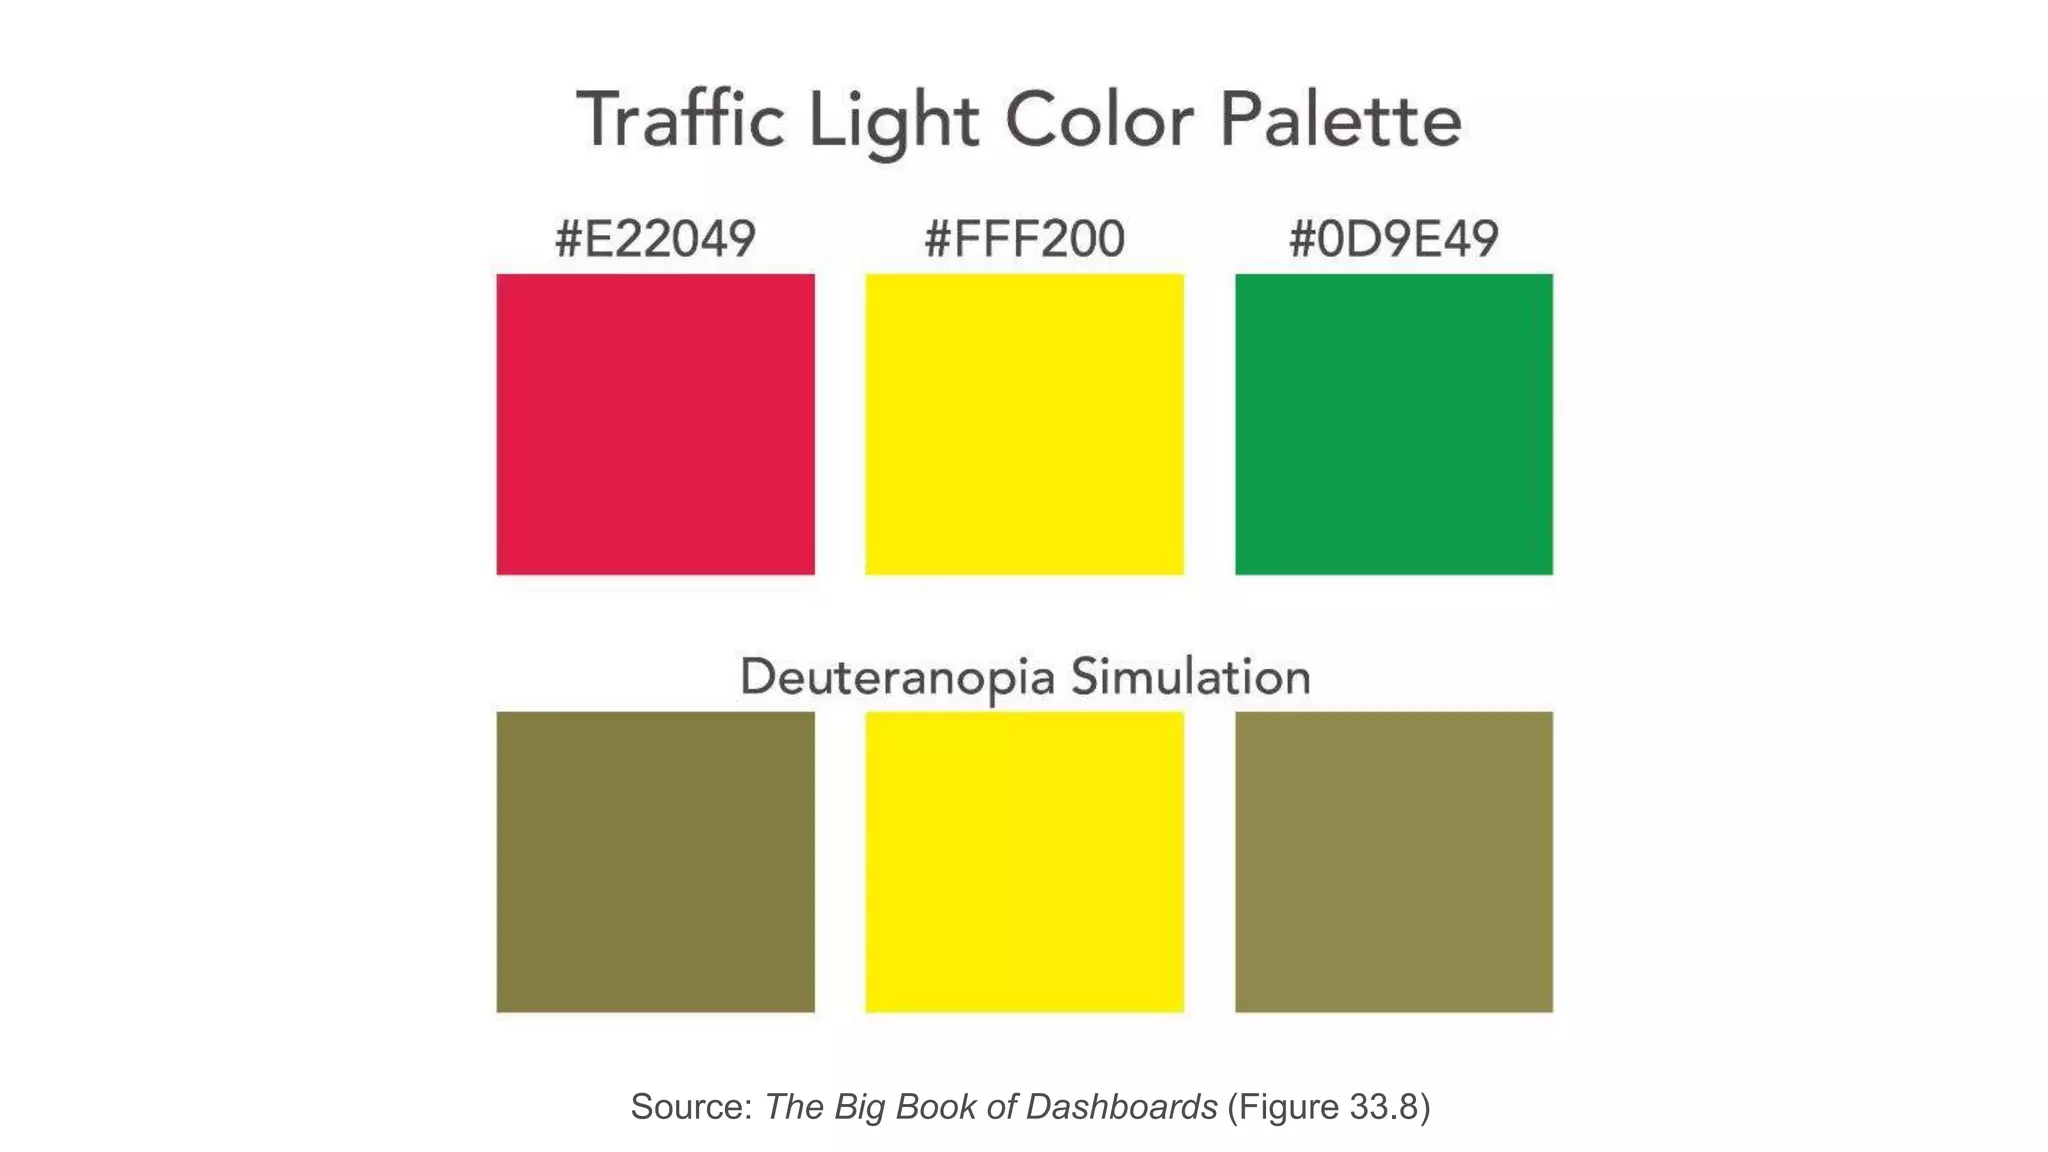
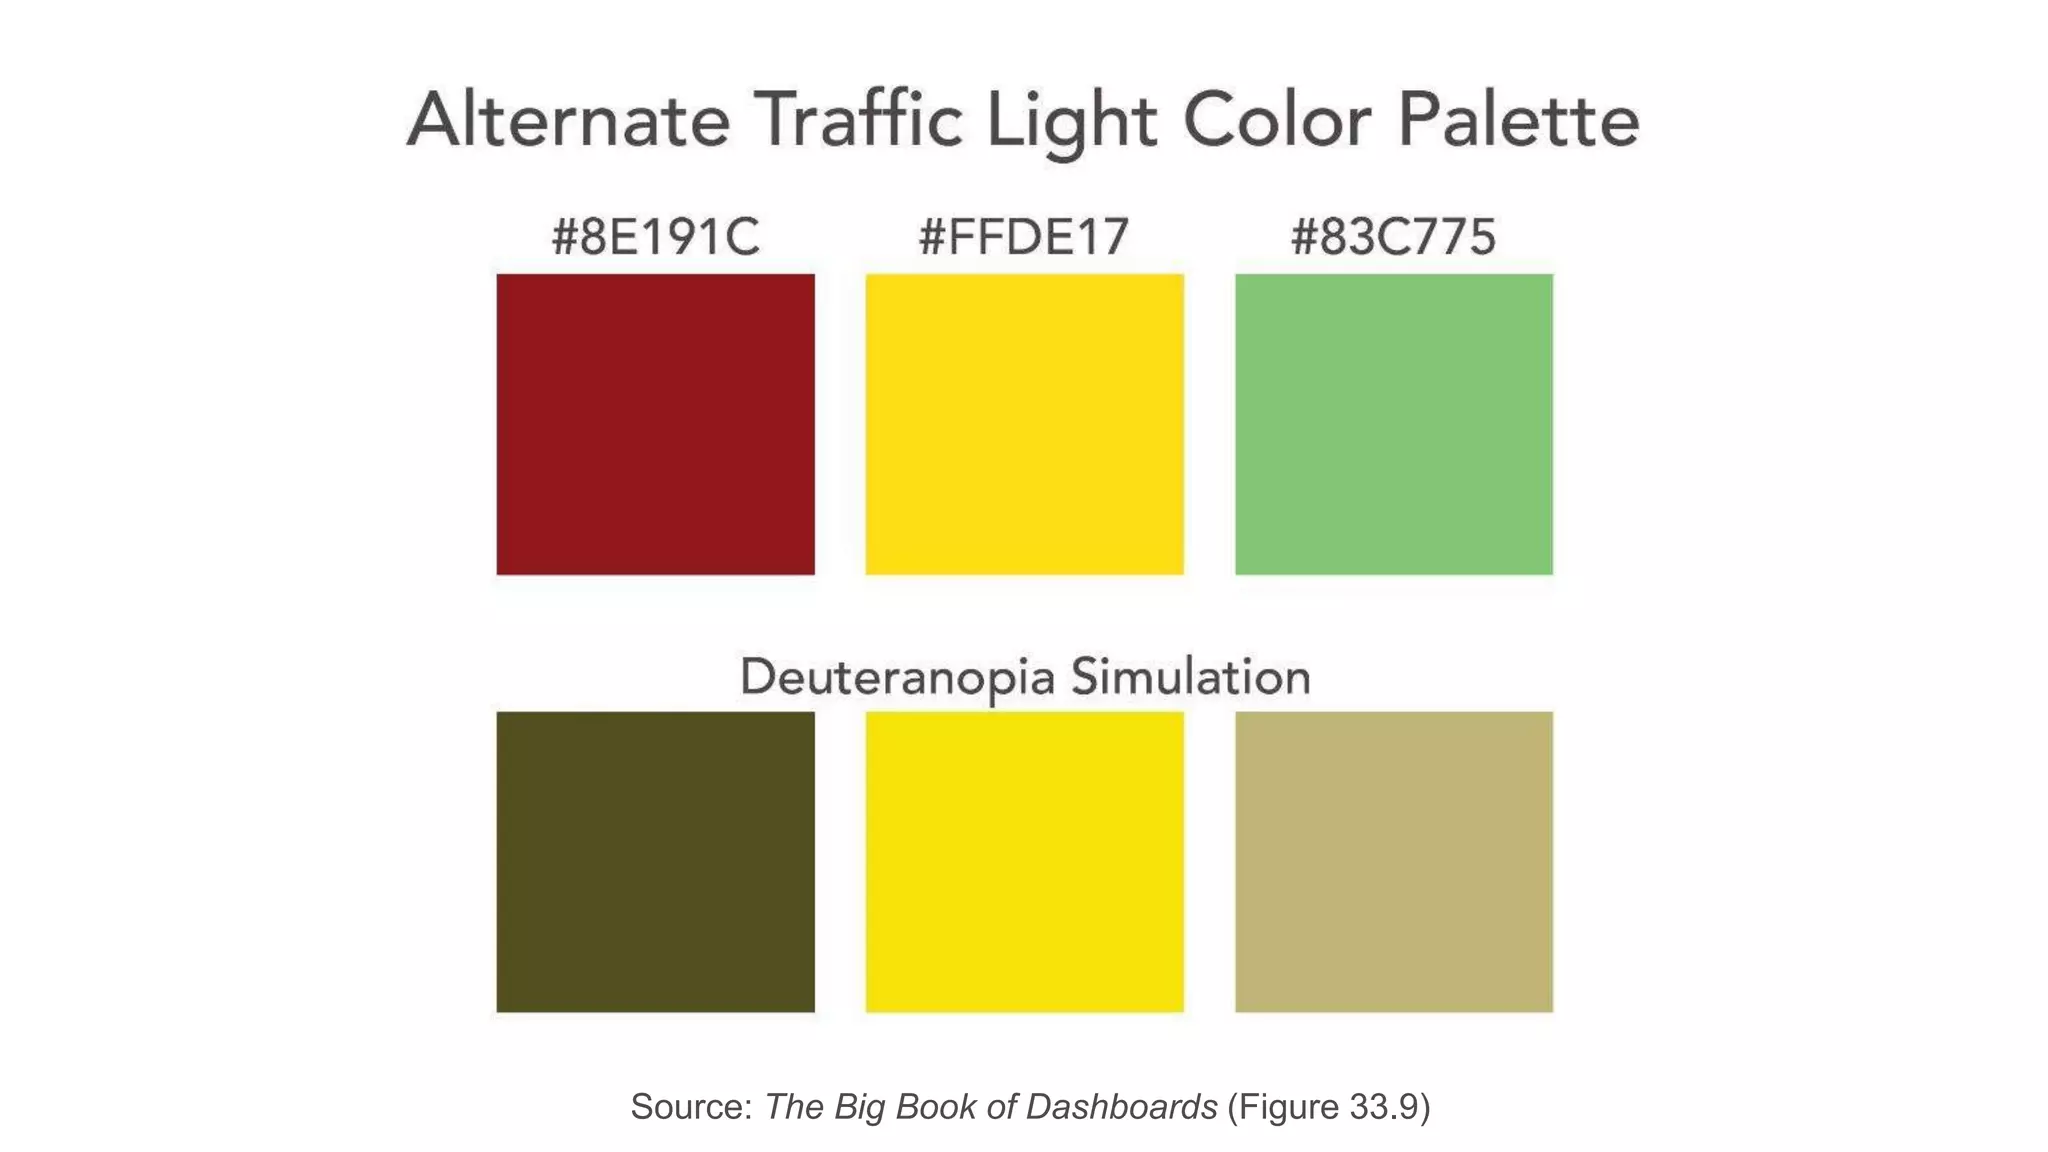
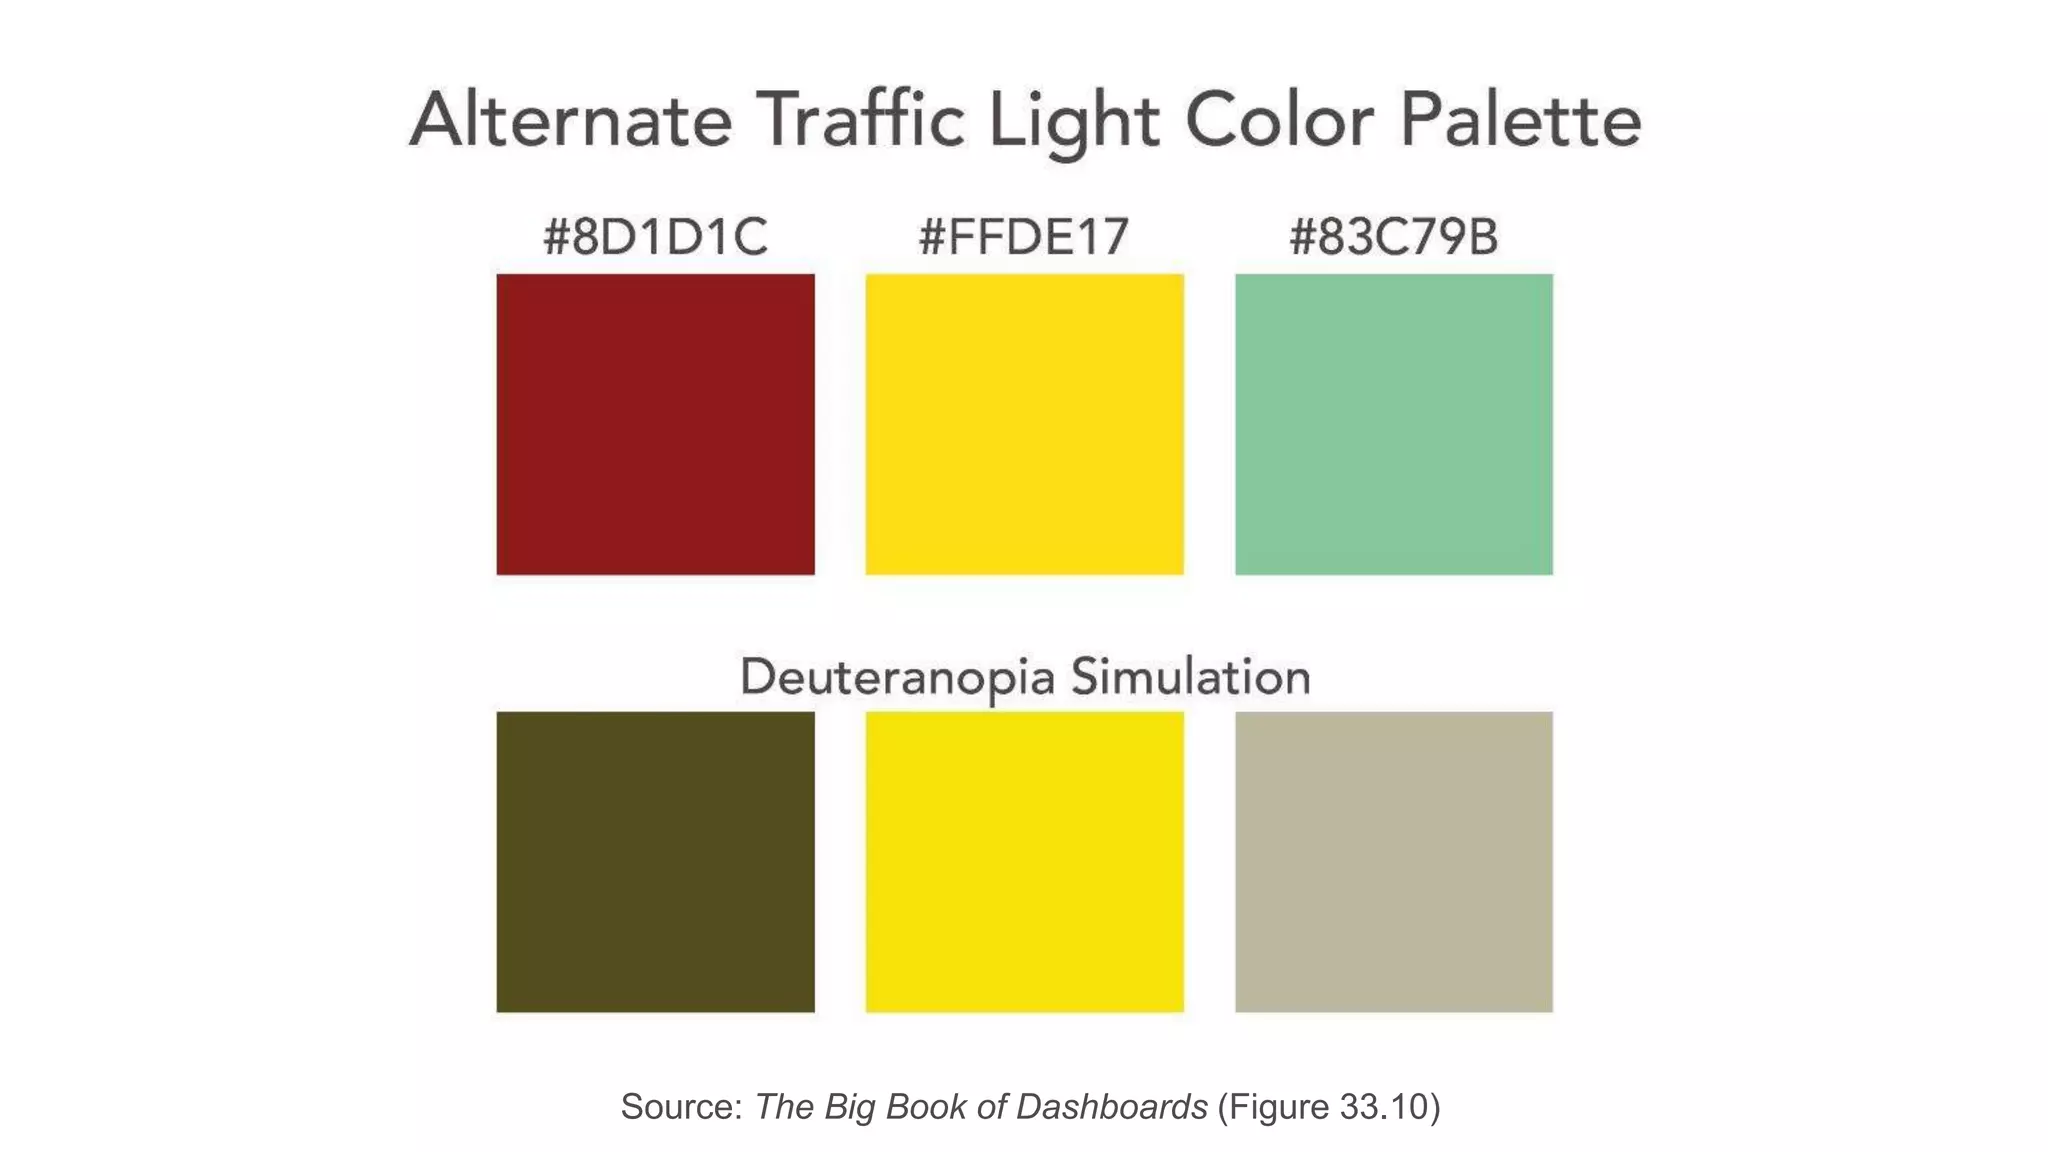
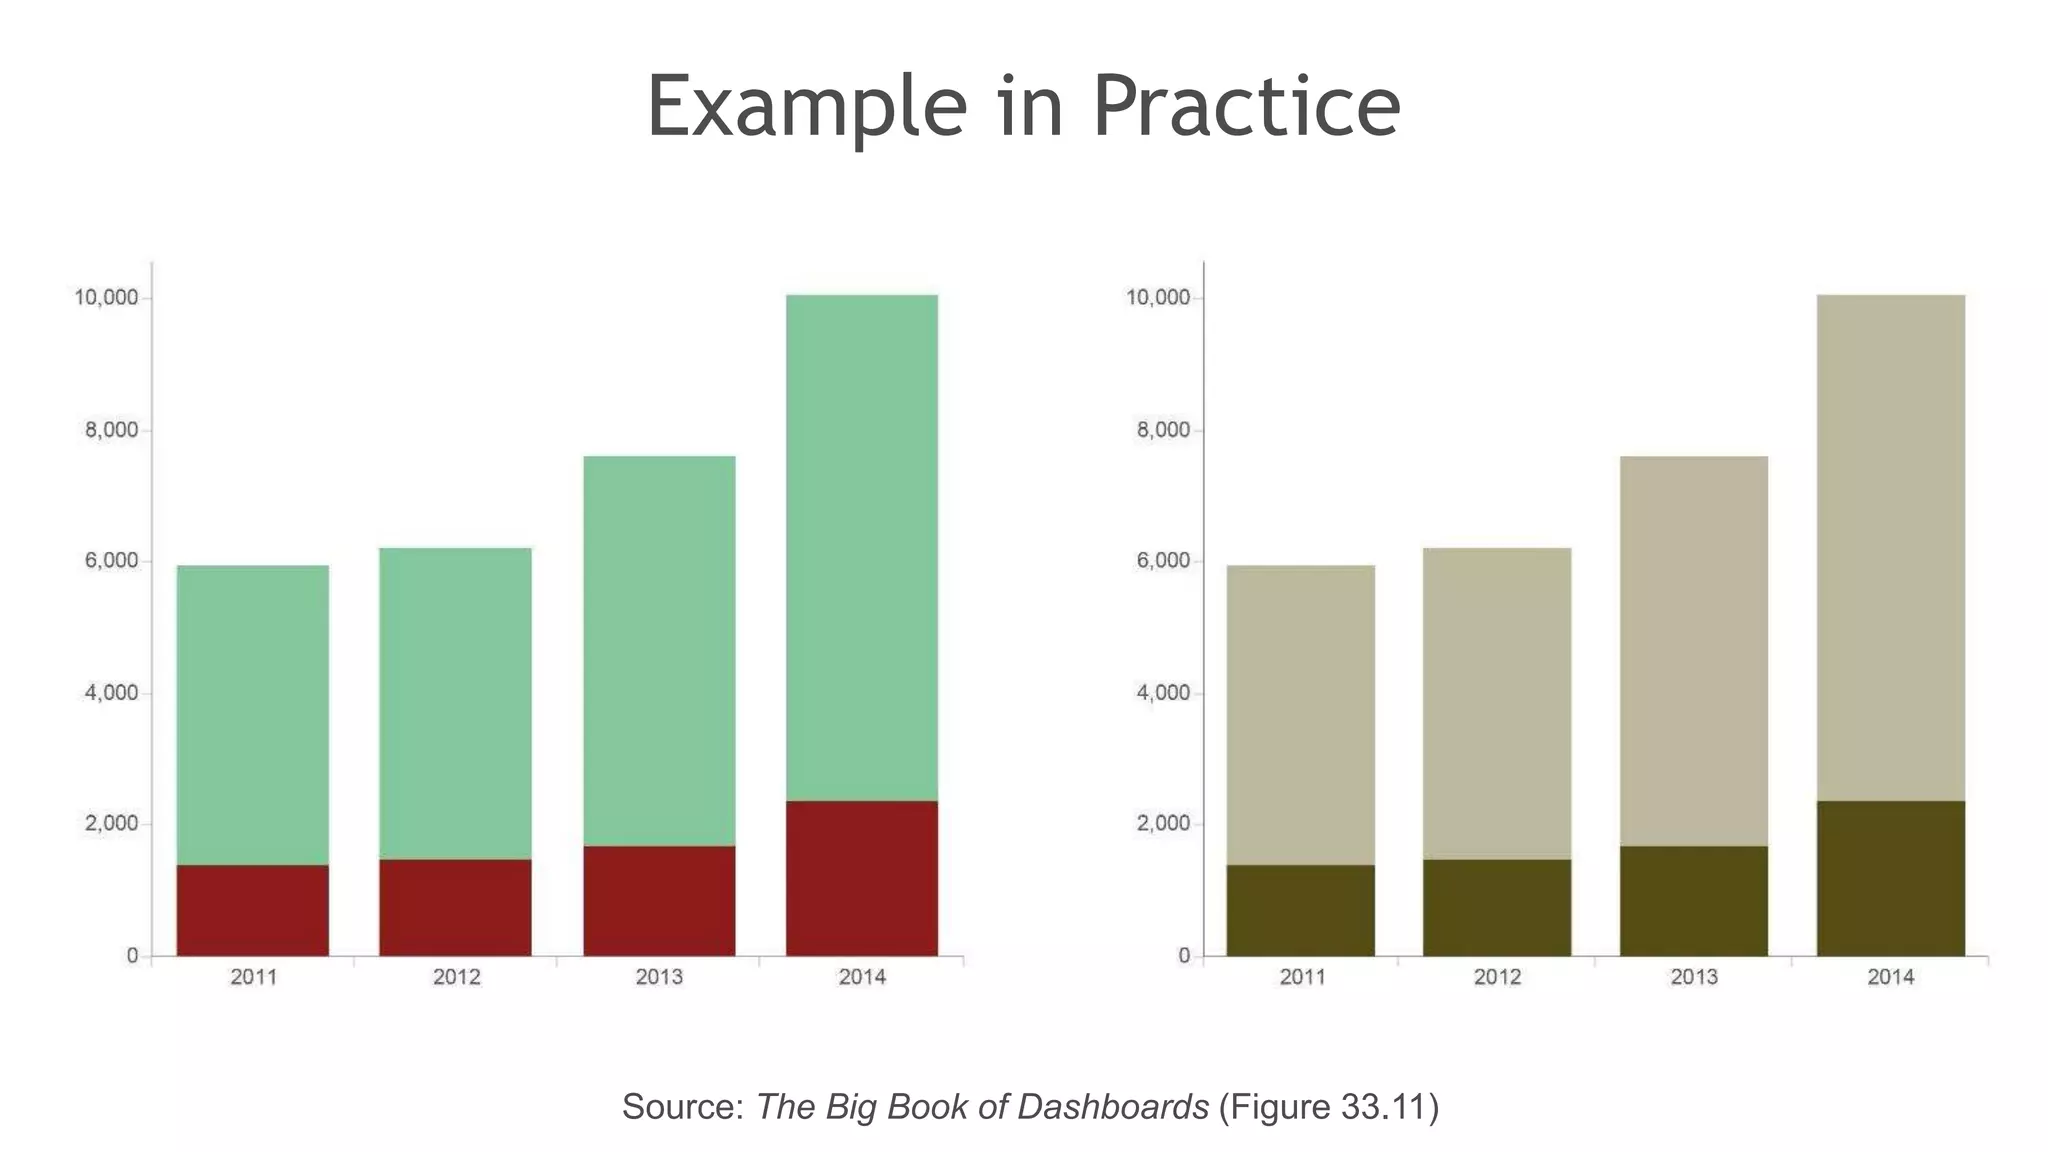


This document discusses the effective use of color in data visualization. It explains that color can be used to convey meaning but too much color can overload short-term memory. There are different types of color schemes like sequential, diverging, and categorical that are suited to different data types. It also discusses color vision deficiencies which affect approximately 8% of men and influence how they perceive certain colors. The document provides examples of how colorblind individuals see color compared to those with normal vision and recommends testing visualizations using colorblind simulators.