Carbon star formation as seen through the non-monotonic initial–final mass re...Sérgio Sacani
The initial–final mass relation (IFMR) links the birth mass of a star to the mass of the compact remnant left at its death. While
the relevance of the IFMR across astrophysics is universally acknowledged, not all of its fine details have yet been resolved.
A new analysis of a few carbon–oxygen white dwarfs in old open clusters of the Milky Way led us to identify a kink in the IFMR,
located over a range of initial masses, 1.65 ≲Mi
/M⊙ ≲ 2.10. The kink’s peak in white dwarf mass of about 0.70−0.75 M⊙ is
produced by stars with Mi≈ 1.8−1.9 M⊙, corresponding to ages of about 1.8−1.7 Gyr. Interestingly, this peak coincides with
the initial mass limit between low-mass stars that develop a degenerate helium core after central hydrogen exhaustion, and
intermediate-mass stars that avoid electron degeneracy. We interpret the IFMR kink as the signature of carbon star formation
in the Milky Way. This finding is critical to constraining the evolution and chemical enrichment of low-mass stars, and their
impact on the spectrophotometric properties of galaxies.
A thirty-four billion solar mass black hole in SMSS J2157–3602, the most lumi...Sérgio Sacani
From near-infrared spectroscopic measurements of the Mg II emission line doublet, we estimate the black hole (BH) mass of the quasar, SMSS J215728.21–360215.1, as being (3.4 ± 0.6) × 1010 M⊙ and refine the redshift of the quasar to be z = 4.692. SMSS J2157 is the most luminous known quasar, with a 3000 Å luminosity of (4.7 ± 0.5) × 1047 erg s−1 and an estimated bolometric luminosity of 1.6 × 1048 erg s−1 , yet its Eddington ratio is only ∼0.4. Thus, the high luminosity of this quasar is a consequence of its extremely large BH – one of the most massive BHs at z > 4.
We present spectroscopic observations of the nearby dwarf galaxy AGC 198691. This object is part
of the Survey of H I in Extremely Low-Mass Dwarfs (SHIELD) project, which is a multi-wavelength
study of galaxies with H I masses in the range of 106-107:2 M discovered by the ALFALFA survey.
We have obtained spectra of the lone H II region in AGC 198691 with the new high-throughput
KPNO Ohio State Multi-Object Spectrograph (KOSMOS) on the Mayall 4-m as well as with the Blue
Channel spectrograph on the MMT 6.5-m telescope. These observations enable the measurement of the
temperature-sensitive [O III]4363 line and hence the determination of a \direct" oxygen abundance
for AGC 198691. We nd this system to be an extremely metal-decient (XMD) system with an
oxygen abundance of 12+log(O/H) = 7.02 0.03, making AGC 198691 the lowest-abundance starforming
galaxy known in the local universe. Two of the ve lowest-abundance galaxies known have
been discovered by the ALFALFA blind H I survey; this high yield of XMD galaxies represents a
paradigm shift in the search for extremely metal-poor galaxies.
A rare case of FR I interaction with a hot X-ray bridge in the A2384 galaxy c...Sérgio Sacani
Clusters of varying mass ratios can merge and the process significantly disturbs
the cluster environments and alters their global properties. Active radio galaxies are
another phenomenon that can also affect cluster environments. Radio jets can interact
with the intra-cluster medium (ICM) and locally affect its properties. Abell 2384
(hereafter A2384) is a unique system that has a dense, hot X-ray filament or bridge
connecting the two unequal mass clusters A2384(N) and A2384(S). The analysis of its
morphology suggests that A2384 is a post-merger system where A2384(S) has already
interacted with the A2384(N), and as a result hot gas has been stripped over a ∼ 1
Mpc region between the two bodies. We have obtained its 325 MHz GMRT data,
and we detected a peculiar FR I type radio galaxy which is a part of the A2384(S).
One of its radio lobes interacts with the hot X-ray bridge and pushes the hot gas in
the opposite direction. This results in displacement in the bridge close to A2384(S).
Based on Chandra and XMM-Newton X-ray observations, we notice a temperature and
entropy enhancement at the radio lobe-X-ray plasma interaction site, which further
suggests that the radio lobe is changing thermal plasma properties. We have also
studied the radio properties of the FR I radio galaxy, and found that the size and
radio luminosity of the interacting north lobe of the FR I galaxy are lower than those
of the accompanying south lobe.
Evidence for the_thermal_sunyaev-zeldovich_effect_associated_with_quasar_feed...Sérgio Sacani
Using a radio-quiet subsample of the Sloan Digital Sky Survey spectroscopic quasar
catalogue, spanning redshifts 0.5–3.5, we derive the mean millimetre and far-infrared
quasar spectral energy distributions (SEDs) via a stacking analysis of Atacama Cosmology
Telescope and Herschel-Spectral and Photometric Imaging REceiver data. We
constrain the form of the far-infrared emission and find 3σ–4σ evidence for the thermal
Sunyaev-Zel’dovich (SZ) effect, characteristic of a hot ionized gas component with
thermal energy (6.2 ± 1.7) × 1060 erg. This amount of thermal energy is greater than
expected assuming only hot gas in virial equilibrium with the dark matter haloes of
(1 − 5) × 1012h
−1M that these systems are expected to occupy, though the highest
quasar mass estimates found in the literature could explain a large fraction of this
energy. Our measurements are consistent with quasars depositing up to (14.5±3.3) τ
−1
8
per cent of their radiative energy into their circumgalactic environment if their typical
period of quasar activity is τ8 × 10⁸ yr. For high quasar host masses, ∼ 1013h
−1M,
this percentage will be reduced. Furthermore, the uncertainty on this percentage is
only statistical and additional systematic uncertainties enter at the 40 per cent level.
The SEDs are dust dominated in all bands and we consider various models for dust
emission. While sufficiently complex dust models can obviate the SZ effect, the SZ
interpretation remains favoured at the 3σ–4σ level for most models.
EXTINCTION AND THE DIMMING OF KIC 8462852Sérgio Sacani
To test alternative hypotheses for the behavior of KIC 8462852, we obtained measurements of the star
over a wide wavelength range from the UV to the mid-infrared from October 2015 through December
2016, using Swift, Spitzer and at AstroLAB IRIS. The star faded in a manner similar to the longterm
fading seen in Kepler data about 1400 days previously. The dimming rate for the entire period
reported is 22.1 ± 9.7 milli-mag yr−1
in the Swift wavebands, with amounts of 21.0 ± 4.5 mmag in
the groundbased B measurements, 14.0 ± 4.5 mmag in V , and 13.0 ± 4.5 in R, and a rate of 5.0 ± 1.2
mmag yr−1 averaged over the two warm Spitzer bands. Although the dimming is small, it is seen at
& 3 σ by three different observatories operating from the UV to the IR. The presence of long-term
secular dimming means that previous SED models of the star based on photometric measurements
taken years apart may not be accurate. We find that stellar models with Tef f = 7000 - 7100 K and
AV ∼ 0.73 best fit the Swift data from UV to optical. These models also show no excess in the
near-simultaneous Spitzer photometry at 3.6 and 4.5 µm, although a longer wavelength excess from
a substantial debris disk is still possible (e.g., as around Fomalhaut). The wavelength dependence of
the fading favors a relatively neutral color (i.e., RV & 5, but not flat across all the bands) compared
with the extinction law for the general ISM (RV = 3.1), suggesting that the dimming arises from
circumstellar material
Observation of Bose–Einstein condensates in an Earth-orbiting research labSérgio Sacani
Quantum mechanics governs the microscopic world, where low mass and momentum
reveal a natural wave–particle duality. Magnifying quantum behaviour to
macroscopic scales is a major strength of the technique of cooling and trapping
atomic gases, in which low momentum is engineered through extremely low
temperatures. Advances in this feld have achieved such precise control over atomic
systems that gravity, often negligible when considering individual atoms, has
emerged as a substantial obstacle. In particular, although weaker trapping felds
would allow access to lower temperatures1,2
, gravity empties atom traps that are too
weak. Additionally, inertial sensors based on cold atoms could reach better
sensitivities if the free-fall time of the atoms after release from the trap could be made
longer3
. Planetary orbit, specifcally the condition of perpetual free-fall, ofers to lift
cold-atom studies beyond such terrestrial limitations. Here we report production of
rubidium Bose–Einstein condensates (BECs) in an Earth-orbiting research laboratory,
the Cold Atom Lab. We observe subnanokelvin BECs in weak trapping potentials with
free-expansion times extending beyond one second, providing an initial
demonstration of the advantages ofered by a microgravity environment for
cold-atom experiments and verifying the successful operation of this facility. With
routine BEC production, continuing operations will support long-term investigations
of trap topologies unique to microgravity4,5
, atom-laser sources6
, few-body physics7,8
and pathfnding techniques for atom-wave interferometry9–12
The puzzling source_in_ngc6388_a_possible_planetary_tidal_disruption_eventSérgio Sacani
Artigo descreve a descoberta da destruição de um planeta ao passar próximo a uma estrela do tipo anã branca presente dentro do aglomerado globular de estrelas NGC 6388. Para isso os astrônomos utilizaram um arsenal de telescópios.
A giant galaxy in the young Universe with a massive ringSérgio Sacani
In the local (redshift z ≈ 0) Universe, collisional ring galaxies make up only ~0.01% of galaxies1 and are formed by head-on galactic collisions that trigger radially propagating density waves2–4. These striking systems provide key snapshots for dissecting galactic disks and are studied extensively in the local Universe5–9. However, not much is known about distant (z > 0.1) collisional rings10–14. Here we present a detailed study of a ring galaxy at a look-back time of 10.8 Gyr (z = 2.19). Compared with our Milky Way, this galaxy has a similar stellar mass, but has a stellar half-light radius that is 1.5–2.2 times larger and is forming stars 50 times faster. The extended, dif- fuse stellar light outside the star-forming ring, combined with a radial velocity on the ring and an intruder galaxy nearby, provides evidence for this galaxy hosting a collisional ring. If the ring is secularly evolved15,16, the implied large bar in a giant disk would be inconsistent with the current understand- ing of the earliest formation of barred spirals17–21. Contrary to previous predictions10–12, this work suggests that massive col- lisional rings were as rare 11 Gyr ago as they are today. Our discovery offers a unique pathway for studying density waves in young galaxies, as well as constraining the cosmic evolution of spiral disks and galaxy groups.
We discovered two transient events in the Kepler eld with light curves that strongly suggest they
are type II-P supernovae. Using the fast cadence of the Kepler observations we precisely estimate
the rise time to maximum for KSN2011a and KSN2011d as 10.50:4 and 13.30:4 rest-frame days
respectively. Based on ts to idealized analytic models, we nd the progenitor radius of KSN2011a
(28020 R) to be signicantly smaller than that for KSN2011d (49020 R) but both have similar
explosion energies of 2.00:3 1051 erg.
The rising light curve of KSN2011d is an excellent match to that predicted by simple models of
exploding red supergiants (RSG). However, the early rise of KSN2011a is faster than the models
predict possibly due to the supernova shockwave moving into pre-existing wind or mass-loss from the
RSG. A mass loss rate of 10 4 M yr 1 from the RSG can explain the fast rise without impacting
the optical
ux at maximum light or the shape of the post-maximum light curve.
No shock breakout emission is seen in KSN2011a, but this is likely due to the circumstellar inter-
action suspected in the fast rising light curve. The early light curve of KSN2011d does show excess
emission consistent with model predictions of a shock breakout. This is the rst optical detection of
a shock breakout from a type II-P supernova.
WHERE IS THE FLUX GOING? THE LONG-TERM PHOTOMETRIC VARIABILITY OF BOYAJIAN’S ...Sérgio Sacani
We present ∼ 800 days of photometric monitoring of Boyajian’s Star (KIC 8462852) from the AllSky
Automated Survey for Supernovae (ASAS-SN) and ∼ 4000 days of monitoring from the All Sky
Automated Survey (ASAS). We show that from 2015 to the present the brightness of Boyajian’s Star
has steadily decreased at a rate of 6.3 ± 1.4 mmag yr−1
, such that the star is now 1.5% fainter than it
was in February 2015. Moreover, the longer time baseline afforded by ASAS suggests that Boyajian’s
Star has also undergone two brightening episodes in the past 11 years, rather than only exhibiting a
monotonic decline. We analyze a sample of ∼ 1000 comparison stars of similar brightness located in
the same ASAS-SN field and demonstrate that the recent fading is significant at & 99.4% confidence.
The 2015 − 2017 dimming rate is consistent with that measured with Kepler data for the time period
from 2009 to 2013. This long-term variability is difficult to explain with any of the physical models
for the star’s behavior proposed to date
TEMPORAL EVOLUTION OF THE HIGH-ENERGY IRRADIATION AND WATER CONTENT OF TRAPPI...Sérgio Sacani
The ultracool dwarf star TRAPPIST-1 hosts seven Earth-size transiting planets, some of which could
harbour liquid water on their surfaces. UV observations are essential to measure their high-energy
irradiation, and to search for photodissociated water escaping from their putative atmospheres. Our
new observations of TRAPPIST-1 Ly-α line during the transit of TRAPPIST-1c show an evolution of
the star emission over three months, preventing us from assessing the presence of an extended hydrogen
exosphere. Based on the current knowledge of the stellar irradiation, we investigated the likely history
of water loss in the system. Planets b to d might still be in a runaway phase, and planets within the
orbit of TRAPPIST-1g could have lost more than 20 Earth oceans after 8 Gyr of hydrodynamic escape.
However, TRAPPIST-1e to h might have lost less than 3 Earth oceans if hydrodynamic escape stopped
once they entered the habitable zone. We caution that these estimates remain limited by the large
uncertainty on the planet masses. They likely represent upper limits on the actual water loss because
our assumptions maximize the XUV-driven escape, while photodissociation in the upper atmospheres
should be the limiting process. Late-stage outgassing could also have contributed significant amounts
of water for the outer, more massive planets after they entered the habitable zone. While our results
suggest that the outer planets are the best candidates to search for water with the JWST, they also
highlight the need for theoretical studies and complementary observations in all wavelength domains
to determine the nature of the TRAPPIST-1 planets, and their potential habitability.
Keywords: planetary systems - Stars: individual: TRAPPIST-1
The physical conditions_in_a_pre_super_star_cluster_molecular_cloud_in_the_an...Sérgio Sacani
Artigo descreve estudo feitos pelos astrônomos utilizando o ALMA para descobrir um proto-aglomerado globular de estrelas gigantes se formando no interior das galáxias Antenas, o famoso par de galáxias em interação. É a primeira vez que os astrônomos conseguem observar um objeto desse tipo nos seus estágios iniciais de vida e com o ambiente ao redor inalterado.
Solving the Multimessenger Puzzle of the AGN-starburst Composite Galaxy NGC 1068Sérgio Sacani
Multiwavelength observations indicate that some starburst galaxies show a dominant nonthermal contribution from
their central region. These active galactic nuclei (AGN)-starburst composites are of special interest, as both
phenomena on their own are potential sources of highly energetic cosmic rays and associated γ-ray and neutrino
emission. In this work, a homogeneous, steady-state two-zone multimessenger model of the nonthermal emission
from the AGN corona as well as the circumnuclear starburst region is developed and subsequently applied to the
case of NGC 1068, which has recently shown some first indications of high-energy neutrino emission. Here, we
show that the entire spectrum of multimessenger data—from radio to γ-rays including the neutrino constraint—can
be described very well if both, starburst and AGN corona, are taken into account. Using only a single emission
region is not sufficient.
An almost dark galaxy with the mass of the Small Magellanic CloudSérgio Sacani
Almost Dark Galaxies are objects that have eluded detection by traditional surveys such as the Sloan Digital Sky Survey (SDSS). The
low surface brightness of these galaxies (µr(0)> 26 mag/arcsec2
), and hence their low surface stellar mass density (a few solar masses
per pc2 or less), suggests that the energy density released by baryonic feedback mechanisms is inefficient in modifying the distribution
of the dark matter halos they inhabit. For this reason, almost dark galaxies are particularly promising for probing the microphysical
nature of dark matter. In this paper, we present the serendipitous discovery of Nube, an almost dark galaxy with < µV >e∼ 26.7
mag/arcsec2
. The galaxy was identified using deep optical imaging from the IAC Stripe82 Legacy Project. Follow-up observations
with the 100m Green Bank Telescope strongly suggest that the galaxy is at a distance of 107 Mpc. Ultra-deep multi-band observations
with the 10.4m Gran Telescopio Canarias favour an age of ∼ 10 Gyr and a metallicity of [Fe/H]∼ −1.1. With a stellar mass of ∼ 4×10⁸
M⊙ and a half-mass radius of Re = 6.9 kpc (corresponding to an effective surface density of < Σ >e∼ 0.9 M⊙/pc2
), Nube is the most
massive and extended object of its kind discovered so far. The galaxy is ten times fainter and has an effective radius three times larger
than typical ultra-diffuse galaxies with similar stellar masses. Galaxies with comparable effective surface brightness within the Local
Group have very low mass (tens of 105 M⊙) and compact structures (effective radius Re < 1 kpc). Current cosmological simulations
within the cold dark matter scenario, including baryonic feedback, do not reproduce the structural properties of Nube. However, its
highly extended and flattened structure is consistent with a scenario where the dark matter particles are ultra-light axions with a mass
of mB=(0.8
+0.4
−0.2
)×10−23 eV
Detection of anisotropic satellite quenching in galaxy clusters up to z ∼ 1Sérgio Sacani
Satellite galaxies in the cluster environment are more likely to be quenched than galaxies in the general field. Recently, it has
been reported that satellite galaxy quenching depends on the orientation relative to their central galaxies: satellites along the
major axis of centrals are more likely to be quenched than those along the minor axis. In this paper, we report a detection
of such anisotropic quenching up to z ∼ 1 based on a large optically selected cluster catalogue constructed from the Hyper
Suprime-Cam Subaru Strategic Program. We calculate the quiescent satellite galaxy fraction as a function of orientation angle
measured from the major axis of central galaxies and find that the quiescent fractions at 0.25 < z < 1 are reasonably fitted
by sinusoidal functions with amplitudes of a few per cent. Anisotropy is clearer in inner regions (<r200m) of clusters and not
significant in cluster outskirts (>r200m). We also confirm that the observed anisotropy cannot be explained by differences in
local galaxy density or stellar mass distribution along the two axes. Quiescent fraction excesses between the two axes suggest
that the quenching efficiency contributing to the anisotropy is almost independent of stellar mass, at least down to our stellar
mass limit of M∗ = 1 × 10¹⁰ M. Finally, we argue that the physical origins of the observed anisotropy should have shorter
quenching time-scales than ∼ 1 Gyr, like ram-pressure stripping, because, for anisotropic quenching to be observed, satellites
must be quenched before their initial orientation angles are significantly changed.
The JWST Discovery of the Triply-imaged Type Ia “Supernova H0pe” and Observat...Sérgio Sacani
A Type Ia supernova (SN) at z = 1.78 was discovered in James Webb Space Telescope Near Infrared
Camera imaging of the galaxy cluster PLCK G165.7+67.0 (G165; z = 0.35). The SN is situated 1.5–
2 kpc from its host galaxy Arc 2 and appears in three different locations as a result of gravitational
lensing by G165. These data can yield a value for Hubble’s constant using time delays from this
multiply-imaged SN Ia that we call “SN H0pe.” Over the entire field we identified 21 image multiplicities,
confirmed five of them using Near-Infrared Spectrograph (NIRspec), and constructed a new
lens model that gives a total mass within 600 kpc of (2.6 ± 0.3) × 1014M⊙. The photometry uncovered
a galaxy overdensity at Arc 2’s redshift. NIRSpec confirmed six member galaxies, four of which
surround Arc 2 with relative velocity ≲900 km s−1 and projected physical extent ≲33 kpc. Arc 2
dominates the stellar mass ((5.0±0.1)×1011M⊙), which is a factor of ten higher than other members
of this compact galaxy group. These other group members have specific star formation rates (sSFR)
arXiv:2309.07326v1 [astro-ph.GA] 13 Sep 2023
2 Frye, Pascale, Pierel et al.
of 2–260 Gyr−1 derived from the Hα-line flux corrected for stellar absorption, dust extinction, and slit
losses. Another group centered on the dusty star forming galaxy Arc 1 is at z = 2.24. The total SFR
for the Arc 1 group (≳400M⊙ yr−1) translates to a supernova rate of ∼1 SNe yr−1, suggesting that
regular monitoring of this cluster may yield additional SNe.
Os astrônomos descobriram um processo único sobre como as maiores galáxias elípticas do universo continuam gerando estrelas muito tempo depois do anos de pico de nascimentos estelares. A alta resolução e a sensibilidade à radiação ultravioleta do Hubble, permitiu aos astrônomos observarem nós brilhantes de estrelas azuis, quentes, se formando juntamente com jatos de buracos negros ativos encontrados nos centros das gigantescas galáxias elípticas.
Combinando dados do Huubble com observações feitas por um conjunto de telescópios baseados tanto em Terra como no espaço, duas equipes independentes descobriram que os jatos dos buracos negros, e as estrelas recém-nascidas são todos partes de um ciclo auto-regulado. Jatos de alta energia atirados do buraco negro aquecem um halo de gás circulante, controlando a taxa com a qual o gás esfria e cai na galáxia.
“Pense no gás ao redor da galáxia como uma atmosfera”, explicou o líder do primeiro estudo, Megan Donahue, da Universidade Estadual do Michigan. “Essa atmosfera pode conter material em diferentes estados, do mesmo modo que a nossa atmosfera tem gás, nuvens e chuva. O que nós estamos vendo é um processo parecido com uma tempestade. À medida que os jatos impulsionam o gás para fora do centro da galáxia, parte do gás esfria e precipita em aglomerados frios que caem de volta para o centro da galáxia como gotas de chuvas”.
“As gotas de chuva eventualmente esfriam o suficiente para tornar-se nuvens de formação de estrelas de gás frio molecular, e a capacidade de observar no ultravioleta distante do Hubble, nos permitiu observar diretamente esses chuviscos de formação de estrelas”, explicou o líder do segundo estudo, Grant Tremblay, da Universidade de Yale. “Nós sabemos que esses chuviscos estão linkados com os jatos, pois eles foram encontrados em filamentos que se dobram ao redor dos jatos, ou abraçam as bordas de bolhas gigantes que os jatos inflaram”, disse Tremblay. “E eles terminam fazendo um redemoinho de gás de formação de estrelas ao redor do buraco negro central”.
The massive relic galaxy NGC 1277 is dark matter deficient From dynamical mod...Sérgio Sacani
According to the Λ cold dark matter (ΛCDM) cosmology, present-day galaxies with stellar masses M? > 1011 M should contain
a sizable fraction of dark matter within their stellar body. Models indicate that in massive early-type galaxies (ETGs) with M? ≈
1.5 × 10¹¹ M, dark matter should account for ∼15% of the dynamical mass within one effective radius (1 Re) and for ∼60% within
5 Re
. Most massive ETGs have been shaped through a two-phase process: the rapid growth of a compact core was followed by the
accretion of an extended envelope through mergers. The exceedingly rare galaxies that have avoided the second phase, the so-called
relic galaxies, are thought to be the frozen remains of the massive ETG population at z & 2. The best relic galaxy candidate discovered
to date is NGC 1277, in the Perseus cluster. We used deep integral field George and Cynthia Mitchel Spectrograph (GCMS) data to
revisit NGC 1277 out to an unprecedented radius of 6 kpc (corresponding to 5 Re). By using Jeans anisotropic modelling, we find
a negligible dark matter fraction within 5 Re (fDM(5 Re) < 0.05; two-sigma confidence level), which is in tension with the ΛCDM
expectation. Since the lack of an extended envelope would reduce dynamical friction and prevent the accretion of an envelope, we
propose that NGC 1277 lost its dark matter very early or that it was dark matter deficient ab initio. We discuss our discovery in the
framework of recent proposals, suggesting that some relic galaxies may result from dark matter stripping as they fell in and interacted
within galaxy clusters. Alternatively, NGC 1277 might have been born in a high-velocity collision of gas-rich proto-galactic fragments,
where dark matter left behind a disc of dissipative baryons. We speculate that the relative velocities of ≈2000 km s−1
required for the
latter process to happen were possible in the progenitors of the present-day rich galaxy clusters.
Exploring the nature and synchronicity of early cluster formation in the Larg...Sérgio Sacani
We analyse Hubble Space Telescope observations of six globular clusters in the Large Magel- lanic Cloud (LMC) from programme GO-14164 in Cycle 23. These are the deepest available observations of the LMC globular cluster population; their uniformity facilitates a precise comparison with globular clusters in the Milky Way. Measuring the magnitude of the main- sequence turn-off point relative to template Galactic globular clusters allows the relative ages of the clusters to be determined with a mean precision of 8.4 per cent, and down to 6 per cent for individual objects. We find that the mean age of our LMC cluster ensemble is identical to the mean age of the oldest metal-poor clusters in the Milky Way halo to 0.2 ± 0.4 Gyr. This provides the most sensitive test to date of the synchronicity of the earliest epoch of globular cluster formation in two independent galaxies. Horizontal branch magnitudes and subdwarf fitting to the main sequence allow us to determine distance estimates for each cluster and examine their geometric distribution in the LMC. Using two different methods, we find an average distance to the LMC of 18.52 ± 0.05.
The xmm newton-view_of_the_central_degrees_of_the_milk_waySérgio Sacani
Novas imagens do Observatório de Raios-X XMM-Newton da ESA revelaram alguns dos processos mais intensos que acontecem no coração da nossa Via Láctea.
As fontes brilhantes e pontuais que se destacam por toda imagem indicam os sistemas estelares binários onde uma das estrelas atingiu o final de sua vida, desenvolvendo para um objeto compacto e denso – uma estrela de nêutrons ou um buraco negro.
A região central da Via Láctea também contém jovens estrelas e aglomerados estelares e algumas dessas fontes são visíveis como pontos brancos e vermelhos brilhando na imagem, que se espalha por 1000 anos-luz.
A maior parte da ação ocorre no centro, onde nuvens difusas de gás estão sendo cavadas por ventos poderosos soprados por estrelas jovens, bem como por supernovas.
Probing the innermost_regions_of_agn_jets_and_their_magnetic_fields_with_radi...Sérgio Sacani
Desde 1974, observações feitas com o chamado Long Baseline Interferometry, ou VLBI, combinaram sinais de um objeto cósmico recebidos em diferentes rádio telescópios espalhados pelo globo para criar uma antena com o tamanho equivalente à maior separação entre elas. Isso fez com que fosse possível fazer imagens com uma nitidez sem precedentes, com uma resolução 1000 vezes melhor do que Hubble consegue na luz visível. Agora, uma equipe internacional de astrônomos quebrou todos os recordes combinando 15 rádio telescópios na Terra e a antena de rádio da missão RadioAstron, da agência espacial russa, na órbita da Terra. O trabalho, liderado pelo Instituto de Astrofísica de Andalucía, o IAA-CSIC, forneceu novas ideias sobre a natureza das galáxias ativas, onde um buraco negro extremamente massivo engole a matéria ao redor enquanto simultaneamente emite um par de jatos de partículas de alta energia e campos magnéticos a velocidades próximas da velocidade da luz.
Observações feitas no comprimento de onda das micro-ondas são essenciais para explorar esses jatos, já que os elétrons de alta energia se movendo em campos magnéticos são mais proficientes em produzir micro-ondas. Mas a maioria das galáxias ativas com jatos brilhantes estão a bilhões de anos-luz de distância da Terra, de modo que esses jatos são minúsculos no céu. Desse modo a alta resolução é essencial para observar esses jatos em ação e então revelar fenômenos como as ondas de choque e a turbulência que controla o quanto de luz é produzida num dado tempo. “Combinando pela primeira vez rádio telescópios na Terra com rádio telescópios no espaço, operando na máxima resolução, tem permitido que a nossa equipe crie uma antena que tem um tamanho equivalente a 8 vezes o diâmetro da Terra, correspondendo a 20 micro arcos de segundo”, disse José L; Gómez, o líder da equipe no Instituto de Astrofísica de Andalucía, IAA-CSIC.
Similar to The exceptional soft_x_ray_halo_of_the_galaxy_merger_ngc6240 (20)
Observation of Io’s Resurfacing via Plume Deposition Using Ground-based Adapt...Sérgio Sacani
Since volcanic activity was first discovered on Io from Voyager images in 1979, changes
on Io’s surface have been monitored from both spacecraft and ground-based telescopes.
Here, we present the highest spatial resolution images of Io ever obtained from a groundbased telescope. These images, acquired by the SHARK-VIS instrument on the Large
Binocular Telescope, show evidence of a major resurfacing event on Io’s trailing hemisphere. When compared to the most recent spacecraft images, the SHARK-VIS images
show that a plume deposit from a powerful eruption at Pillan Patera has covered part
of the long-lived Pele plume deposit. Although this type of resurfacing event may be common on Io, few have been detected due to the rarity of spacecraft visits and the previously low spatial resolution available from Earth-based telescopes. The SHARK-VIS instrument ushers in a new era of high resolution imaging of Io’s surface using adaptive
optics at visible wavelengths.
Earliest Galaxies in the JADES Origins Field: Luminosity Function and Cosmic ...Sérgio Sacani
We characterize the earliest galaxy population in the JADES Origins Field (JOF), the deepest
imaging field observed with JWST. We make use of the ancillary Hubble optical images (5 filters
spanning 0.4−0.9µm) and novel JWST images with 14 filters spanning 0.8−5µm, including 7 mediumband filters, and reaching total exposure times of up to 46 hours per filter. We combine all our data
at > 2.3µm to construct an ultradeep image, reaching as deep as ≈ 31.4 AB mag in the stack and
30.3-31.0 AB mag (5σ, r = 0.1” circular aperture) in individual filters. We measure photometric
redshifts and use robust selection criteria to identify a sample of eight galaxy candidates at redshifts
z = 11.5 − 15. These objects show compact half-light radii of R1/2 ∼ 50 − 200pc, stellar masses of
M⋆ ∼ 107−108M⊙, and star-formation rates of SFR ∼ 0.1−1 M⊙ yr−1
. Our search finds no candidates
at 15 < z < 20, placing upper limits at these redshifts. We develop a forward modeling approach to
infer the properties of the evolving luminosity function without binning in redshift or luminosity that
marginalizes over the photometric redshift uncertainty of our candidate galaxies and incorporates the
impact of non-detections. We find a z = 12 luminosity function in good agreement with prior results,
and that the luminosity function normalization and UV luminosity density decline by a factor of ∼ 2.5
from z = 12 to z = 14. We discuss the possible implications of our results in the context of theoretical
models for evolution of the dark matter halo mass function.
THE IMPORTANCE OF MARTIAN ATMOSPHERE SAMPLE RETURN.Sérgio Sacani
The return of a sample of near-surface atmosphere from Mars would facilitate answers to several first-order science questions surrounding the formation and evolution of the planet. One of the important aspects of terrestrial planet formation in general is the role that primary atmospheres played in influencing the chemistry and structure of the planets and their antecedents. Studies of the martian atmosphere can be used to investigate the role of a primary atmosphere in its history. Atmosphere samples would also inform our understanding of the near-surface chemistry of the planet, and ultimately the prospects for life. High-precision isotopic analyses of constituent gases are needed to address these questions, requiring that the analyses are made on returned samples rather than in situ.
Multi-source connectivity as the driver of solar wind variability in the heli...Sérgio Sacani
The ambient solar wind that flls the heliosphere originates from multiple
sources in the solar corona and is highly structured. It is often described
as high-speed, relatively homogeneous, plasma streams from coronal
holes and slow-speed, highly variable, streams whose source regions are
under debate. A key goal of ESA/NASA’s Solar Orbiter mission is to identify
solar wind sources and understand what drives the complexity seen in the
heliosphere. By combining magnetic feld modelling and spectroscopic
techniques with high-resolution observations and measurements, we show
that the solar wind variability detected in situ by Solar Orbiter in March
2022 is driven by spatio-temporal changes in the magnetic connectivity to
multiple sources in the solar atmosphere. The magnetic feld footpoints
connected to the spacecraft moved from the boundaries of a coronal hole
to one active region (12961) and then across to another region (12957). This
is refected in the in situ measurements, which show the transition from fast
to highly Alfvénic then to slow solar wind that is disrupted by the arrival of
a coronal mass ejection. Our results describe solar wind variability at 0.5 au
but are applicable to near-Earth observatories.
Gliese 12 b: A Temperate Earth-sized Planet at 12 pc Ideal for Atmospheric Tr...Sérgio Sacani
Recent discoveries of Earth-sized planets transiting nearby M dwarfs have made it possible to characterize the
atmospheres of terrestrial planets via follow-up spectroscopic observations. However, the number of such planets
receiving low insolation is still small, limiting our ability to understand the diversity of the atmospheric
composition and climates of temperate terrestrial planets. We report the discovery of an Earth-sized planet
transiting the nearby (12 pc) inactive M3.0 dwarf Gliese 12 (TOI-6251) with an orbital period (Porb) of 12.76 days.
The planet, Gliese 12 b, was initially identified as a candidate with an ambiguous Porb from TESS data. We
confirmed the transit signal and Porb using ground-based photometry with MuSCAT2 and MuSCAT3, and
validated the planetary nature of the signal using high-resolution images from Gemini/NIRI and Keck/NIRC2 as
well as radial velocity (RV) measurements from the InfraRed Doppler instrument on the Subaru 8.2 m telescope
and from CARMENES on the CAHA 3.5 m telescope. X-ray observations with XMM-Newton showed the host
star is inactive, with an X-ray-to-bolometric luminosity ratio of log 5.7 L L X bol » - . Joint analysis of the light
curves and RV measurements revealed that Gliese 12 b has a radius of 0.96 ± 0.05 R⊕,a3σ mass upper limit of
3.9 M⊕, and an equilibrium temperature of 315 ± 6 K assuming zero albedo. The transmission spectroscopy metric
(TSM) value of Gliese 12 b is close to the TSM values of the TRAPPIST-1 planets, adding Gliese 12 b to the small
list of potentially terrestrial, temperate planets amenable to atmospheric characterization with JWST.
Gliese 12 b, a temperate Earth-sized planet at 12 parsecs discovered with TES...Sérgio Sacani
We report on the discovery of Gliese 12 b, the nearest transiting temperate, Earth-sized planet found to date. Gliese 12 is a
bright (V = 12.6 mag, K = 7.8 mag) metal-poor M4V star only 12.162 ± 0.005 pc away from the Solar system with one of the
lowest stellar activity levels known for M-dwarfs. A planet candidate was detected by TESS based on only 3 transits in sectors
42, 43, and 57, with an ambiguity in the orbital period due to observational gaps. We performed follow-up transit observations
with CHEOPS and ground-based photometry with MINERVA-Australis, SPECULOOS, and Purple Mountain Observatory,
as well as further TESS observations in sector 70. We statistically validate Gliese 12 b as a planet with an orbital period of
12.76144 ± 0.00006 d and a radius of 1.0 ± 0.1 R⊕, resulting in an equilibrium temperature of ∼315 K. Gliese 12 b has excellent
future prospects for precise mass measurement, which may inform how planetary internal structure is affected by the stellar
compositional environment. Gliese 12 b also represents one of the best targets to study whether Earth-like planets orbiting cool
stars can retain their atmospheres, a crucial step to advance our understanding of habitability on Earth and across the galaxy.
The importance of continents, oceans and plate tectonics for the evolution of...Sérgio Sacani
Within the uncertainties of involved astronomical and biological parameters, the Drake Equation
typically predicts that there should be many exoplanets in our galaxy hosting active, communicative
civilizations (ACCs). These optimistic calculations are however not supported by evidence, which is
often referred to as the Fermi Paradox. Here, we elaborate on this long-standing enigma by showing
the importance of planetary tectonic style for biological evolution. We summarize growing evidence
that a prolonged transition from Mesoproterozoic active single lid tectonics (1.6 to 1.0 Ga) to modern
plate tectonics occurred in the Neoproterozoic Era (1.0 to 0.541 Ga), which dramatically accelerated
emergence and evolution of complex species. We further suggest that both continents and oceans
are required for ACCs because early evolution of simple life must happen in water but late evolution
of advanced life capable of creating technology must happen on land. We resolve the Fermi Paradox
(1) by adding two additional terms to the Drake Equation: foc
(the fraction of habitable exoplanets
with significant continents and oceans) and fpt
(the fraction of habitable exoplanets with significant
continents and oceans that have had plate tectonics operating for at least 0.5 Ga); and (2) by
demonstrating that the product of foc
and fpt
is very small (< 0.00003–0.002). We propose that the lack
of evidence for ACCs reflects the scarcity of long-lived plate tectonics and/or continents and oceans on
exoplanets with primitive life.
A Giant Impact Origin for the First Subduction on EarthSérgio Sacani
Hadean zircons provide a potential record of Earth's earliest subduction 4.3 billion years ago. Itremains enigmatic how subduction could be initiated so soon after the presumably Moon‐forming giant impact(MGI). Earlier studies found an increase in Earth's core‐mantle boundary (CMB) temperature due to theaccumulation of the impactor's core, and our recent work shows Earth's lower mantle remains largely solid, withsome of the impactor's mantle potentially surviving as the large low‐shear velocity provinces (LLSVPs). Here,we show that a hot post‐impact CMB drives the initiation of strong mantle plumes that can induce subductioninitiation ∼200 Myr after the MGI. 2D and 3D thermomechanical computations show that a high CMBtemperature is the primary factor triggering early subduction, with enrichment of heat‐producing elements inLLSVPs as another potential factor. The models link the earliest subduction to the MGI with implications forunderstanding the diverse tectonic regimes of rocky planets.
Climate extremes likely to drive land mammal extinction during next supercont...Sérgio Sacani
Mammals have dominated Earth for approximately 55 Myr thanks to their
adaptations and resilience to warming and cooling during the Cenozoic. All
life will eventually perish in a runaway greenhouse once absorbed solar
radiation exceeds the emission of thermal radiation in several billions of
years. However, conditions rendering the Earth naturally inhospitable to
mammals may develop sooner because of long-term processes linked to
plate tectonics (short-term perturbations are not considered here). In
~250 Myr, all continents will converge to form Earth’s next supercontinent,
Pangea Ultima. A natural consequence of the creation and decay of Pangea
Ultima will be extremes in pCO2 due to changes in volcanic rifting and
outgassing. Here we show that increased pCO2, solar energy (F⨀;
approximately +2.5% W m−2 greater than today) and continentality (larger
range in temperatures away from the ocean) lead to increasing warming
hostile to mammalian life. We assess their impact on mammalian
physiological limits (dry bulb, wet bulb and Humidex heat stress indicators)
as well as a planetary habitability index. Given mammals’ continued survival,
predicted background pCO2 levels of 410–816 ppm combined with increased
F⨀ will probably lead to a climate tipping point and their mass extinction.
The results also highlight how global landmass configuration, pCO2 and F⨀
play a critical role in planetary habitability.
Constraints on Neutrino Natal Kicks from Black-Hole Binary VFTS 243Sérgio Sacani
The recently reported observation of VFTS 243 is the first example of a massive black-hole binary
system with negligible binary interaction following black-hole formation. The black-hole mass (≈10M⊙)
and near-circular orbit (e ≈ 0.02) of VFTS 243 suggest that the progenitor star experienced complete
collapse, with energy-momentum being lost predominantly through neutrinos. VFTS 243 enables us to
constrain the natal kick and neutrino-emission asymmetry during black-hole formation. At 68% confidence
level, the natal kick velocity (mass decrement) is ≲10 km=s (≲1.0M⊙), with a full probability distribution
that peaks when ≈0.3M⊙ were ejected, presumably in neutrinos, and the black hole experienced a natal
kick of 4 km=s. The neutrino-emission asymmetry is ≲4%, with best fit values of ∼0–0.2%. Such a small
neutrino natal kick accompanying black-hole formation is in agreement with theoretical predictions.
Detectability of Solar Panels as a TechnosignatureSérgio Sacani
In this work, we assess the potential detectability of solar panels made of silicon on an Earth-like
exoplanet as a potential technosignature. Silicon-based photovoltaic cells have high reflectance in the
UV-VIS and in the near-IR, within the wavelength range of a space-based flagship mission concept
like the Habitable Worlds Observatory (HWO). Assuming that only solar energy is used to provide
the 2022 human energy needs with a land cover of ∼ 2.4%, and projecting the future energy demand
assuming various growth-rate scenarios, we assess the detectability with an 8 m HWO-like telescope.
Assuming the most favorable viewing orientation, and focusing on the strong absorption edge in the
ultraviolet-to-visible (0.34 − 0.52 µm), we find that several 100s of hours of observation time is needed
to reach a SNR of 5 for an Earth-like planet around a Sun-like star at 10pc, even with a solar panel
coverage of ∼ 23% land coverage of a future Earth. We discuss the necessity of concepts like Kardeshev
Type I/II civilizations and Dyson spheres, which would aim to harness vast amounts of energy. Even
with much larger populations than today, the total energy use of human civilization would be orders of
magnitude below the threshold for causing direct thermal heating or reaching the scale of a Kardashev
Type I civilization. Any extraterrrestrial civilization that likewise achieves sustainable population
levels may also find a limit on its need to expand, which suggests that a galaxy-spanning civilization
as imagined in the Fermi paradox may not exist.
Jet reorientation in central galaxies of clusters and groups: insights from V...Sérgio Sacani
Recent observations of galaxy clusters and groups with misalignments between their central AGN jets
and X-ray cavities, or with multiple misaligned cavities, have raised concerns about the jet – bubble
connection in cooling cores, and the processes responsible for jet realignment. To investigate the
frequency and causes of such misalignments, we construct a sample of 16 cool core galaxy clusters and
groups. Using VLBA radio data we measure the parsec-scale position angle of the jets, and compare
it with the position angle of the X-ray cavities detected in Chandra data. Using the overall sample
and selected subsets, we consistently find that there is a 30% – 38% chance to find a misalignment
larger than ∆Ψ = 45◦ when observing a cluster/group with a detected jet and at least one cavity. We
determine that projection may account for an apparently large ∆Ψ only in a fraction of objects (∼35%),
and given that gas dynamical disturbances (as sloshing) are found in both aligned and misaligned
systems, we exclude environmental perturbation as the main driver of cavity – jet misalignment.
Moreover, we find that large misalignments (up to ∼ 90◦
) are favored over smaller ones (45◦ ≤ ∆Ψ ≤
70◦
), and that the change in jet direction can occur on timescales between one and a few tens of Myr.
We conclude that misalignments are more likely related to actual reorientation of the jet axis, and we
discuss several engine-based mechanisms that may cause these dramatic changes.
The solar dynamo begins near the surfaceSérgio Sacani
The magnetic dynamo cycle of the Sun features a distinct pattern: a propagating
region of sunspot emergence appears around 30° latitude and vanishes near the
equator every 11 years (ref. 1). Moreover, longitudinal flows called torsional oscillations
closely shadow sunspot migration, undoubtedly sharing a common cause2. Contrary
to theories suggesting deep origins of these phenomena, helioseismology pinpoints
low-latitude torsional oscillations to the outer 5–10% of the Sun, the near-surface
shear layer3,4. Within this zone, inwardly increasing differential rotation coupled with
a poloidal magnetic field strongly implicates the magneto-rotational instability5,6,
prominent in accretion-disk theory and observed in laboratory experiments7.
Together, these two facts prompt the general question: whether the solar dynamo is
possibly a near-surface instability. Here we report strong affirmative evidence in stark
contrast to traditional models8 focusing on the deeper tachocline. Simple analytic
estimates show that the near-surface magneto-rotational instability better explains
the spatiotemporal scales of the torsional oscillations and inferred subsurface
magnetic field amplitudes9. State-of-the-art numerical simulations corroborate these
estimates and reproduce hemispherical magnetic current helicity laws10. The dynamo
resulting from a well-understood near-surface phenomenon improves prospects
for accurate predictions of full magnetic cycles and space weather, affecting the
electromagnetic infrastructure of Earth.
Extensive Pollution of Uranus and Neptune’s Atmospheres by Upsweep of Icy Mat...Sérgio Sacani
In the Nice model of solar system formation, Uranus and Neptune undergo an orbital upheaval,
sweeping through a planetesimal disk. The region of the disk from which material is accreted by
the ice giants during this phase of their evolution has not previously been identified. We perform
direct N-body orbital simulations of the four giant planets to determine the amount and origin of solid
accretion during this orbital upheaval. We find that the ice giants undergo an extreme bombardment
event, with collision rates as much as ∼3 per hour assuming km-sized planetesimals, increasing the
total planet mass by up to ∼0.35%. In all cases, the initially outermost ice giant experiences the
largest total enhancement. We determine that for some plausible planetesimal properties, the resulting
atmospheric enrichment could potentially produce sufficient latent heat to alter the planetary cooling
timescale according to existing models. Our findings suggest that substantial accretion during this
phase of planetary evolution may have been sufficient to impact the atmospheric composition and
thermal evolution of the ice giants, motivating future work on the fate of deposited solid material.
Exomoons & Exorings with the Habitable Worlds Observatory I: On the Detection...Sérgio Sacani
The highest priority recommendation of the Astro2020 Decadal Survey for space-based astronomy
was the construction of an observatory capable of characterizing habitable worlds. In this paper series
we explore the detectability of and interference from exomoons and exorings serendipitously observed
with the proposed Habitable Worlds Observatory (HWO) as it seeks to characterize exoplanets, starting
in this manuscript with Earth-Moon analog mutual events. Unlike transits, which only occur in systems
viewed near edge-on, shadow (i.e., solar eclipse) and lunar eclipse mutual events occur in almost every
star-planet-moon system. The cadence of these events can vary widely from ∼yearly to multiple events
per day, as was the case in our younger Earth-Moon system. Leveraging previous space-based (EPOXI)
lightcurves of a Moon transit and performance predictions from the LUVOIR-B concept, we derive
the detectability of Moon analogs with HWO. We determine that Earth-Moon analogs are detectable
with observation of ∼2-20 mutual events for systems within 10 pc, and larger moons should remain
detectable out to 20 pc. We explore the extent to which exomoon mutual events can mimic planet
features and weather. We find that HWO wavelength coverage in the near-IR, specifically in the 1.4 µm
water band where large moons can outshine their host planet, will aid in differentiating exomoon signals
from exoplanet variability. Finally, we predict that exomoons formed through collision processes akin
to our Moon are more likely to be detected in younger systems, where shorter orbital periods and
favorable geometry enhance the probability and frequency of mutual events.
Emergent ribozyme behaviors in oxychlorine brines indicate a unique niche for...Sérgio Sacani
Mars is a particularly attractive candidate among known astronomical objects
to potentially host life. Results from space exploration missions have provided
insights into Martian geochemistry that indicate oxychlorine species, particularly perchlorate, are ubiquitous features of the Martian geochemical landscape. Perchlorate presents potential obstacles for known forms of life due to
its toxicity. However, it can also provide potential benefits, such as producing
brines by deliquescence, like those thought to exist on present-day Mars. Here
we show perchlorate brines support folding and catalysis of functional RNAs,
while inactivating representative protein enzymes. Additionally, we show
perchlorate and other oxychlorine species enable ribozyme functions,
including homeostasis-like regulatory behavior and ribozyme-catalyzed
chlorination of organic molecules. We suggest nucleic acids are uniquely wellsuited to hypersaline Martian environments. Furthermore, Martian near- or
subsurface oxychlorine brines, and brines found in potential lifeforms, could
provide a unique niche for biomolecular evolution.
Continuum emission from within the plunging region of black hole discsSérgio Sacani
The thermal continuum emission observed from accreting black holes across X-ray bands has the potential to be leveraged as a
powerful probe of the mass and spin of the central black hole. The vast majority of existing ‘continuum fitting’ models neglect
emission sourced at and within the innermost stable circular orbit (ISCO) of the black hole. Numerical simulations, however,
find non-zero emission sourced from these regions. In this work, we extend existing techniques by including the emission
sourced from within the plunging region, utilizing new analytical models that reproduce the properties of numerical accretion
simulations. We show that in general the neglected intra-ISCO emission produces a hot-and-small quasi-blackbody component,
but can also produce a weak power-law tail for more extreme parameter regions. A similar hot-and-small blackbody component
has been added in by hand in an ad hoc manner to previous analyses of X-ray binary spectra. We show that the X-ray spectrum
of MAXI J1820+070 in a soft-state outburst is extremely well described by a full Kerr black hole disc, while conventional
models that neglect intra-ISCO emission are unable to reproduce the data. We believe this represents the first robust detection of
intra-ISCO emission in the literature, and allows additional constraints to be placed on the MAXI J1820 + 070 black hole spin
which must be low a• < 0.5 to allow a detectable intra-ISCO region. Emission from within the ISCO is the dominant emission
component in the MAXI J1820 + 070 spectrum between 6 and 10 keV, highlighting the necessity of including this region. Our
continuum fitting model is made publicly available.
WASP-69b’s Escaping Envelope Is Confined to a Tail Extending at Least 7 RpSérgio Sacani
Studying the escaping atmospheres of highly irradiated exoplanets is critical for understanding the physical
mechanisms that shape the demographics of close-in planets. A number of planetary outflows have been observed
as excess H/He absorption during/after transit. Such an outflow has been observed for WASP-69b by multiple
groups that disagree on the geometry and velocity structure of the outflow. Here, we report the detection of this
planet’s outflow using Keck/NIRSPEC for the first time. We observed the outflow 1.28 hr after egress until the
target set, demonstrating the outflow extends at least 5.8 × 10⁵ km or 7.5 Rp This detection is significantly longer
than previous observations, which report an outflow extending ∼2.2 planet radii just 1 yr prior. The outflow is
blueshifted by −23 km s−1 in the planetary rest frame. We estimate a current mass-loss rate of 1 M⊕ Gyr−1
. Our
observations are most consistent with an outflow that is strongly sculpted by ram pressure from the stellar wind.
However, potential variability in the outflow could be due to time-varying interactions with the stellar wind or
differences in instrumental precision.
X-rays from a Central “Exhaust Vent” of the Galactic Center ChimneySérgio Sacani
Using deep archival observations from the Chandra X-ray Observatory, we present an analysis of
linear X-ray-emitting features located within the southern portion of the Galactic center chimney,
and oriented orthogonal to the Galactic plane, centered at coordinates l = 0.08◦
, b = −1.42◦
. The
surface brightness and hardness ratio patterns are suggestive of a cylindrical morphology which may
have been produced by a plasma outflow channel extending from the Galactic center. Our fits of the
feature’s spectra favor a complex two-component model consisting of thermal and recombining plasma
components, possibly a sign of shock compression or heating of the interstellar medium by outflowing
material. Assuming a recombining plasma scenario, we further estimate the cooling timescale of this
plasma to be on the order of a few hundred to thousands of years, leading us to speculate that a
sequence of accretion events onto the Galactic Black Hole may be a plausible quasi-continuous energy
source to sustain the observed morphology
Threats to mobile devices are more prevalent and increasing in scope and complexity. Users of mobile devices desire to take full advantage of the features
available on those devices, but many of the features provide convenience and capability but sacrifice security. This best practices guide outlines steps the users can take to better protect personal devices and information.
GraphRAG is All You need? LLM & Knowledge GraphGuy Korland
Guy Korland, CEO and Co-founder of FalkorDB, will review two articles on the integration of language models with knowledge graphs.
1. Unifying Large Language Models and Knowledge Graphs: A Roadmap.
https://arxiv.org/abs/2306.08302
2. Microsoft Research's GraphRAG paper and a review paper on various uses of knowledge graphs:
https://www.microsoft.com/en-us/research/blog/graphrag-unlocking-llm-discovery-on-narrative-private-data/
GridMate - End to end testing is a critical piece to ensure quality and avoid...ThomasParaiso2
End to end testing is a critical piece to ensure quality and avoid regressions. In this session, we share our journey building an E2E testing pipeline for GridMate components (LWC and Aura) using Cypress, JSForce, FakerJS…
DevOps and Testing slides at DASA ConnectKari Kakkonen
My and Rik Marselis slides at 30.5.2024 DASA Connect conference. We discuss about what is testing, then what is agile testing and finally what is Testing in DevOps. Finally we had lovely workshop with the participants trying to find out different ways to think about quality and testing in different parts of the DevOps infinity loop.
GraphSummit Singapore | The Future of Agility: Supercharging Digital Transfor...Neo4j
Leonard Jayamohan, Partner & Generative AI Lead, Deloitte
This keynote will reveal how Deloitte leverages Neo4j’s graph power for groundbreaking digital twin solutions, achieving a staggering 100x performance boost. Discover the essential role knowledge graphs play in successful generative AI implementations. Plus, get an exclusive look at an innovative Neo4j + Generative AI solution Deloitte is developing in-house.
Essentials of Automations: The Art of Triggers and Actions in FMESafe Software
In this second installment of our Essentials of Automations webinar series, we’ll explore the landscape of triggers and actions, guiding you through the nuances of authoring and adapting workspaces for seamless automations. Gain an understanding of the full spectrum of triggers and actions available in FME, empowering you to enhance your workspaces for efficient automation.
We’ll kick things off by showcasing the most commonly used event-based triggers, introducing you to various automation workflows like manual triggers, schedules, directory watchers, and more. Plus, see how these elements play out in real scenarios.
Whether you’re tweaking your current setup or building from the ground up, this session will arm you with the tools and insights needed to transform your FME usage into a powerhouse of productivity. Join us to discover effective strategies that simplify complex processes, enhancing your productivity and transforming your data management practices with FME. Let’s turn complexity into clarity and make your workspaces work wonders!
Elevating Tactical DDD Patterns Through Object CalisthenicsDorra BARTAGUIZ
After immersing yourself in the blue book and its red counterpart, attending DDD-focused conferences, and applying tactical patterns, you're left with a crucial question: How do I ensure my design is effective? Tactical patterns within Domain-Driven Design (DDD) serve as guiding principles for creating clear and manageable domain models. However, achieving success with these patterns requires additional guidance. Interestingly, we've observed that a set of constraints initially designed for training purposes remarkably aligns with effective pattern implementation, offering a more ‘mechanical’ approach. Let's explore together how Object Calisthenics can elevate the design of your tactical DDD patterns, offering concrete help for those venturing into DDD for the first time!
Securing your Kubernetes cluster_ a step-by-step guide to success !KatiaHIMEUR1
Today, after several years of existence, an extremely active community and an ultra-dynamic ecosystem, Kubernetes has established itself as the de facto standard in container orchestration. Thanks to a wide range of managed services, it has never been so easy to set up a ready-to-use Kubernetes cluster.
However, this ease of use means that the subject of security in Kubernetes is often left for later, or even neglected. This exposes companies to significant risks.
In this talk, I'll show you step-by-step how to secure your Kubernetes cluster for greater peace of mind and reliability.
Why You Should Replace Windows 11 with Nitrux Linux 3.5.0 for enhanced perfor...SOFTTECHHUB
The choice of an operating system plays a pivotal role in shaping our computing experience. For decades, Microsoft's Windows has dominated the market, offering a familiar and widely adopted platform for personal and professional use. However, as technological advancements continue to push the boundaries of innovation, alternative operating systems have emerged, challenging the status quo and offering users a fresh perspective on computing.
One such alternative that has garnered significant attention and acclaim is Nitrux Linux 3.5.0, a sleek, powerful, and user-friendly Linux distribution that promises to redefine the way we interact with our devices. With its focus on performance, security, and customization, Nitrux Linux presents a compelling case for those seeking to break free from the constraints of proprietary software and embrace the freedom and flexibility of open-source computing.
GraphSummit Singapore | The Art of the Possible with Graph - Q2 2024Neo4j
Neha Bajwa, Vice President of Product Marketing, Neo4j
Join us as we explore breakthrough innovations enabled by interconnected data and AI. Discover firsthand how organizations use relationships in data to uncover contextual insights and solve our most pressing challenges – from optimizing supply chains, detecting fraud, and improving customer experiences to accelerating drug discoveries.
Dr. Sean Tan, Head of Data Science, Changi Airport Group
Discover how Changi Airport Group (CAG) leverages graph technologies and generative AI to revolutionize their search capabilities. This session delves into the unique search needs of CAG’s diverse passengers and customers, showcasing how graph data structures enhance the accuracy and relevance of AI-generated search results, mitigating the risk of “hallucinations” and improving the overall customer journey.
PHP Frameworks: I want to break free (IPC Berlin 2024)Ralf Eggert
In this presentation, we examine the challenges and limitations of relying too heavily on PHP frameworks in web development. We discuss the history of PHP and its frameworks to understand how this dependence has evolved. The focus will be on providing concrete tips and strategies to reduce reliance on these frameworks, based on real-world examples and practical considerations. The goal is to equip developers with the skills and knowledge to create more flexible and future-proof web applications. We'll explore the importance of maintaining autonomy in a rapidly changing tech landscape and how to make informed decisions in PHP development.
This talk is aimed at encouraging a more independent approach to using PHP frameworks, moving towards a more flexible and future-proof approach to PHP development.
Sudheer Mechineni, Head of Application Frameworks, Standard Chartered Bank
Discover how Standard Chartered Bank harnessed the power of Neo4j to transform complex data access challenges into a dynamic, scalable graph database solution. This keynote will cover their journey from initial adoption to deploying a fully automated, enterprise-grade causal cluster, highlighting key strategies for modelling organisational changes and ensuring robust disaster recovery. Learn how these innovations have not only enhanced Standard Chartered Bank’s data infrastructure but also positioned them as pioneers in the banking sector’s adoption of graph technology.
Pushing the limits of ePRTC: 100ns holdover for 100 daysAdtran
At WSTS 2024, Alon Stern explored the topic of parametric holdover and explained how recent research findings can be implemented in real-world PNT networks to achieve 100 nanoseconds of accuracy for up to 100 days.
GDG Cloud Southlake #33: Boule & Rebala: Effective AppSec in SDLC using Deplo...James Anderson
Effective Application Security in Software Delivery lifecycle using Deployment Firewall and DBOM
The modern software delivery process (or the CI/CD process) includes many tools, distributed teams, open-source code, and cloud platforms. Constant focus on speed to release software to market, along with the traditional slow and manual security checks has caused gaps in continuous security as an important piece in the software supply chain. Today organizations feel more susceptible to external and internal cyber threats due to the vast attack surface in their applications supply chain and the lack of end-to-end governance and risk management.
The software team must secure its software delivery process to avoid vulnerability and security breaches. This needs to be achieved with existing tool chains and without extensive rework of the delivery processes. This talk will present strategies and techniques for providing visibility into the true risk of the existing vulnerabilities, preventing the introduction of security issues in the software, resolving vulnerabilities in production environments quickly, and capturing the deployment bill of materials (DBOM).
Speakers:
Bob Boule
Robert Boule is a technology enthusiast with PASSION for technology and making things work along with a knack for helping others understand how things work. He comes with around 20 years of solution engineering experience in application security, software continuous delivery, and SaaS platforms. He is known for his dynamic presentations in CI/CD and application security integrated in software delivery lifecycle.
Gopinath Rebala
Gopinath Rebala is the CTO of OpsMx, where he has overall responsibility for the machine learning and data processing architectures for Secure Software Delivery. Gopi also has a strong connection with our customers, leading design and architecture for strategic implementations. Gopi is a frequent speaker and well-known leader in continuous delivery and integrating security into software delivery.
Unlocking Productivity: Leveraging the Potential of Copilot in Microsoft 365, a presentation by Christoforos Vlachos, Senior Solutions Manager – Modern Workplace, Uni Systems
The exceptional soft_x_ray_halo_of_the_galaxy_merger_ngc6240
1. arXiv:1301.5907v1[astro-ph.CO]24Jan2013
The Exceptional Soft X-ray Halo of the Galaxy Merger NGC 6240
E. Nardini1,2
, Junfeng Wang1,3
, G. Fabbiano1
, M. Elvis1
, S. Pellegrini4
, G. Risaliti1,5
,
M. Karovska1
, A. Zezas1,6
e.nardini@keele.ac.uk
ABSTRACT
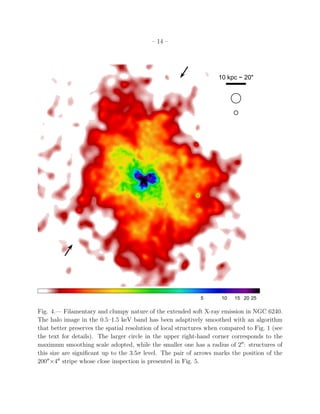
We report on a recent ∼150-ks long Chandra observation of the ultraluminous
infrared galaxy merger NGC 6240, which allows a detailed investigation of the dif-
fuse galactic halo. Extended soft X-ray emission is detected at the 3σ confidence
level over a diamond-shaped region with projected physical size of ∼110×80 kpc,
and a single-component thermal model provides a reasonably good fit to the ob-
served X-ray spectrum. The hot gas has a temperature of ∼7.5 million K, an
estimated density of 2.5×10⁻³
cm−3
, and a total mass of ∼1010
M⊙, resulting in
an intrinsic 0.4–2.5 keV luminosity of 4×1041
erg s−1
. The average temperature
of 0.65 keV is quite high to be obviously related to either the binding energy
in the dark-matter gravitational potential of the system or the energy dissipa-
tion and shocks following the galactic collision, yet the spatially-resolved spectral
analysis reveals limited variations across the halo. The relative abundance of the
main α-elements with respect to iron is several times the solar value, and nearly
constant as well, implying a uniform enrichment by type II supernovae out to the
largest scales. Taken as a whole, the observational evidence is not compatible
with a superwind originated by a recent, nuclear starburst, but rather hints at
widespread, enhanced star formation proceeding at steady rate over the entire
dynamical timescale (∼200 Myr). The preferred scenario is that of a starburst-
processed gas component gently expanding into, and mixing with, a pre-existing
1
Harvard-Smithsonian Center for Astrophysics, 60 Garden Street, Cambridge, MA 02138, USA
2
Current Address: Astrophysics Group, School of Physical and Geographical Sciences, Keele University,
Keele, Staffordshire ST5 5BG, UK
3
Current Address: Department of Physics and Astronomy and Center for Interdisciplinary Exploration
and Research in Astronomy, Northwestern University, 2145 Sheridan Road, Evanston, IL 60208, USA
4
Dipartimento di Fisica e Astronomia, Universit`a di Bologna, v.le Berti Pichat 6/2, 40127 Bologna, Italy
5
INAF - Osservatorio Astrofisico di Arcetri, L.go E. Fermi 5, 50125 Firenze, Italy
6
Physics Department, University of Crete, P.O. Box 2208, GR-710 03, Heraklion, Crete, Greece
2. – 2 –
halo medium of lower metallicity (Z ∼ 0.1 solar) and temperature (kT ∼ 0.25
keV). This picture cannot be probed more extensively with the present data, and
the ultimate fate of the diffuse, hot gas remains uncertain. Under some favorable
conditions, at least a fraction of it might be retained after the merger completion,
and evolve into the hot halo of a young elliptical galaxy.
Subject headings: galaxies: active — galaxies: starburst — galaxies: halos —
galaxies: individual (NGC 6240) — X-rays: galaxies
1. Introduction
NGC 6240 (z ≃ 0.0245; Downes et al. 1993) is one of the most impressive galaxy merg-
ers in the local Universe. In the framework of hierarchical structure assembly, the remnant
of the collision between two gas-rich spirals likely goes through a bright quasar phase, and
eventually relaxes into a quiescent elliptical galaxy (e.g., Toomre & Toomre 1972; Schweizer
1986; Barnes & Hernquist 1992; Hopkins et al. 2008; and references therein). The gravi-
tational instabilities at work during a major merger trigger an extensive gas redistribution,
which consequently fuels both intense star formation and efficient black-hole accretion. Due
to the large dust opacity to the intrinsic radiation field of this composite energy source (i.e.,
starburst and active galactic nucleus, AGN), the bulk of the bolometric luminosity possibly
emerges at infrared wavelengths. The ultimate merging systems are thus found among the
so-called Ultraluminous Infrared Galaxies (ULIRGs, LIR ∼ Lbol > 1012
L⊙; Lonsdale et al.
2006). With an energy output of ∼7×10¹¹
L⊙ at 8–1000 µm (e.g., Sanders & Mirabel 1996),
NGC 6240 falls slightly below this threshold, yet its global features are ordinary in ULIRGs,
and it is usually included in this class (Genzel et al. 1998).
The optical morphology of NGC 6240 is highly disturbed, with long tidal tails and a
distorted disk obstructed by broad dust lanes (Fosbury & Wall 1979; Gerssen et al. 2004).
The central kpc harbors two nuclei, whose position and relative separation are wavelength-
dependent owing to the significant obscuration (Schulz et al. 1993; Max et al. 2007). A huge
amount (several ×109
M⊙) of molecular gas is concentrated in between (Tacconi et al. 1999;
Iono et al. 2007), giving rise to exceptional, shock-excited H2 line emission in the near-IR
(Joseph et al. 1984; Ohyama et al. 2003). The surrounding butterfly-shaped Hα nebula
shows filaments and loops, consistent with the expansion of superwind bubbles (Heckman et
al. 1987; Lira et al. 2002). When not destroyed by the hard X-ray photons, also some dust is
apparently entrained in these outflows (Bush et al. 2008). A soft X-ray component extended
out to ∼10 kpc, and possibly beyond, was first detected by ROSAT (Komossa et al. 1998),
while Chandra enabled the discovery of a buried AGN in each of the two nuclei (Komossa et
3. – 3 –
al. 2003). This dual AGN character has been later supported by radio (Gallimore & Beswick
2004) and mid-IR (Risaliti et al. 2006) observations.
By virtue of its proximity and overall complexity, NGC 6240 is a unique source in
various respects, whose study is extremely relevant to address many critical issues, including
the transformation of galaxies through major mergers, the connection between AGN and
starburst activity, the impact of AGN feedback and starburst superwinds, the chemical
enrichment of the interstellar and intergalactic medium, the correlation between the host-
galaxy bulges and their central supermassive black holes. In particular, as a dual AGN
encounter close to the final coalescence, NGC 6240 represents a rare opportunity to directly
witness a phenomenon thought to be common in the earlier cosmic epochs (Engel et al.
2010a), but still not completely understood because of the dearth of observational constraints
available in the present-day Universe.
Taking advantage of the great improvement in data quality achieved through a recent
Chandra observation, here we explore the physical properties of the diffuse gas responsible
for the large-scale (r > 15′′
≃ 7.5 kpc), soft X-ray emission of NGC 6240, and investigate
into its nature to extract some crucial information on the origin and evolution of the whole
system. The luminosity of this ∼100-kpc wide, hot halo is quite high for normal early-type
galaxies (Fabbiano et al. 1992), and more typical of the central objects in small groups and
clusters (O’Sullivan et al. 2001a). If this were the case, the X-ray halo would be almost
in virial equilibrium, and its luminosity would persist even after the merger completion. A
companion paper (Wang et al. 2013a, in prep.) deals with the sub-arcsec resolution X-ray
image of the nuclear region, focusing on the diffuse 5.5–8 keV emission, and indicating the
presence of fast shocks in the ∼70 million K hot gas phase. The detailed analysis of the
soft X-ray emission in the intermediate nebular region (r < 15′′
), which is pervaded by a
starburst-driven wind, will be presented in a third, forthcoming paper (Wang et al. 2013b,
in prep.).
This work is organized as follows: in Section 2 we provide the basic details about
observations and data reduction. Sections 3 and 4 concern the analysis of the X-ray images
and spectra, respectively. The implications of our results on the nature of the halo are
discussed in Section 5, and conclusion are drawn in Section 6. The luminosity distance of 107
Mpc and the angular scale of 492 pc arcsec−1
are assumed throughout for NGC 6240, based
on the latest concordance cosmological parameters (H0 = 70.5 km s−1
Mpc−1
, Ωm = 0.27,
ΩΛ = 0.73; Komatsu et al. 2011).
4. – 4 –
2. Observations and Data Reduction
This work is motivated by the most recent Chandra observation of NGC 6240 (ObsID
12713; PI: G. Fabbiano), which started on 2011 May 31 and yielded the deepest exposure
of the source available to date (∼145 ks). NGC 6240 had been previously targeted within
the Chandra guaranteed observing time program on several occasions. The imaging snap-
shot taken in February 2000 with the High Resolution Camera revealed the highly complex
morphological properties in the central region, with the remarkable correlation between the
X-ray emission contours and the Hα filamentary structures (Lira et al. 2002). The follow-
ing 37-ks observation (hereafter ObsID 1590) performed with the Advanced CCD Imaging
Spectrometer (ACIS-S) detector clearly established the AGN nature of the two nuclei, which
are both characterized by flat reflection spectra and prominent iron Kα lines, and definitely
confirmed the tight connection between the circumnuclear soft X-ray emission and starburst
activity (Komossa et al. 2003). ACIS-S was also used in combination with the High-Energy
Transmission Grating (HETG) in two consecutive observations in May 2006 (ObsID 6908/9),
for an integration time of ∼300 ks. The first order spectrum is quite faint (Shu et al. 2011),
but results in a better resolution of the complex iron K-shell emission at 6.4–7.1 keV with
respect to previous XMM-Newton-based studies (Boller et al. 2003; Netzer et al. 2005).
The ACIS-S data products for ObsID 12713 provided by the Chandra X-ray Center, as
well as all the archival ones, were reprocessed through the chandra repro script using the
v4.4.6 Calibration Database (CALDB), and analyzed with the ciao v4.4 and heasoft v6.12
software packages. In the preliminary stages we also considered the two grating observations.
However, differently from the spatially-resolved analysis of the nuclear hard X-ray emission
presented in Wang et al. (2013a), the HETG zeroth orders turned out to be unsuitable
for the study of soft, extended emission in the halo. Indeed, the 0.5–1.5 keV background
level of ObsID 6908/9 is nearly 5 times higher than that of ObsID 12713. Combined with
the large difference in effective area (by roughly a factor of 12 around 1 keV),1
this leads
to a significant worsening of the overall signal-to-noise ratio (S/N) when all data sets are
taken into account, against a modest improvement in terms of cumulative net counts (less
than 10%; Table 1). In addition, the soft X-ray emission clearly stretches out to the area of
the detector over which the diffracted spectral orders are projected, preventing an accurate
determination of the halo surface brightness along the HETG dispersion cones.2
We therefore dropped ObsID 6908/9, and employed in this work the two standard ACIS-
1
http://cxc.harvard.edu/cgi-bin/build_viewer.cgi?ea.
2
As a further caveat to the use of grating observations in the study of the halo, note that the estimated
number of source counts for ObsID 6908/9 does not obviously scale with the exposure time (see Table 1).
5. – 5 –
S observations only. In both cases the source was imaged on the back-illuminated S3 chip,
due to its enhanced soft response. The background was low and fairly stable, with average
rates of 0.0028 and 0.0039 counts s−1
arcmin−2
for ObsID 12713 and ObsID 1590; adopting
a time bin of 300 s, the fit of the background light curves with a constant gives a reduced
χ2
of 0.96 and 1.09, respectively. No time filtering of flaring background periods was then
required, delivering a total exposure of 182.05 ks. By checking the field of view for X-ray
counterparts of the optical point sources in the NOMAD catalogue (Zacharias et al. 2004),
and comparing the positions of all the bright point-like X-ray sources in the two observations,
we verified the accuracy of the absolute astrometry and the absence of any relative offset to
within ∼1 native pixel (0.5′′
). The shorter-exposure ObsID 1590 was then reprojected to the
coordinate frame of ObsID 12713, and the two images were merged.3
Since the shape and the spatial extent of the diffuse emission are not known in advance,
the regions for spectral extraction were optimized on the basis of the image inspection de-
scribed in the next Section. Background spectra and count rates have been obtained from
a circular region with radius of 1′
, centered at a distance of ∼3′
from the nuclear region of
NGC 6240, to the North-East, and devoid of both point sources and excess diffuse emission.
Source and background spectra and weighted response files were generated and combined
with the specextract tool.
The X-ray halo is rather soft, and lies above the background level only in the ∼0.5–1.5
keV energy range (which serves as reference throughout this work). It is therefore critical
to adopt a correct spectral binning method. In order to allow the use of χ2
minimization,
3
The choice of a specific script is not influential, hence we used reproject events plus dmmerge for the
event files, and reproject image later on for the exposure maps.
Table 1: Chandra ACIS-S Observation Log for NGC 6240.
ObsID∗
Date Expa
Grating Aeff
b
Bkgdc
Countsd
1590 2001-07-29 36.7 None 630 0.0039 1960
6909 2006-05-11 141.2 HETG 45 0.0014 430
6908 2006-05-16 157.0 HETG 45 0.0015 350
12713 2011-05-31 145.4 None 520 0.0028 5750
Note. ∗Grating observations were discarded for this work. aNet exposure in ks; bNominal effective
area at 1 keV in cm2; cBackground count rate at 0.5–1.5 keV in s−1 arcmin−2; dEstimated 0.5–1.5
keV source counts over the r = 20–80′′ region.
6. – 6 –
we have grouped the background-subtracted spectra to a significance threshold of 4σ for
each energy channel. At the same time, we have also employed the ungrouped spectra,
with the requirement of at least one count per bin to ensure a proper application of the
Poissonian C-statistic (Cash 1979) even if no background model is supplied.4
The results
of this dual approach are always self-consistent, and are presented interchangeably in the
following, depending on the specific discussion purposes. Indeed, while χ2
carries direct
information on the goodness of the fit, C-stat allows us to preserve a better energy resolution
at lower S/N. The spectral analysis was performed with the xspec v12.7 fitting package.5
Unless otherwise stated, all the uncertainties are given at the 90% confidence level, and
energies in the observer’s frame. Radial profiles have been analyzed and fitted within Sherpa,6
while images were visualized and manipulated through SAOImage DS9.7
3. Image Analysis
3.1. Halo Morphology
Besides the ordinary image reprocessing, further corrections are necessary in the study
of extended X-ray sources to convert counts into physical units, properly taking into account
the dependence of the collecting area on energy and position, as well as the effective exposure
in the different regions of the detector. With this aim, we have first built an instrument map
using the ciao tool mkinstmap, and then generated an exposure map (see Davis 2001) for
each observation with mkexpmap. The input spectral weights were calculated by extracting
a preliminary halo spectrum from the r = 20–80′′
annulus centered on the brightest, nuclear
hard X-ray source, and modeling it with a phenomenological two-component thermal model.
The individual maps were then reprojected and combined to match the merged image.
In order to assess the maximum halo extent along the various directions, we initially
focused our attention on the 0.7–1.1 keV band, which represents the optimal compromise
between the requirements of both high S/N and total net counts. At the standard soft
X-ray energies of 0.3–2 keV, in fact, the source counts amount to ∼10000, but this is only
4
Since the background cannot be described by a simple shape (e.g., a power law), we did not conform to
the ideal procedure with Poissonian statistics of modeling the total and background spectra simultaneously.
However, it is still possible to obtain correct results within xspec, provided that no empty bin is involved.
5
http://heasarc.gsfc.nasa.gov/xanadu/xspec/.
6
http://cxc.harvard.edu/sherpa4.4/.
7
http://hea-www.harvard.edu/RD/ds9/.
7. – 7 –
5E-08 1E-07 2E-07
10 kpc ~ 20"
Fig. 1.— Exposure-corrected, adaptively-smoothed halo image over the 0.7–1.1 keV energy
range (North is up and East to the left). All the surrounding point sources have been
removed. The orange and green solid curves represent the connected 2σ and 3σ detection
contours above the average background level, which has been subtracted for clarity. For
comparison, the white dashed curve is the 3σ confidence contour obtained from the 0.3–2
keV image, which is less sensitive to low surface brightness due to its higher background.
8. – 8 –
06.0 04.0 02.0 16:53:00.0 58.0 56.0 54.0 52:52.0
26:00.030.025:00.030.02:24:00.030.023:00.030.0
10 kpc ~ 20"
Fig. 2.— Contours of the smoothed 0.7–1.1 keV emission, starting at the 3σ level above
the background and increasing in logarithmic scale up to roughly one sixth of the maximum
nuclear surface brightness, in order to emphasize the main structures in the halo. The four
arrows trace the wide bicone generated by the prominent cross-like feature in the central
r ∼ 1′
, whose axis (dashed line) is virtually normal to the optical galactic disk.
9. – 9 –
59% of the whole number of events collected over that range. By restricting to 0.7–1.1 keV,
instead, the same fraction rises to 77% while retaining ∼6000 net counts. This improves the
sensitivity at low surface brightness (see Fig. 1).
In ObsID 12713, the nuclear region of NGC 6240 lies ∼2′
from the western edge of
the S3 chip. Even after applying the exposure correction, this puts a rough empirical limit
on the area that can be effectively explored for the presence of diffuse emission (at least
in the East–West direction), as the large exposure disparity (≈ 182/37) would affect the
significance of any detection. This notwithstanding, we have adaptively smoothed the 0.7–
1.1 keV image to emphasize the faint extended features while preserving the local details with
the highest S/N, using csmooth (Ebeling et al. 2006). This tool convolves the raw image
with increasing Gaussian kernels; we set a nominal significance between 2.5σ and 5σ over
the local background under each kernel, and imposed a maximum kernel size of 10 pixels to
prevent any oversmoothing. The same smoothing scales were applied to the exposure map,
which was eventually used to normalize the source image.
The final, exposure-corrected image is shown in Fig. 1, where also the detection contours
at the 2σ and 3σ confidence level above the average background have been computed. The
latter curve is taken to represent the outer boundary hereafter, although its mean radius
of ∼80′′
can still be regarded as conservative measure with some respect (e.g., the overly
fine spatial resolution; see below). According to this estimate, the X-ray halo of NGC 6240
appears to have a somewhat distorted, elongated, diamond-like shape. The directions of
minimum and maximum extension intersect to the South-East of the nucleus and are almost
exactly perpendicular, corresponding to position angles of ∼16◦
and 107◦
, respectively. The
physical size at full length is then ∼110×80 kpc (225′′
×162′′
). In Fig. 2 we draw the loga-
rithmic contours starting at the fiducial detection limit, with a surface brightness cutoff that
brings out the structures within the halo. As already pointed out by Bush et al. (2008), the
most conspicuous feature is the stretched, cross-like pattern characterizing the central r ∼ 1′
region, whose arms generate a bicone with an aperture angle of ∼130◦
. This is even more
evident below in Fig. 4, where the emission clumpiness is visibly enhanced. Notably, the axis
of symmetry of this bicone is virtually normal to the plane of the optical disk, and its apex
is coincident with the hard X-ray source. This is all commensurate with a galactic outflow
arising from the nuclear starburst similar to that observed in M82 (Griffiths et al. 2000), and
possibly sweeping across a pre-existing halo medium. The physical scales involved, however,
are rather challenging (see Section 5).
10. – 10 –
3.2. Surface Brightness Profile
Compared to the oblong structure above, at larger distance (r > 1′
∼ 30 kpc) and
out to the detection boundary the hot gas distribution tends to recover a rounder shape.
In spite of the overall slight asymmetry, a radial analysis can provide valuable information
on the system. We have then computed the surface brightness profile of NGC 6240 up to a
galactocentric distance of 128′′
, sampling this region with successive, 4′′
-wide annuli. The sur-
rounding field is quite crowded, hence we employed the wavelet-based algorithm wavdetect
(Freeman et al. 2002) to isolate any contaminating point-like sources, three of which lie
just within the outer border. As their non-negligible contribution to the respective annuli
might alter substantially the slope of the faint emission tail and the detection significance,
we excluded a circle of 4-pixel radius around each of these sources.
The resulting background-subtracted surface brightness profile was fitted with a two-
component β-model, which is a convenient analytical expression widely-used in the study of
galaxies and clusters, defined as:
Σ(r) = Σ0 1 +
r
rs
2 −3β+0.5
,
where Σ0 is the central surface brightness, rs the scale radius of the gas distribution and β
the power-law index. With β = 0.5, for instance, Σ ∝ r−2
at r ≫ rs. Based on the shorter
ObsID 1590 only, Huo et al. (2004) already suggested that a double β-model better accounts
for the radial profile of NGC 6240 than the simpler form above. Besides the confirmation
of these earlier findings, we are now able to show that the core and halo components can
be completely disentangled (Table 2; Fig. 3). In particular, the extended, slowly declining
component equals its compact, steeply falling counterpart ∼7 kpc away from the center, and
becomes dominant straight beyond. We have consequently assumed r = 15′′
as the inner
boundary of the halo in our later spectral analysis. This is consistent with a rough estimate
from visual inspection of the X-ray morphology.
According to the radial surface brightness profile, diffuse emission associated with
NGC 6240 is detected at the 3σ confidence level out to a galactocentric distance of ∼100′′
(50
kpc). Since counts are now integrated over a given annulus, this measure naturally overrides
the single pixel-based 3σ contour formerly supplied, and is our best approximation to the
actual average extension of the halo.
11. – 11 –
Fig. 3.— Radial profile of the exposure-corrected surface brightness of NGC 6240 in the 0.7–
1.1 keV band. After the background subtraction, the profile is well described (χ2
ν ∼ 1.3) by
a double β-model (red solid curve), with a clear separation in the diffuse soft X-ray emission
between the compact (core) and the extended (halo) component. Both are shown for clarity,
respectively as the blue and the green dashed curve, while error bars are much smaller than
the symbols and have been omitted. The background level (black thin line) is 0.07 counts
arcsec−2
.
12. – 12 –
3.3. Small-Scale Structures
The clumpiness of the morphological appearance suggested by Fig. 1, as opposed to
a possible flatness, can be itself indicative of the nature of the halo. In order to assess
the degree of complexity, we have performed the adaptive smoothing with the alternative
ciao tool dmimgadapt, which is also available within DS9.8
Differently from csmooth, in
this case the underlying algorithm returns a superior resolution of the bright small-scale
structures. Indeed, within csmooth the kernel significance is computed with respect to the
local background. This magnifies the faint, diffuse component close to the halo border, yet
inner structures may be not significant enough with respect to the neighboring area. Such
features are then smoothed at the widest scale allowed, and any clumpiness is lost. On the
contrary, dmimgadapt is based on the raw number of counts. We then switched to the 0.5–1.5
keV image, due to its ∼13000 total counts, 71% of which are associated with the source. We
adopted the same maximum size as before (10 pixels), and required at least 16 counts under
each kernel. Given the background expected, this corresponds to a minimum significance of
1σ, growing up to 3.5σ for the finest (i.e., < 4′′
-wide) structures. The results are illustrated
in Fig. 4, where knots and filaments are clearly visible throughout the physical scales across
the halo.
We further addressed this issue from a quantitative point of view by selecting a sam-
ple direction across the halo, off the nuclear region but intersecting several apparent, local
intensity peaks. We extracted the number of counts along a 200′′
×4′′
stripe, divided in 50
square cells. Fig. 5 shows the tight correlation between the raw and the smoothed image; the
actual difference of count density substantiates the statistical significance of the small-scale
structures. In conclusion, these features are not consistent with a fully relaxed environ-
ment in nearly thermal and hydrostatic equilibrium, but rather they are reminiscent of the
8
http://cxc.harvard.edu/ciao/ahelp/dax.html.
Table 2: Best-fit Parameters of the Radial Surface Brightness Profile.
Par Core∗
Halo∗
Σ0 59.2±1.3 1.5±0.1
rs 10.0±1.5 23.8±2.5
β 3.3±0.8 1.0±0.1
Note. ∗Component of the double β-model (errors are reported at 1σ). Σ0: central surface
brightness in counts arcsec−2; rs: scale radius in kpc; β: power-law index.
13. – 13 –
loops, bubbles and cavities seen in the central r < 7 kpc region of NGC 6240, where the
shock-heated gas is subject to violent starburst-driven winds and, possibly, to massive AGN
feedback (Lira et al. 2002; Komossa et al. 2003; Feruglio et al. 2012). A spatially-resolved
spectral analysis can then provide crucial information to constrain the properties of the hot
gas in the halo, and to shed light on the origin and evolution of the whole system.
3.4. Line-Strength Map
The preliminary spectrum extracted during the calculation of the exposure map hinted
at soft X-ray line emission within the halo. Using the XMM-Newton spectrum (70′′
extraction
radius) presented by Boller et al. (2003) as a reference, we were able to identify the Fe-L
complex, possibly blended with O vii–viii and Ne ix–x (0.55–1.12 keV), and also Mg xi–
xii (1.24–1.5 keV) and Si xiii–xiv lines (1.7–1.93 keV). Following Baldi et al. (2006a) and
Wang et al. (2009), we generated three narrow-band images to encompass the features listed
above, in order to obtain a visual map of line strengths and metal abundances in the hot,
diffuse interstellar medium. For the continuum subtraction, another image was extracted
from the joint 0.4–0.55, 1.12–1.24 and 1.5–1.7 keV energy range. All the line and continuum
bands were selected to achieve an optimal compromise between line strength and continuum
contamination. No culling was applied for the few point sources. The O–Fe–Ne image
was adaptively smoothed (with csmooth) as described earlier. Due to its highest S/N and
largest number of line counts (∼4000), the same smoothing scales were adopted for the other
images. The background level appropriate to each energy range was then subtracted, while
the continuum contribution to each line image was determined by fitting the halo spectrum
with an absorbed bremsstrahlung model, after excluding the strong emission features. The
resulting scaling factors (∼2.2, 0.4 and 0.1 for the O–Fe–Ne, Mg and Si bands, respectively)
were assumed as relative weights in the final continuum subtraction.
The accuracy of this procedure is corroborated by the little spectral variations across
the halo (see below), which allowed us to employ the average continuum. Indeed, this is not
the case for the core region, where the source emission is much more complex and position-
dependent. As a result, most of the structures found in the line-strength maps within the
central 15′′
have no physical meaning. For this reason, in Fig. 6 we only show the lowest
significance contours of the soft X-ray emission lines under examination. The comparison
with the archival Hubble Space Telescope ACS/WFC F814W image reveals that metals are
spread out far beyond the optical limits of the galaxy. Not surprisingly, given the energy
band and the line intensity, the O–Fe–Ne morphology turns out to be very similar to that
illustrated in Fig. 2. Once the intrinsic difference in S/N is taken into account, also the
14. – 14 –
5 10 15 20 25
10 kpc ~ 20"
Fig. 4.— Filamentary and clumpy nature of the extended soft X-ray emission in NGC 6240.
The halo image in the 0.5–1.5 keV band has been adaptively smoothed with an algorithm
that better preserves the spatial resolution of local structures when compared to Fig. 1 (see
the text for details). The larger circle in the upper right-hand corner corresponds to the
maximum smoothing scale adopted, while the smaller one has a radius of 2′′
: structures of
this size are significant up to the 3.5σ level. The pair of arrows marks the position of the
200′′
×4′′
stripe whose close inspection is presented in Fig. 5.
15. – 15 –
Fig. 5.— Number of counts within the sequence of 50 square cells along the sample direction
across the halo defined by the pair of arrows in Fig. 4. The statistical significance of the
small-scale structures revealed through the adaptive smoothing is definitely confirmed. The
dashed red line represents the background expected over the cell size, while the vertical blue
lines indicate the visual borders of the halo. The raw and smoothed images of the entire
200′′
×4′′
stripe are reproduced for reference in the upper band.
16. – 16 –
spatial distribution of Mg and Si line emission displays a close overlap. In particular, the
prominent cross-like shape is clearly recovered in the 3σ Mg contours. This suggests that the
halo of NGC 6240 has already experienced a significant, nearly uniform metal enrichment
out to very large distances.
17. – 17 –
0 1 3 12 50 200
10 kpc ~ 20"
c)
10 kpc ~ 20"
a)
10 kpc ~ 20"
b)
Fig. 6.— Contours of the soft X-ray emission lines superimposed on the Hubble Space
Telescope ACS/WFC F814W image of NGC 6240 (Cycle 14, Program 10592; PI: A. Evans.
Retrieved from the NASA Multimission Archive at the Space Telescope Science Institute).
From left to right: a) 3σ, 5σ, 10σ and 20σ of the O–Fe–Ne blend at 0.55–1.12 keV; b) 3σ,
5σ and 10σ of Mg xi–xii at 1.24–1.5 keV; c) 3σ and 5σ of Si xiii–xiv at 1.7–1.93 keV.
18. – 18 –
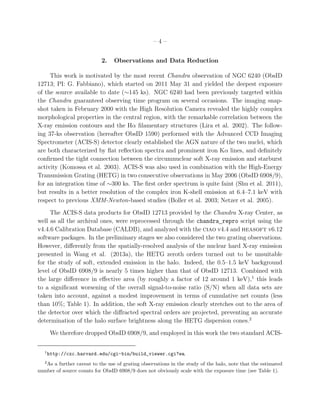
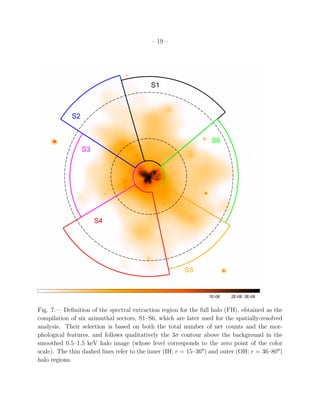
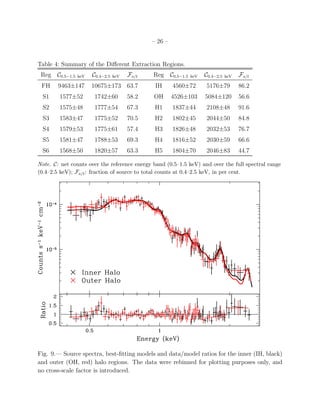
4. Spectral Analysis
4.1. Full Halo
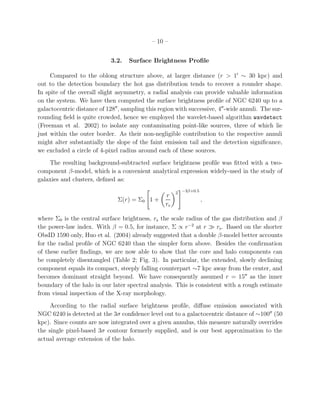
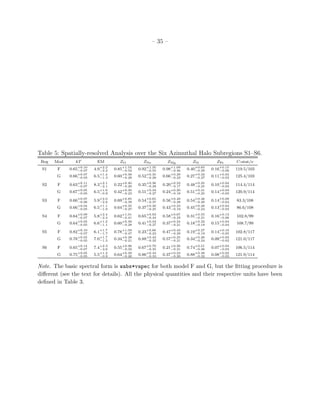
The radial surface brightness profile of Fig. 3 indicates a sharp separation at r = 15′′
≃
7.5 kpc between the core and the halo components. Starting at this inner boundary, we
followed the 3σ contours of the 0.5–1.5 keV image to define the width of the extraction region
for the spectral analysis. Due to the slight asymmetry, the outer border is not fixed, but
varies from 75′′
to 100′′
over six azimuthal sectors (labeled S1–S6; see Fig. 7). Qualitatively
then, the full halo (FH) region has the shape of an irregular windmill, and contains ∼11300
net counts over the entire 0.3–8 keV energy range. With no loss of statistical information,
we restricted to 0.4–2.5 keV (∼10700 net counts) for the spectral fitting.
Ten point-like, soft X-ray sources were identified within the halo extraction boundaries
by running wavdetect over the selected band. Each of them yields a few tens of counts
at most, for an aggregate contribution to the extended emission of less than 3%. Given
their minor weight, these point sources were not excluded. Their cumulative spectrum is
well reproduced by an absorbed (NH ∼ 1021
cm−2
) power law with photon index set to
1.8, whose intrinsic 0.3–8 keV luminosity is < 3×1040
erg s−1
at the distance of NGC 6240.
Owing to their location, six are allegedly background AGN (but no optical counterpart is
known), while the remaining four, if local to the galaxy, would be definitely ultraluminous
X-ray sources (ULXs; e.g., Zezas & Fabbiano 2002). The observed spectral shape is also
consistent with the unresolved populations of X-ray active objects, including high- and low-
mass X-ray binaries, active binaries, cataclysmic variables (e.g., Fabbiano 2006; Boroson et
al. 2011). These sources are associated with the stellar population, hence their contribution
to the halo is expected to be negligible. We accounted for any residual emission from the
latter classes (as well as for the resolved point sources) by keeping the Γ = 1.8 power-law
component in our model.
The bulk of the soft X-ray emission in the halo is presumed to arise from diffuse hot gas,
and was then modeled as a thermal spectrum through the vapec code (Smith et al. 2001),
which makes use of the AtomDB v2.0.1 atomic database.9
The gas emission measure (EM)
can be expressed as a function of the vapec normalization Nv through the relation EM =
nenHdV = 4π[DA(1+z)]2
×1014
Nv, where ne and nH are the electron and hydrogen densi-
ties, and DA is the angular diameter distance to NGC 6240 (102 Mpc). We first considered a
single-temperature plasma component, allowing for local (i.e., at the redshift of the source)
9
http://atomdb.org. An update to v2.0.2 has been recently released (Foster et al. 2012), but our results
are not modified (best-fit abundances are only affected at the third digit).
19. – 19 –
1E-08 2E-08 3E-08
S5
S4
S6
S3
S2
S1
Fig. 7.— Definition of the spectral extraction region for the full halo (FH), obtained as the
compilation of six azimuthal sectors, S1–S6, which are later used for the spatially-resolved
analysis. Their selection is based on both the total number of net counts and the mor-
phological features, and follows qualitatively the 3σ contour above the background in the
smoothed 0.5–1.5 keV halo image (whose level corresponds to the zero point of the color
scale). The thin dashed lines refer to the inner (IH; r = 15–36′′
) and outer (OH; r = 36–80′′
)
halo regions.
20. – 20 –
absorption in addition to the Galactic column density (NH = 4.87×10²⁰
cm−2
; Kalberla et al.
2005). The model form is then expressed within xspec as wabs*zwabs*(vapec+powerlaw).
As mentioned, the halo region provides ∼10700 counts, almost 90% of which are detected
at 0.5–1.5 keV, with an improvement by a factor of ∼4 with respect to ObsID 1590 alone.
This enabled us to assess for the first time individual abundances for iron and each of the
main α-elements (O, Ne, Mg, Si). For all the other elements we have adopted solar abun-
dances (from Anders & Grevesse 1989). Even if this standard practice might lead to some
inaccuracies, it is not really critical here, as the overall contribution of the frozen elements
to the best fit is marginal (< 20%). The only possible exception is represented by nickel
L-shell emission (∼6%; see later). We refer to Kim 2012 for a review of all the systematic
uncertainties affecting the measure of elemental abundances through X-ray spectral fitting
to CCD data.
The spectrum of the halo region is plotted in Fig. 8, while the best-fitting parameters
are listed in Table 3. Model A applies to the rebinned spectrum, for which the χ2
statistic
is assumed, while model B is relative to the ungrouped data, treated with C-stat (see the
Appendix for an overview). The results are in full agreement. Interestingly, the amplitude
of the power-law continuum and the column density of the local absorber have a null best-fit
value, implying that both components are not required, and that the diffuse, soft X-ray
emission can thus be accounted for within a simple thermal scenario (χ2
ν ∼ 1.14). The
upper limit to the 0.3–8 keV power-law luminosity is 4.1×1040
erg s−1
, encompassing the
contribution estimated above for the point sources. On the other hand, NGC 6240 is known
to host a huge amount of cold gas, but this is concentrated in the nuclear regions (Baan et al.
2007). In model C we fitted the six halo subregions S1–S6 simultaneously with a wabs*vapec
model, where the thermal emission is modified by Galactic absorption only. Individual
temperatures and metal abundances are tied, and are found to be in good agreement with
the fiducial values.
The main result is a general metal underabundance (by a factor of ∼2 for α-elements)
with respect to solar (Table 3). Absolute abundances should be taken with some caution,
since they strongly depend on the determination of the continuum, which, in turn, is affected
by unknown factors such as absorption, non-thermal components and multi-temperature gas
emission (e.g., Kim 2012). We then tried introducing a second thermal component to probe
the possible presence in the halo of multi-temperature gas. Due to the heavy degeneracy
between the column density and the temperature of the additional gas phase, which favors a
statistically equivalent (but physically unacceptable) solution,10
we have dropped both local
10
A column of NH ∼ 3 × 10²¹
cm−2
over the full halo extent would imply a mass of cold gas of ∼1011
M⊙.
21. – 21 –
Fig. 8.— Chandra ACIS-S spectrum of the soft X-ray halo of NGC 6240 (FH region),
rebinned to a 4σ significance for each energy channel and fitted with the χ2
statistic. Top
panel: best fit and residuals (in units of σ) for the single-temperature hot gas emission (model
A). Bottom panel: same as above, but allowing for a two-temperature plasma (model D).
Both thermal components are shown, with kT1 ∼ 0.9 keV and kT2 ∼ 0.4 keV.
22. – 22 –
Table 3: Best-fitting Thermal Models of the Full Halo Region.
Mod∗
A B C D E
NH(z) < 1.8 < 1.6 ... ... ...
fpl < 0.06 < 0.05 ... ... ...
kT1 0.65+0.06
−0.03 0.66+0.06
−0.04 0.66+0.06
−0.03 0.89+0.07
−0.23 0.77+0.09
−0.07
kT2 ... ... ... 0.42+0.11
−0.08 0.26+0.06
−0.08
EM1 40.5+8.0
−6.6 38.7+7.3
−7.0 39.5+5.6
−5.3 20.1+15.5
−4.9 28.1+7.8
−7.1
EM2 ... ... ... 17.5+6.2
−5.3 38.9+14.4
−18.2
Lth 3.76+0.44
−0.98 3.73+0.42
−0.84 3.74+0.15
−0.16 3.81+0.40
−0.98 3.84+0.63
−1.12
ZO 0.50+0.33
−0.21 0.54+0.39
−0.20 0.53+0.22
−0.17 0.44+0.29
−0.17 0.22+0.53
−0.22
ZNe 0.57+0.29
−0.21 0.62+0.31
−0.20 0.58+0.21
−0.17 0.39+0.27
−0.26 0.83+0.63
−0.43
ZMg 0.43+0.18
−0.15 0.46+0.20
−0.14 0.43+0.14
−0.11 0.68+0.38
−0.28 0.76+0.46
−0.29
ZSi 0.46+0.21
−0.18 0.47+0.21
−0.18 0.44+0.15
−0.13 0.59+0.31
−0.24 0.57+0.34
−0.23
ZFe 0.11+0.03
−0.02 0.12+0.03
−0.02 0.11+0.03
−0.01 0.18+0.08
−0.06 0.15+0.08
−0.04
χ2
/ν 74.2/65 ... ... 66.1/65 63.4/65
C-stat/ν ... 118/124 684/685 ... ...
Note. ∗See the text and the Appendix for both the definition of the models and their different
assumptions. NH(z): local column density in 1020 cm−2; fpl : relative contribution of the
power-law component to the observed 0.4–2.5 keV emission; kT: plasma temperature in keV; EM:
emission measure in 1063 cm−3; Lth: intrinsic 0.4–2.5 keV thermal luminosity in 1041 erg s−1; ZX:
elemental abundances in solar units.
23. – 23 –
absorption and power-law continuum, adopting a wabs*(vapec+vapec) form (model D).
The goodness of fit is significantly increased (χ2
ν ∼ 1.02), and calls for a mixed plasma with
kT1 ∼ 0.9 keV and kT2 ∼ 0.4 keV, while the two emission measures are comparable. The
results are illustrated in Fig. 8, and summarized in Table 3. Notably, there is no substantial
change in the abundances of iron and of the main α-elements, which were still allowed to be
different fractions of solar, but were tied between the two gas components since they cannot
be constrained separately. In model E, instead, abundance was fixed to 0.1 solar for all the
elements in the low-temperature component. Both kT1 and kT2 decrease by ∼0.15 keV, yet
the fit is further improved (∆χ2
≃ −2.7 with the same degrees of freedom), supporting the
presence of complex physical conditions in the halo of NGC 6240. This notwithstanding, the
single-temperature model clearly represents a sound approximation to the data, and provides
useful parameters for the purpose of this work.
As a further test, we considered the possibility that collisional ionization equilibrium (the
underlying assumption of the vapec code) is not met by the shock-heated gas in the halo.
NGC 6240 is undergoing a violent, merger-induced starburst phase, which is responsible
for most of the system’s ∼1012
L⊙ IR luminosity (Lutz et al. 2003; Nardini et al. 2009).
The last major burst of star formation is estimated to have occurred ∼20 Myr ago (Tecza
et al. 2000). Whether a pre-existing halo medium is swept up and shock-heated by a
starburst-driven wind, or shocks are taking place inside the wind material itself, a low-
density (ne ∼ 10−3
cm−3
) gas may have not recovered ionization equilibrium conditions yet.
The typical, density-weighted time-scale for plasma to reach equilibrium is τeq = net > 1012
cm−3
s (Masai 1994; Smith & Hughes 2010). We then switched from vapec to the non-
equilibrium model vnei (Borkowski et al. 2001), fixing the ionization time-scale parameter
at τeq = 1011
cm−3
s. This returned a much poorer spectral description (χ2
ν ∼ 2), hence we
did not pursue this interpretation any further. Incidentally, by taking τeq = 3 × 10¹²
cm−3
s we obtained χ2
ν ∼ 1.3, proving that vnei, if unconstrained, tends to converge towards an
equilibrium solution.
Finally, we investigated the nickel L-shell issue in more detail, by repeating the spectral
fits (model A) with different values of nickel abundance. This was in turn fixed to half-solar,
solar and twice-solar, tied to iron and left free. This check delivers a nearly evenly-spaced
grid of ZNi values, from which we can draw some qualitative considerations in spite of the
large uncertainties involved. Although the corresponding best fit is still broadly acceptable
(null hypothesis probability of ∼11%), the assumption of ZNi ≡ ZFe ≃ 0.15 results in a
significant worsening on statistical grounds (∆χ2
≃ 5.1). Indeed, nearly solar values of ZNi
are definitely preferred. Equivalent results were found with C-stat on the ungrouped spectra.
Once an obvious nickel underabundance is ruled out, most elements are virtually unaffected
by the exact entry for ZNi, due to the substantial difference from nickel in either total
24. – 24 –
contribution (Fe) or energy (O, Mg, Si). Conversely, neon abundance varies systematically
with ZNi, decreasing by a factor of ∼3 as nickel changes from half to twice solar, as the two
elements are very similar in both flux and energy. Thawing ZNi has a negligible effect on
the goodness of fit (∆χ2
≃ −0.6). An F-test gives a probability of chance improvement of
48%. The best-fit value is ZNi ∼ 1.4, but poorly constrained in the 0.5–2.5 range. We have
therefore kept nickel abundance frozen to solar for all the subsequent analysis.
4.2. Radial Analysis
Given the fairly large amount of total net counts available, the next step is to embark
upon a spatially-resolved analysis aimed at revealing any temperature and/or metallicity
gradient within different zones of the halo. We first searched for some trend in the radial
direction, and selected two annular regions corresponding to the inner (IH; r = 15–36′′
) and
outer (OH; r = 36–80′′
) halo (see Fig. 7). The IH/OH transition radius was adaptively
chosen to ensure an equal number of source counts (∼4500) in the 0.5–1.5 keV energy band.
Due to the different areas (by a factor of ∼5), however, the S/N in the two subregions is
quite different (see Table 4). In the following, we systematically refer to the analysis of
the ungrouped spectra, which preserve the intrinsic ACIS-S energy resolution. This entails
sounder measures and more reliable comparisons among elemental abundances, as Mg and
Si lines fall in a rather noisy spectral range. Even the O–Fe–Ne blend can be affected by a
conservative rebinning like the one adopted to employ the χ2
minimization.
We have then used model B for the IH and OH fits. A marginal power-law component is
possibly present in the IH region, consistent with the luminosity of the point sources that fall
in that field. The upper limit to the total power-law contribution is in good agreement with
the previous estimates in Table 3. The two IH and OH plasma temperatures are identical to
the fiducial FH value, and again no local absorber is required. Ultimately, the two spectra
are remarkably alike (Fig. 9). The most significant comparison concerns abundances, as
illustrated in Fig. 10. In spite of the overlapping error bars, for each element the best-fitting
OH values are systematically lower than the IH ones, suggesting a slight metallicity drop at
larger distances. By disentangling the core and halo spectra, a similar result had been already
found by Huo et al. (2004), who used a simplified model to fit the ObsID 1590 data (see also
Grimes et al. 2005). Although negligible when considering the single element, the overall
effect is significant at the 2σ level. As already mentioned, however, absolute abundances can
be somewhat misleading. Relative abundances (i.e., abundance ratios between two elements)
are usually more reliable, as the prominence of the different lines is altered in a similar way
by any incorrect subtraction of the underlying emission. The decreasing trend is not seen in
25. – 25 –
the abundance ratios. This can be explained in either of the following ways: (1) the observed
metallicity drop is artificial, likely induced by an inaccurate determination of the continuum;
(2) the negative radial gradient has a physical origin, possibly related to the dilution of a
metal-enriched gas outflow. Both interpretations are consistent with the apparent behavior
of absolute and relative abundances.
Although the IH/OH analysis revealed no clear trend for either temperature or metal-
licity, we proceeded with a finer annular sampling of the halo. This is desirable in order to
obtain a radial profile of the gas density as a function of the emission measures (see later).
Following the same adaptive criterion, we selected five regions within r = 15–80′′
(H1–H5,
with intermediate radii of 21.8, 30.8, 41.8, and 55.5′′
), containing ∼1800 net counts each
at 0.5–1.5 keV (Table 4). Model C was applied in the spectral analysis, with temperatures
free and abundances tied to their average values. We also made use of the deprojection
technique available through the xspec model component projct. Indeed, since we can only
probe the footprint of the emitting source on the plane of the sky, a system with a rough
spherical symmetry is subject to some degree of radial mixing: the emission observed in a
given annulus also includes a contribution from material located at larger distances. In this
case, however, deprojection does not result in any significant difference, confirming the sug-
gested lack of strong radial gradients. Only emission measures experience some variations,
but the correction involved for the gas density is still limited (< 30%), and therefore has
been disregarded.
4.3. Azimuthal Analysis
As discussed above, radial variations, if any, are limited. A possible, partial explanation
is that the integration over the polar angle smooths out most of the existing differences. From
Figs. 1 and 4, in fact, one can easily appreciate that the surface brightness profile depends
on the direction along which it is evaluated. Several structures, outstanding for intensity
and/or extent, are confined in narrow azimuthal sectors, so that the relative information
might be lost in a purely radial analysis. The aforementioned azimuthal regions S1–S6
(Fig. 7) were adaptively selected following the morphological appearance, and imposing that
each key feature is sharply singled out, most notably the wings of the cross-like pattern.
Each sector includes ∼1800 net counts at 0.4–2.5 keV, which represent ∼60–70% of the total
collected events (see Table 4). We then made use of two new models, F and G, both based
on the simple wabs*vapec form. This choice is fully justified by our preliminary analysis,
demonstrating that any additional spectral component is redundant, apart from a thermal
26. – 26 –
Table 4: Summary of the Different Extraction Regions.
Reg C0.5−1.5 keV C0.4−2.5 keV Fs/t Reg C0.5−1.5 keV C0.4−2.5 keV Fs/t
FH 9463±147 10675±173 63.7 IH 4560±72 5176±79 86.2
S1 1577±52 1742±60 58.2 OH 4526±103 5084±120 56.6
S2 1575±48 1777±54 67.3 H1 1837±44 2108±48 91.6
S3 1583±47 1775±52 70.5 H2 1802±45 2044±50 84.8
S4 1579±53 1775±61 57.4 H3 1826±48 2032±53 76.7
S5 1581±47 1788±53 69.3 H4 1816±52 2030±59 66.6
S6 1568±50 1820±57 63.3 H5 1804±70 2046±83 44.7
Note. C: net counts over the reference energy band (0.5–1.5 keV) and over the full spectral range
(0.4–2.5 keV); Fs/t: fraction of source to total counts at 0.4–2.5 keV, in per cent.
Fig. 9.— Source spectra, best-fitting models and data/model ratios for the inner (IH, black)
and outer (OH, red) halo regions. The data were rebinned for plotting purposes only, and
no cross-scale factor is introduced.
27. – 27 –
Fig. 10.— Top panel: absolute abundances (in solar units) of all the main elements, as
derived from the spectral analysis of the inner (red crosses) and outer (green dots) halo
regions. Although the values for individual elements are consistent with each other, the
two sets of measures hint at a possible decreasing trend of metallicity with distance. The
cumulative significance is anyway limited to 2σ. The average values over the full halo are
also plotted for comparison (blue squares). Bottom panel: relative abundances with respect
to iron, showing no evident radial dependence.
28. – 28 –
one (which, however, cannot be explored over the individual zones).11
At first, we took the most general approach of dealing with each subregion independently
(model F). The six spectra and their best fits are shown in Fig. 11. The results for the
individual gas temperatures and abundances are summarized in Table 5, and plotted in
Figs. 12 and 13. Evidence for a slightly hotter gas component is found in S5, and also
abundance measures provisionally hint at sizable gradients. The error bars are quite large,
though. With model G, we have therefore adopted an alternative strategy to reduce both
the systematic and the statistical uncertainties on absolute and relative abundances. The
basic idea is to take advantage of the fact that the extent of any variation across the halo
has proven to be rather limited. This allowed us to extract some additional information by
investigating the behavior of each of the key spectral parameters separately, with all the
other variables tied (but not frozen) to their average value.
We created in turn six spatial maps for kT, and O, Mg, Ne, Si, Fe abundances by
performing a simultaneous fit of the S1–S6 regions, with the single observable of interest free
to vary in the different spectra and the other parameters (apart from the normalization) tied
to a common value. According to this method, Table 5 should be read along rows for model
F only. The physical information from model G is conveyed by columns, which correspond
to a specific temperature or abundance map. Since no quantity is frozen, every fit delivers an
independent set of average values for the collateral parameters. Not surprisingly, these are
always coincident (typically within ∼5–10%) with the results of model C, where temperatures
and abundances are all tied over S1–S6, and from which the entries for emission measure
and C-stat (evaluated on the single region of interest) have been taken.
Model G effectively returns smaller error bars, as illustrated in Figs. 12 and 13. This
result is not actually achieved at the expense of accuracy. The measure of individual abun-
dances, in first approximation, relies on a specific, narrow energy range, whose continuum is
now constrained over the full halo. The fact that C-stat undergoes just tiny increments with
respect to model F, when assessed over the single regions, implies that the entire soft X-ray
spectrum is well reproduced, not only the band of interest for each abundance map. This
further confirms the reliability of our approach. The last sensitive issue to investigate is the
possible degeneracy between iron abundance and emission measure, which can partly weaken
the significance of any gradient. In spite of the low ZFe value, iron L-shell contribution is still
dominant, and it is difficult to disentangle from the continuum at CCD resolution. In Fig. 14
we show the ZFe–EM confidence contours for the two regions (S4 and S6) with the larger
11
The presence of localized absorption and non-thermal emission in the single regions has been ruled out
by adding back into the model, one at a time, the corresponding spectral component.
29. – 29 –
Fig. 11.— Source spectra, best-fitting models and data/model ratios for the six azimuthal
regions S1–S6. The background is also outlined (in light grey) for comparison. The same
graphical rebinning (to at least a 2.5σ significance per channel) has been applied to all the
spectra, while the model curves retain the intrinsic energy resolution. This elucidates the
necessity of dealing with ungrouped spectra, adopting C-stat in each halo subregion, in order
to constrain with higher accuracy the elemental abundances.
30. – 30 –
Fig. 12.— Comparison of the gas temperatures in the S1–S6 subregions obtained from models
F (black circles) and G (green diamonds). The best-fitting spectroscopic temperature (solid
line) and its confidence range (shaded area) from model C, averaged over the full halo, are
also shown for reference.
31. – 31 –
Fig. 13.— Best-fitting elemental abundances (top) and abundance ratios (bottom) in the
six azimuthal sectors of the halo. The color code is the same defined in Fig. 7. Results from
both model F (crosses) and model G (dots) are plotted (see Tables 5 and 7).
32. – 32 –
difference (2.8σ) in ZFe, proving that such effect is minimal. A gradient of iron abundance
in the halo is then detected with a ∼2σ significance. With little dependence on the specific
model (see Fig. 13), a similar result possibly holds for magnesium, while for all the other
α-elements error bars are still too large to draw any conclusion.
4.4. Physical Parameters
The key physical properties (density, mass, pressure, thermal energy) of the X-ray emit-
ting gas can be inferred from the results of the spectral analysis, provided that the volume
of the halo is estimated. We assumed that the thickness of the system is comparable to its
width. This is a reasonable approximation for a merger about to enter the final coalescence
stage like NGC 6240. Moreover, the main galactic body in the optical is reminiscent of a
distorted edge-on disk (Gerssen et al. 2004), implying a substantial span along the line of
sight. A nearly face-on configuration (like in the case of the Antennae, NGC 4038/4039;
Fabbiano et al. 2003) does not seem to apply here, and can be safely ruled out. Based on
this conjecture, we computed the volume V of the halo as follows:
V =
2θi
3
R3
i
2Si
θiR2
i
3/2
≃ 1.9 × S
3/2
i θ
−1/2
i ,
where Si is the surface derived for each of the six azimuthal regions S1–S6 from the 3σ
contour of Fig. 1, and Ri and θi are the outer radius (in kpc) and the central angle (in
radians) of the individual sectors. We eventually obtained that V ≃ 2.15 × 10⁵
kpc3
. In the
detailed calculations we have also taken into account the geometrical projection effects. This
is mainly relevant to the volumes of the annular regions H1–H5, which strongly depend on
the radius of the embedding sphere, taken to be 100′′
(±20′′
). Such correction is negligible
(roughly 1%) on V, also in the light of the large systematic uncertainties.
It is actually the effective volume occupied by the gas that matters for the estimate of
the physical properties. This is related to the geometrical volume through the expression
Veff = ηV, where η encompasses both the filling factor of the emitting gas and any correction
scale factor. Assuming ne ∼ nH, the emission measure can be written as EM ≃ n2
eηV,
from which we extracted the electron density, and hence the gas pressure p = 2nekT, mass
M = neηVmp and thermal energy Eth = 3neηVkT. The cooling time τc was estimated as
the ratio between the thermal energy content and the 0.3–8 keV thermal luminosity, inferred
from the spectral fits. Our results for the full halo and its different subregions are presented
in Table 6, and their main implications are discussed in the next Section.
All the physical quantities mentioned above contain the unknown filling factor η, which
cannot be directly constrained. Hydrodynamic simulations suggest that the low-density, hot
33. – 33 –
Fig. 14.— ZFe–EM contour plots for S4 and S6, the two regions in the halo with the larger
gradient of iron abundance. The different curves correspond to the nominal 68, 90 and 99%
confidence levels for model G.
34. – 34 –
gas component (ne ∼ 10−2
cm−2
, kT ∼ 107
K) in starburst-driven winds is volume-filling
(η ∼ 0.7), even if its contribution to the soft X-ray emission may not be dominant (e.g.,
Strickland & Stevens 2000). Since the dependence from η is mild (ne, p ∝ η−1/2
, while Mg,
Eth, τc ∝ η1/2
), the estimates given in Table 6 correspond to η = 1, keeping in mind that
the actual values can differ by a factor of two or more.
35. – 35 –
Table 5: Spatially-resolved Analysis over the Six Azimuthal Halo Subregions S1–S6.
Reg Mod kT EM ZO ZNe ZMg ZSi ZFe C-stat/ν
S1 F 0.65+0.10
−0.07 4.9+2.2
−2.2 0.85+1.54
−0.52 0.92+1.35
−0.55 0.98+1.09
−0.46 0.40+0.65
−0.39 0.16+0.15
−0.06 119.5/103
G 0.66+0.07
−0.05 6.5+1.4
−1.3 0.60+0.38
−0.28 0.52+0.35
−0.28 0.66+0.29
−0.23 0.27+0.32
−0.27 0.11+0.04
−0.03 125.4/103
S2 F 0.63+0.11
−0.07 8.3+2.1
−2.1 0.22+0.40
−0.20 0.35+0.36
−0.28 0.20+0.23
−0.17 0.48+0.35
−0.25 0.10+0.04
−0.03 114.4/114
G 0.67+0.05
−0.05 6.5+1.0
−0.9 0.42+0.30
−0.23 0.51+0.34
−0.27 0.24+0.20
−0.18 0.51+0.31
−0.25 0.14+0.04
−0.03 120.9/114
S3 F 0.66+0.07
−0.06 5.9+2.0
−2.0 0.69+0.85
−0.39 0.54+0.65
−0.37 0.56+0.49
−0.28 0.54+0.46
−0.30 0.14+0.09
−0.04 83.3/108
G 0.66+0.04
−0.05 6.5+1.1
−1.0 0.64+0.35
−0.27 0.37+0.30
−0.25 0.43+0.23
−0.19 0.45+0.28
−0.24 0.13+0.04
−0.03 86.6/108
S4 F 0.64+0.09
−0.07 5.8+2.4
−2.4 0.62+1.01
−0.41 0.65+0.93
−0.44 0.58+0.67
−0.33 0.31+0.55
−0.31 0.16+0.13
−0.06 102.8/99
G 0.64+0.05
−0.05 6.6+1.2
−1.1 0.60+0.39
−0.28 0.41+0.34
−0.27 0.37+0.24
−0.21 0.18+0.32
−0.18 0.15+0.04
−0.04 108.7/99
S5 F 0.82+0.10
−0.07 6.1+1.7
−1.7 0.78+1.03
−0.47 0.23+0.66
−0.23 0.47+0.43
−0.29 0.19+0.27
−0.19 0.14+0.10
−0.05 102.8/117
G 0.78+0.05
−0.05 7.0+1.7
−1.5 0.34+0.28
−0.21 0.88+0.42
−0.32 0.57+0.25
−0.21 0.34+0.26
−0.24 0.09+0.03
−0.02 121.0/117
S6 F 0.65+0.14
−0.07 7.4+2.3
−2.6 0.55+0.96
−0.32 0.67+0.70
−0.35 0.21+0.30
−0.21 0.74+0.51
−0.36 0.07+0.04
−0.03 106.5/114
G 0.75+0.05
−0.05 5.5+1.2
−0.9 0.64+0.39
−0.28 0.86+0.43
−0.33 0.37+0.23
−0.20 0.88+0.38
−0.32 0.08+0.02
−0.03 121.9/114
Note. The basic spectral form is wabs*vapec for both model F and G, but the fitting procedure is
different (see the text for details). All the physical quantities and their respective units have been
defined in Table 3.
36. – 36 –
Table 6: Global and Local Physical Properties of the Hot Gas.
Reg Mod V ne Mg p Eth τc
FH B 6.31 2.5+0.2
−0.3 13.1+1.2
−1.2 5.2+0.7
−0.6 49+7
−5 3.7+1.0
−0.6
H1 C 0.54 3.6+0.5
−0.4 1.7+0.2
−0.2 8.3+1.1
−1.1 6.7+0.9
−0.9 2.6+0.3
−0.4
H2 C 1.00 2.6+0.4
−0.3 2.2+0.3
−0.3 5.6+0.9
−0.7 8.5+1.3
−1.2 3.3+0.6
−0.4
H3 C 1.63 2.1+0.3
−0.3 2.8+0.4
−0.3 4.4+0.7
−0.7 10.7+1.6
−1.6 4.2+0.7
−0.6
H4 C 2.48 1.7+0.2
−0.3 3.5+0.5
−0.5 3.7+0.6
−0.6 13.7+2.2
−2.2 5.5+0.9
−1.0
H5 C 2.95 1.5+0.4
−0.3 3.8+0.7
−0.9 3.0+0.8
−0.7 13.2+2.9
−3.5 5.3+1.2
−1.4
S1 F 1.02 2.2+0.4
−0.6 1.9+0.4
−0.5 4.5+1.2
−1.2 7.0+1.8
−1.9 3.4+0.9
−1.0
S2 F 1.06 2.8+0.3
−0.4 2.5+0.3
−0.3 5.7+1.2
−1.0 9.0+1.9
−1.6 3.9+0.8
−0.7
S3 F 0.67 3.0+0.4
−0.6 1.7+0.2
−0.3 6.3+1.2
−1.3 6.3+1.2
−1.3 2.8+0.6
−0.5
S4 F 1.25 2.1+0.4
−0.5 2.3+0.4
−0.6 4.4+1.0
−1.1 8.2+2.0
−2.1 3.8+1.0
−1.0
S5 F 0.99 2.5+0.3
−0.4 2.1+0.3
−0.3 6.5+1.2
−1.1 9.7+1.8
−1.6 4.4+0.8
−0.8
S6 F 1.32 2.4+0.3
−0.5 2.6+0.4
−0.5 5.0+1.3
−1.1 9.9+2.5
−2.2 4.3+1.1
−1.0
Note. V: estimated volume in 1069 cm3; ne: electron density in 10−3 cm−3; Mg: total mass in
109M⊙; p: pressure in 10−12 dyne cm−2; Eth: thermal energy in 1057 erg; τc: cooling time in Gyr.
37. – 37 –
5. Discussion
The smoothed soft X-ray images of NGC 6240 reveal a spectacular halo of hot gas, with
an average radial extent of ∼50 kpc. Its total luminosity in excess of 4×1041
erg s−1
is com-
parable to that of small groups of galaxies (Mulchaey 2000) and giant ellipticals (Canizares
et al. 1987; Mathews & Brighenti 2003), while its age can be provisionally estimated through
the sound-crossing time. The adiabatic sound speed in a gas with kT ≃ 0.65 keV (7.5 mil-
lion K), and mean molecular weight µ ≃ 0.6 (as per a fully-ionized, primordial plasma),
is cs = (5kT/3µmp)1/2
≃ 420 km s−1
, resulting in a dynamical age of ∼200 Myr. In this
Section we consider thoroughly all the viable physical explanations for the observed halo lu-
minosity, size, temperature, morphology, and metallicity, in order to achieve a self-consistent
interpretation, and discuss the origin and possible evolution of the system.
5.1. Galaxy Merger
Close interactions and mergers represent the most critical stage of galaxy evolution over
cosmic time. Both models and observations indicate that, after the collision of a pair of
massive, gas-rich spirals, the kinematic and structural properties of the remnant are consis-
tent with elliptical galaxies (e.g., Barnes 1988; Dasyra et al. 2006). The relation between
mergers and hot gaseous halos, instead, is still rather controversial. The first encounter of
the progenitor disks may lead to substantial heating, through the dissipation of the kinetic
energy in the gas components and the formation of copious shocks in the contact layers. In
the present case, the former mechanism is largely insufficient. Assuming two identical pro-
genitors, the amount of kinetic energy deposited during the merger is roughly Mgv2
c /8, where
Mg is the mass of the X-ray emitting gas and vc is the relative speed during the collision.
The thermal energy content of the halo (Eth ≃ 5×1058
erg) corresponds to vc ∼ 1200 km
s−1
, which is nearly twice the velocity observed in the Taffy Galaxies (Braine et al. 2003), a
characteristic example of a head-on collision.12
On the other hand, the same halo luminosity is probably too large for the interaction
of two galaxies with properties similar to the Milky Way. The peak of the X-ray luminosity
in galaxy mergers is attained with the final coalescence, or shortly before (Brassington et
al. 2007). According to simulations, its value depends on several factors, among which
the size and the gas fraction of the progenitors, the orbital parameters, and the relative
12
Note that this estimate is independent of the filling factor and the actual values of Eth and Mg, since
both quantities vary as η1/2
.
38. – 38 –
orientation. The overall complexity is a possible reason for which extended X-ray emission
is not systematically found in mergers. In principle, also the presence of a supermassive
black hole has an important role in the gas heating and its subsequent dispersion (Cox
et al. 2006). In NGC 6240, the AGN pair is believed to contribute significantly to the
bolometric luminosity (Lutz et al. 2003; Egami et al. 2006), yet their direct feedback on
the circumnuclear environment is difficult to establish. Their impact has presumably been
negligible so far, as both nuclei are still completely enshrouded by a thick shell of dust and
gas (Iwasawa & Comastri 1998; Vignati et al. 1999). In this view, unless the aforementioned
physical parameters are unusually fine-tuned, a maximum LX > 1041
erg s−1
can be reached
only if the progenitors are much more massive than the Milky Way (see also below). This
makes of NGC 6240 an exceptional case study with respect to both the observations of
known systems and the numerical simulations of mergers. Accepting that NGC 6240 is now
at its peak X-ray luminosity, in fact, it should be kept in mind that the entire, diffuse X-ray
emission is ∼3 times that of the halo alone.
The tidal forces can be responsible for the presence of hot gas at large distance from the
center. The arms of the wide, cross-like morphological feature are openly suggestive of the
typical tidal tails observed in mergers, but they have no detected counterpart at different
wavelengths. Another problematic point resides in the gas temperature. When swept by an
adiabatic shock, the gas is heated to kTs = 3µmpv2
s /16, where vs is the speed of the shock
front (Hollenbach & McKee 1979). The velocity required to produce a temperature of 0.65
keV is vs ∼ 750 km s−1
, which is still too high when compared to the inferred orbital velocity
of the two nuclei of NGC 6240 (155 km s−1
; Tecza et al. 2000), even if the rotation of the
parent disks is taken into account. Finally, the inelastic nature of the galaxy merger does
not seem capable of accounting for the energetics of the X-ray halo. Yet, the ongoing nuclear
starburst is itself triggered by the global redistribution of the gas components that follows
the strong gravitational disturbances, and represents a much more efficient energy source.
5.2. Starburst Wind
During a starburst, the formation of young, massive stars persists until the depletion
of the molecular gas reservoir and/or the onset of some self-regulation mechanism. This
activity leads to intense mass loss, stellar winds and frequent supernova (SN) explosions.
The resultant deposition of energy, momentum and metals into the intergalactic medium is
a key driver of galaxy evolution. Based on the stellar K-band emission of NGC 6240, Tecza
et al. (2000) evinced that a short (∼5 Myr) burst of star formation took place ∼20 Myr ago,
possibly coincident with the latest perigalactic passage (but see Engel et al. 2010b). As the
39. – 39 –
mechanical energy injected by a starburst is roughly 1% of its bolometric luminosity (e.g.,
Leitherer et al. 1999), and the total luminosity of NGC 6240 is Lbol ≈ LIR ∼ 3×1045
erg
s−1
(Armus et al. 2006), it takes at least ∼50 Myr for the starburst to supply the estimated
thermal energy content of the X-ray halo, neglecting the AGN contribution to LIR. It is
therefore highly questionable whether the halo is a direct consequence of the most recent
starburst episode, also considering its huge size, which calls for an average outflow velocity
of ∼2500 km s−1
over the last 20 Myr. This would be actually consistent with the fastest
shocks we identified in the central 5 kpc (Wang et al. 2013a), so the key issue is whether an
outflow could sustain a similar expansion rate for several tens of kpc.
In the classical model of starburst-driven winds (Chevalier & Clegg 1985), the terminal
outward velocity is v∞ = (2 ˙E/ ˙M)1/2
, where ˙E and ˙M are the energy and mass injection rates,
respectively. By adopting a standard mechanical energy input of 1051
erg per SN (Chevalier
1977), and an average SN mass of ∼10 M⊙ with intrinsic mass deposition fraction of ∼10%,
we can write v∞ ∼ 104
(ξ/Λ)1/2
km s−1
, where the thermalization efficiency ξ accounts for
any radiative losses, and the mass-loading factor Λ is the ratio between the total mass of the
gas heated within the starburst and the mass of the direct SN ejecta (Veilleux et al. 2005).
The obvious effect of radiative losses and mass loading is to slow down the wind. In the
absence of observational constraints for ξ and Λ, the previous expressions can be rearranged
further into the fully equivalent v∞ = (5kTc/µmp)1/2
, which brings out the dependence on
the central gas temperature only (Strickland & Heckman 2009). By approximating Tc with
the nearly constant halo temperature, we obtain that v∞ ≃ 720 km s−1
, commensurate with
the average width of the optical line-emitting gas (Heckman et al. 1990), and with the
terminal velocity of the nuclear outflow determined from the blueshifted Na i λλ5890, 5896
doublet (Na D) absorption (Heckman et al. 2000).
Alternatively, we assume that ξ ≃ 1, and attempt to assess Λ for a constant mass injec-
tion rate since the putative epoch of the most recent starburst. The SN rate in NGC 6240,
as derived from the non-thermal radio continuum emission, is ∼2 yr−1
(van der Werf et
al. 1993; Beswick et al. 2001). This value strongly depends on the star formation history
adopted (continuous, instantaneous or merger-induced), and is possibly overestimated by up
to an order of magnitude (Engel et al. 2010b). At least, it represents a useful upper limit for
the present purpose.13
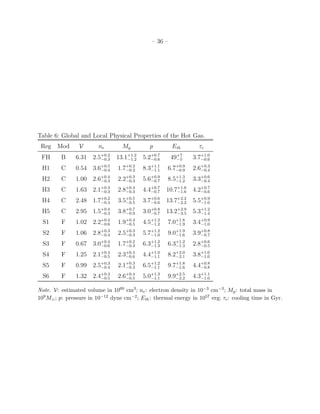
A total mass of hot gas in the halo of ∼1010
M⊙ (Table 6) indicates
that Λ ∼ 300. Taken at the face value, this would imply a mass loading efficiency (i.e.,
the mass outflow rate normalized to the star formation rate) larger than one, which is not
13
Interestingly, among the various estimates considered in Wang et al. (2013a), we obtained a SN rate of
∼3 yr−1
, using the correlation between [Fe ii] at 1.26 µm and SN rate found in nearby starburst galaxies
(Rosenberg et al. 2012).
40. – 40 –
unusual among ULIRGs (Rupke et al. 2005), and is comparable to that inferred for similar
IR-luminous, merging systems like Mrk 266 (Wang et al. 1997) and Arp 299 (Heckman et
al. 1999). In both of the latter cases, however, the dynamical age of the X-ray nebula is
broadly consistent with the typical starburst lifetime. In NGC 6240, such a substantial mass
loading would correspond to v∞ ≃ 700 km s−1
, in excellent agreement with our previous
estimate. In conclusion, any galactic wind originating some 20 Myr ago must have traveled
for ∼10–15 kpc at most. Remarkably, this is just beyond the size of the optical nebula and
of the soft X-ray core.
The two equivalent expressions for the terminal velocity used above are derived from
wind models that neglect both ambient gas and gravitational forces. The mass-loading is
centralized (i.e., it takes place within the starburst region itself), and is typically limited
to a few M⊙ per SN (Λ < 10; Suchkov et al. 1996). The archetypal source to which these
analytical models and hydrodynamical simulations are compared is M82, since it is isolated,
contains no AGN, and the hot gas is free to escape perpendicular to the galactic plane
(Griffiths et al. 2000). The huge mass loading required for mergers, instead, implies the
entrainment of tens to hundreds of M⊙ per SN in the ambient material swept by the wind.
In a ULIRG-like system, due to the high density and the disturbed geometry, it is plausible
that the conversion of mechanical energy into radiation is much less efficient than in M82-like
starbursts (e.g., Colina et al. 2004), and even that outflows expand only over little distances
before terminating. However, as the clumpy morphological structures in NGC 6240 reach
out to the largest physical scales, a wind nature for the entire halo cannot be conclusively
rejected. Enhanced star formation with respect to quiescent galaxies has been likely in place
since the beginning of the interaction, dated to several hundreds of Myr ago. Moreover, in
these earlier times the additional momentum injection due to the AGN radiation pressure
could have been non negligible, with a possible boost effect on the starburst outflows.
The secular wind scenario, in keeping with the dynamical age of ∼200 Myr, can be
probed through the average halo properties. In particular, the gas density in a freely ex-
panding wind should decrease as ∼ r−2
, as a consequence of the mass conservation law with
constant outflow velocity at large distances. If the gas is nearly isothermal, the observed
luminosity is related to the emission measure in a straightforward manner, hence the surface
brightness is expected to exhibit a power-law dependence on radius as well: qualitatively,
Σ ∝ n2
edV/dS ∼ r−3
. Incidentally, this behavior was first observed in M82 with Einstein
(Fabbiano 1988). We have then fitted the radial profile of Fig. 3 at distances r > 12 kpc,
to avoid any contamination from the core component. As already indicated by the large
scale radius in the β-model fit (Table 2), a power-law shape gives a very poor description
(χ2
/ν ∼ 171/24) of the average surface brightness. Indeed, over the range explored, Σ(r)
follows very well (χ2
/ν ≃ 16/24) an exponential decline with scale length l = 10.1(±0.2) kpc.
41. – 41 –
The temperature and density profiles are plotted in Fig. 15. Although only five measure-
ments are available from the spectral fits to regions H1–H5, and the relative uncertainties
are quite large, the halo gas density decreases with radius as ne ∝ r−α
with α ≃ 0.75(±0.15),
showing a milder trend with respect to a single adiabatic flow. The temperature is consistent
with being constant beyond ∼5 kpc. These features could be explained by the superposition
of successive winds emanating from different locations, suggesting a widespread rather than
centrally-concentrated starburst.
For completeness, we have extended the kT and ne profiles to smaller radii by extract-
ing the spectra from three annular regions in the core, which provides twice as many counts
as the halo over the 0.5–1.5 keV energy range. In this case, our single thermal model is
purely phenomenological, since a multi-temperature plasma is known to be present in the
nuclear environment (Netzer et al. 2005; Wang et al. 2013a). This was partly compensated
through the power-law component, whose photon index was left free to vary and constrained
up to 5 keV. Moderate column densities (a few ×1021
cm−2
around the nuclei, then reducing
with distance) were also required. In brief, within the inner regions the gas density becomes
compatible with the r−2
trend, while a central temperature Tc ∼ 1–1.5 keV does not sub-
stantially modify the wind expansion range suggested above. This simplified, preliminary
analysis confirms that the soft X-ray emission in the core of NGC 6240, which is spatially
correlated with the Hα filaments, is most likely dominated by shock-heated material in a re-
cent starburst-driven wind, whose connection with the simultaneous black hole growth (e.g.,
King 2005) is hard to determine. As the detailed study of this component is the subject of
a companion paper (Wang et al. 2013b), its physical properties are not discussed further in
this context.
5.3. Dark Matter
The large deviations from a classical wind model, in particular the flat temperature
distribution, hint at near-isothermal, hydrostatic equilibrium. Together with the long cooling
time (a few Gyr), this implies some form of gravitational confinement. Given the extent of
the hot-gas halo, the baryonic matter is likely just a fraction of the total gravitating mass.
Assuming the existence of a dark matter halo with an NFW density profile (Navarro et al.
1997), the gas virial temperature can be written as follows:
kTvir =
1
2
µmp
GMvir
rvir
≃ 0.135
Mvir
1012M⊙
rvir
100 kpc
−1
keV,
where rvir is the virial radius, usually taken to enclose an overdensity by a factor of 200
with respect to either the mean or the critical cosmic value at the time of the gravitational
42. – 42 –
Fig. 15.— Radial dependence of temperature (red dots) and electron density (blue crosses)
of the soft X-ray emitting gas in NGC 6240, estimated on different annular regions up to a
galactocentric distance of 80′′
(∼40 kpc). Note the logarithmic scale adopted for densities
on the right-hand vertical axis.
43. – 43 –
collapse, and Mvir the virial mass within the corresponding volume, serving as a proxy for
the total halo mass. Accordingly, the dark halo of NGC 6240 has to be both massive and
compact in order to confine the soft X-ray emitting gas within its potential well. Making
use of the relations in Mo & White (2002) we can render explicit the dependence of rvir on
mass and redshift, obtaining that kTvir ∼ 0.042 M
2/3
12 (1 + z) keV, where M12 is the virial
mass expressed in units of 1012
M⊙.
A possible evolutionary scenario consistent with the observed gas temperature of 0.65
keV is that of a cold dark matter halo formed at z ∼ 2, with a total mass of ∼1013
M⊙.
This value marks the standard separation between galaxy-scale and group-scale halos (see
Humphrey et al. 2006). For comparison, the Milky Way is estimated to have a virial mass of
∼1.3×10¹²
M⊙ (McMillan 2011). NGC 6240 is then consistent with the central remnant of a
group of galaxies. This interpretation was first proposed by Huo et al. (2004), considering
the huge content of hot gas (> 1010
M⊙), the low metallicity of the outer halo, and the large
velocity dispersion (the full width at zero intensity of CO emission lines reaches up to ∼1400
km s−1
; Feruglio et al. 2012). However, no evidence has been reported so far of a present-day
galaxy overdensity in the surroundings of NGC 6240. Any other group member may have
experienced a merger in the past, but in this case the progenitors of the final coalescence we
are now witnessing would be elliptical-like, or highly irregular, rather than disk-like.
The degree of the uncertainties involved in linking the spectroscopic and virial tempera-
tures (e.g., Ciotti & Pellegrini 2008), and some ambiguity in the definitions themselves (e.g.,
Voit 2005), should also be kept in mind. Moreover, the gas temperature estimated through
the single thermal model is only a first approximation, and could be somewhat unreliable.
The best fit to the full halo spectrum calls for two components with different temperatures
and abundances (model E). It is then reasonable to associate the warmer (kT1 ∼ 0.8 keV)
and metal-richer (Zα ∼ 0.5 solar) component with the chemically-evolved, starburst-injected
gas, and to identify the cooler (kT2 ∼ 0.25 keV) and metal-poorer (Z ≡ 0.1 solar) compo-
nent with the gravitationally-bound, pre-existing halo material. Also the energy dissipated
during the merger process may contribute to the heating of the ambient gas. In this view, a
fossil group nature for the system would not be strictly required, and the dark matter halo
of NGC 6240 would be broadly consistent with just a pair of massive spiral galaxies.
The lower temperature of ∼0.25 keV would be also in good agreement with the virial
temperature kTσ ∼ µmpσ2
∗ ∼ 0.3 keV derived from the average stellar velocity dispersion,
σ∗ ≃ 200–220 km s−1
(Engel et al. 2010b). This comparison is physically motivated only
for early-type galaxies (e.g., Pellegrini 2011), which are actually believed to represent the
ultimate evolutionary stage of a major merger such as NGC 6240. Although the potential
of the nuclear dynamical mass is expected not to be dominant on the halo scales, the stellar
44. – 44 –
radial surface brightness profile follows the r1/4
law typical of elliptical galaxies out to ∼20–
25 kpc (Bush et al. 2008). While some of the disk-like structures are still present, the whole
remnant has apparently entered the final relaxation phase.
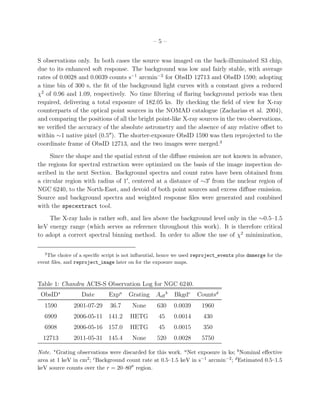
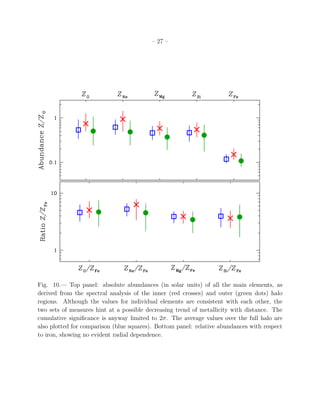
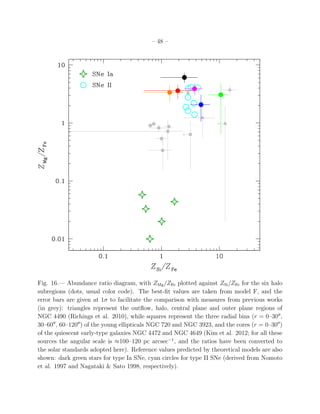
5.4. Metal Enrichment
Another primary source of information to understand the nature of the X-ray halo is
the metallicity pattern, including absolute and relative abundances and their dependence
on galactocentric distance. The average α-element to iron abundance ratio turns out to
be generally supersolar all across the halo (Table 7). This is a key observable to trace
the chemical evolution of the interstellar matter, due to the different production yields and
typical time-scales of the various SNe populations involved. Synthesis models for type II
SNe (i.e., core-collapsed massive stars) predict Si/Fe ratios up to ∼3–5 solar (e.g., Nomoto
et al. 2006), while these drop to ∼0.5 solar for type Ia SNe (i.e., exploded white dwarfs
in close binary systems). Evidence for a supersolar Si/Fe ratio, for instance, was found in
galaxy mergers like the Antennae (Baldi et al. 2006a,b), and has been recently revealed in
the central regions of young elliptical galaxies, which are the sites of the latest (a few tens
of Myr), merger-induced star formation (Kim et al. 2012).
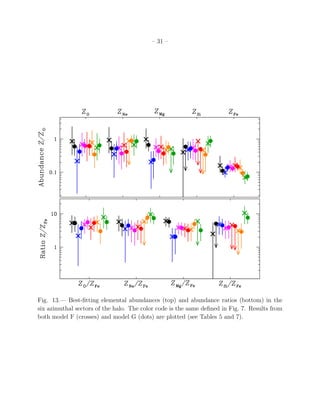
In Fig. 16 the abundance ratios ZMg/ZFe and ZSi/ZFe are plotted against each other as
diagnostics of the enrichment history in the six azimuthal sectors of the halo. For comparison,
the same values are shown for different regions of the disturbed spiral galaxy NGC 4490,
which is interacting with the nearby irregular companion NGC 4485 (Richings et al. 2010),
and of the elliptical galaxies analyzed by Kim et al. (2012). In such a diagram, the theoretical
yields from various models of type Ia SNe (Nomoto et al. 1997) and type II SNe (Nagataki
& Sato 1998) have a wide separation. All of the S1–S6 halo subregions definitely occupy
the typical location of starburst environments, dominated by a young stellar population and
type II SNe. From an evolutionary perspective, NGC 6240 should gradually move towards
the intermediate position of early-type galaxies, following the takeover by type Ia SNe after
the merger completion and the starburst fading.
There is actually a possible caveat to the picture outlined above. By assuming in our
fits a solar abundance for nickel, we obtain a nominal Ni/Fe ratio ∼7 times above solar in
the full halo. Similar findings have been discussed over the past two/three decades for SN
remnants (based on the strength of forbidden optical/near-IR [Ni ii] lines; e.g., Bautista et
al. 1996) and galaxy clusters (e.g., Dupke & White 2000). On average, type Ia SNe are
expected to have a much higher production yield for nickel with respect to type II SNe. A
large relative abundance of nickel, if real, would imply a more complex enrichment history.
45. – 45 –
As mentioned before, however, ZNi can only be poorly constrained, due to its degeneracy
with ZNe. Our assumption of a single thermal component might also introduce some bias.
Indeed, by tying nickel and iron abundances in the two-temperature model D we achieve a
statistically equivalent fit, with ∆χ2
< 0.5, and just an increase of ZNe to ∼0.6 solar. In
general, the best-fitting abundance ratios from model D are slightly lower (Table 7), but
still in excellent agreement with the predicted yields of type II SNe for all elements, nickel
included.
Based on the above considerations, the whole halo of NGC 6240 appears to have expe-
rienced a significant metal enrichment by type II SNe. The constant abundance ratios in the
inner and outer halo imply that the enrichment process has been uniform. As a consequence,
the gas redistribution cannot be associated to recent starburst episodes, but has rather pro-
ceeded in the whole course of the interaction, whose timescale up to now is presumably ∼1
Gyr. Mergers of identical disk galaxies with massive stellar bulges are characterized by a sin-
gle, intense peak of star formation during the nuclear coalescence (Springel et al. 2005; Cox
et al. 2008). Entering this major burst, NGC 6240 is going to exceed the ULIRG luminosity
threshold (Tacconi et al. 1999). The final stage is not imminent yet, since the two nuclei
(which are the remnant of the progenitors’ bulges) still have a projected separation of ∼0.8
kpc (1.5′′
; Max et al. 2007) and are possibly in the process of separating again (Tecza et al.
2000; Engel et al. 2010b). This notwithstanding, the identification of several tens of young
circumnuclear star clusters, with ages in the range ∼5–15 Myr, confirms that enhanced star
formation activity compared to isolated, quiescent galaxies is currently ongoing (Pasquali et
al. 2003; Pollack et al. 2007). A steady star formation rate of this kind (61 M⊙ yr−1
; Yun
& Carilli 2002) over the past ∼200 Myr (the dynamical age of the soft X-ray halo), perhaps
involving the peripherical regions, can easily account for the energy and metallicity content
of the hot gas component. The tentative decrease with radius of the absolute abundances
hints at the gentle mixing of the starburst-driven outflows with a pre-existing halo medium,
as also suggested by the best-fitting spectral model E. If no dilution effect were present and
the dispersion of metal-rich gas were highly efficient, the observed metallicity gradient would
be positive, with supersolar abundances at the larger distances (Cox et al. 2006).
The fate of the starburst-processed gas is not clear. Some merger remnants, and young
ellipticals bearing the signatures of recent interactions, are under-luminous in the X-rays
with respect to relaxed early-type galaxies (Fabbiano & Schweizer 1995; Read & Ponman
1998), while different mechanisms of halo regeneration have been proposed (O’Sullivan et
al. 2001b). If the wind temperature is much larger than the virial temperature, most of
the hot gas is not bound and will eventually escape the system, becoming undetectable in
the X-rays due to the density drop. In NGC 6240, the single-temperature cooling time of
a few Gyr implies that the halo luminosity will not be fully extinguished after the merger
46. – 46 –
conclusion. In the more complex scenarios, the different gas phases might have much shorter
cooling times, depending on their degree of mixing. According to model E, unless the filling
factors are very small (η ≪ 0.1), the radiative cooling of the warmer gas component will
take several hundreds of Myr at least. Provided that some favorable conditions are met (e.g.,
the ultimate AGN feedback is not dramatically powerful, the cooler gas component exerts a
sufficient drag, and the gravitational potential well is deep enough), NGC 6240 could be a
case of major merger with no complete blow-out.
47. – 47 –
Table 7: Relative Abundances of α-elements with respect to Iron.
Reg Mod ZO/ZFe ZNe/ZFe ZMg/ZFe ZSi/ZFe
FH A 4.44+1.75
−1.51 5.07+1.42
−1.41 3.83+0.91
−0.94 4.13+1.70
−1.52
B 4.58+1.73
−1.43 5.25+1.41
−1.33 3.90+0.90
−0.92 3.95+1.55
−1.43
C 4.63+1.38
−1.18 5.10+1.22
−1.19 3.80+0.77
−0.77 3.85+1.17
−1.04
D 2.44+1.81
−1.00 2.13+3.08
−1.58 3.73+1.09
−1.01 3.28+1.93
−1.25
S1 F 5.34+3.72
−2.65 5.77+3.08
−2.77 6.10+2.13
−1.88 2.50+3.04
−2.47
G 5.29+2.90
−2.39 4.52+2.69
−2.40 5.80+2.09
−1.92 2.36+2.70
−2.36
S2 F 2.19+2.64
−1.91 3.54+2.75
−3.20 2.07+1.70
−1.71 4.83+3.65
−2.47
G 3.68+2.31
−1.95 4.46+2.53
−2.31 2.06+1.59
−1.45 4.53+2.54
−2.24
S3 F 4.80+3.07
−2.29 3.77+2.47
−2.40 3.89+1.61
−1.51 3.73+2.55
−1.98
G 5.60+2.64
−2.16 3.20+2.29
−2.11 3.77+1.71
−1.57 3.91+2.38
−2.09
S4 F 3.87+3.38
−2.22 4.05+2.49
−2.42 3.60+1.66
−1.62 1.92+2.69
−1.92
G 5.33+2.96
−2.44 3.59+2.57
−2.32 3.20+1.88
−1.74 1.60+2.69
−1.60
S5 F 5.60+3.35
−2.77 1.67+4.25
−1.67 3.38+1.95
−1.85 1.39+1.74
−1.39
G 3.01+2.14
−1.80 7.67+2.96
−2.61 4.96+1.82
−1.66 2.91+2.29
−2.02
S6 F 7.89+7.47
−4.22 9.59+5.72
−4.21 3.07+2.91
−3.07 10.6+6.5
−5.6
G 5.67+2.88
−2.36 7.44+3.04
−2.63 3.20+1.82
−1.68 7.67+3.12
−2.64
Note. Since the errors on the individual elements are asymmetric and strongly correlated, these
cannot be added in quadrature to obtain the confidence ranges for ratios, which have been
computed, instead, by introducing a dummy Gaussian component with zero normalization, and
linking a multiplicative factor to the abundance ratio.
48. – 48 –
Fig. 16.— Abundance ratio diagram, with ZMg/ZFe plotted against ZSi/ZFe for the six halo
subregions (dots, usual color code). The best-fit values are taken from model F, and the
error bars are given at 1σ to facilitate the comparison with measures from previous works
(in grey): triangles represent the outflow, halo, central plane and outer plane regions of
NGC 4490 (Richings et al. 2010), while squares represent the three radial bins (r = 0–30′′
,
30–60′′
, 60–120′′
) of the young ellipticals NGC 720 and NGC 3923, and the cores (r = 0–30′′
)
of the quiescent early-type galaxies NGC 4472 and NGC 4649 (Kim et al. 2012; for all these
sources the angular scale is ≈100–120 pc arcsec−1
, and the ratios have been converted to
the solar standards adopted here). Reference values predicted by theoretical models are also
shown: dark green stars for type Ia SNe, cyan circles for type II SNe (derived from Nomoto
et al. 1997 and Nagataki & Sato 1998, respectively).
49. – 49 –
6. Summary and Conclusions
We have presented an X-ray spectral and imaging analysis of the ultraluminous infrared
galaxy merger NGC 6240, based on the combined ∼182-ks exposure from a pair of new (145
ks) and archival (37 ks) Chandra observations. NGC 6240 is a very complex system at all the
physical scales, sporting a heavily-obscured, dual AGN in the central kpc, a circumnuclear
environment swept by powerful starburst-driven winds, and a spectacular halo of hot gas,
which definitely make of this source one of the most intriguing extragalactic targets. In this
work, we have focused on the diffuse, soft X-ray emission at r > 15′′
(∼7.5 kpc) from the
visual centroid, coincident with the southern nucleus. Our main results can be summarized
as follows:
1. In the soft X-rays, the surface brightness of NGC 6240 exceeds the background at the
3σ confidence level out to an average radius of ∼50 kpc. This huge halo shows a slightly
elongated, diamond-like shape, with nearly perpendicular directions of maximum and
minimum extension and a projected size at full length of ∼110×80 kpc. The global
morphology is clumpy and filamentary throughout this range.
2. The X-ray emission from the full halo is consistent with a single-temperature gas heated
at ∼0.65 keV (7.5 million K), with a typical density of a few ×10−3
cm−3
and a total
mass of 1.3×10¹⁰
M⊙. Given the estimated thermal energy content of ∼5×1058
erg, the
intrinsic 0.4–2.5 keV luminosity of 4×1041
erg s−1
implies a cooling time larger than a
Gyr, under the assumption of a filling factor η ∼ 1.
3. The spatially-resolved spectral analysis, feasible thanks to the adequate number of net
counts available, reveals limited variations, with no apparent correlation of the gas
physical parameters with the main morphological features. In the radial direction, the
inferred properties clearly differ from those expected for an adiabatic outflow, being
the temperature virtually constant and the density slowly decreasing.
4. Absolute abundances are generally subsolar, with possible gradients among the az-
imuthal sectors, whose statistical significance is anyway marginal. In spite of the large
error bars, a tentative metallicity drop with radius is found with a cumulative 2σ con-
fidence. Abundance ratios between the main α-elements and iron are several times the
solar value, calling for a metal enrichment dominated by type II SNe.
Based on the luminosity of its X-ray halo, NGC 6240 might even be the remnant of
a small group of galaxies, on its way to becoming a massive elliptical. The gas heating
can be ascribed to different mechanisms, including the dissipation of kinetic energy during
50. – 50 –
the galactic collision, the fast shocks within a starburst-driven superwind, the virialization
by a group-like gravitational potential. When examined individually, none of the latter
interpretations accounts in a self-consistent manner for the observational evidence in its
entirety. Although the application of a simple thermal model provides useful information
on the basic properties of the halo, the actual physical conditions are likely much more
complex. Indeed, the best-fitting spectral model consists of a multi-phase gas with different
temperature and metallicity, and suggests the mixing of two primary gas components. In
our favorite scenario, the warmer one (kT ∼ 0.8 keV) has been chemically-contaminated
(Zα ∼ 0.5 solar) by a regular, widespread star formation activity over the past ∼200 Myr,
following the dynamical interaction of the parent galaxies; the cooler one (kT ∼ 0.25 keV)
is related to the metal-poor (Z ∼ 0.1 solar), pre-existing ambient material, which has been
heated up to X-ray emitting temperatures due to either the merger-induced dissipation and
shocks or the binding energy of the dark matter halo. The present data quality does not
allow us to probe this picture in more depth. Subject to such a high spatial resolution,
a further improvement (by at least a factor of ∼5) in the amount of net counts available
would be needed to clearly disentangle the gas components of different temperature, and to
significantly constrain any abundance gradient within the halo. While the system is already
relaxing, and the final coalescence of the two nuclei will ultimately lead to the formation of
a young elliptical galaxy, it is still unclear how much of the hot, diffuse gas can be retained
in the form of an X-ray bright, hydrostatic halo.
In conclusion, this work confirms NGC 6240 as one of the most striking sources in the
local Universe, whose study delivers plenty of challenging information for both theoretical
models and numerical simulations, with far-reaching implications in all the fields of galaxy
formation and evolution.
Acknowledgments. This research is supported by NASA grant GO1-12123X (PI: G. Fab-
biano). We thank the anonymous referee for a careful reading, and constructive comments
that helped improving the clarity of this paper. We acknowledge support from the Chan-
dra X-ray Center (CXC), which is operated by the Smithsonian Astrophysical Observatory
(SAO) for and on behalf of NASA under contract NAS8-03060. We have made use of soft-
ware provided by the CXC in the application packages ciao and Sherpa, and of SAOImage
DS9, developed by SAO. The X-ray data were retrieved from the Chandra Data Archive, and
the HST image was obtained from the MAST data archive at the Space Telescope Science
Institute. STScI is operated by the Association of Universities for Research in Astronomy,
Inc., under NASA contract NAS5-26555.
51. – 51 –
Appendix
We summarize below the spectral models employed in this work, and their underlying
assumptions in the application to the different halo regions. The basic form involves thermal
emission from hot gas in collisional ionization equilibrium, modified by Galactic absorption
only. We also probed the possible presence of neutral column density local to the source,
and the contribution of an additional power-law or thermal component. Abundances of Fe,
O, Ne, Mg, and Si are allowed to be different fractions of solar values.
A – wabs*zwabs*(vapec+powerlaw) – Full halo spectrum, grouped to a 4σ significance per
energy channel and fitted with the χ2
statistic.
B – wabs*zwabs*(vapec+powerlaw) – Ungrouped (with at least one count per bin) spectra
of the full, inner and outer halo regions, fitted with the C-statistic.
C – wabs*vapec – Ungrouped spectra of the azimuthal regions S1–S6, fitted simultaneously
with both temperatures and abundances tied, and of the radial regions H1–H5, fitted simul-
taneously in the spatially-resolved analysis with temperatures free and abundances tied.
D – wabs*(vapec+vapec) – Grouped spectrum of the full halo, with abundances tied be-
tween the two thermal components.
E – wabs*(vapec+vapec) – Grouped spectrum of the full halo, with abundance set to 0.1
solar for all the elements in the low-temperature component.
F – wabs*vapec – Ungrouped spectra of the individual S1–S6 regions, fitted independently
in the spatially-resolved azimuthal analysis.
G – wabs*vapec – Ungrouped S1–S6 spectra, fitted simultaneously with a single parameter
of interest free to vary, in turn, over the different regions, and tied otherwise.
REFERENCES
Anders, E., & Grevesse, N. 1989, Geochim. Cosmochim. Acta, 53, 197
Armus, L., Bernard-Salas, J., Spoon, H. W. W., et al. 2006, ApJ, 640, 204
Baan, W. A., Hagiwara, Y., & Hofner, P. 2007, ApJ, 661, 173
Baldi, A., Raymond, J. C., Fabbiano, G., et al. 2006a, ApJS, 162, 113
Baldi, A., Raymond, J. C., Fabbiano, G., et al. 2006b, ApJ, 636, 158
Barnes, J. E. 1988, ApJ, 331, 699
Barnes, J. E., & Hernquist, L. 1992, ARA&A, 30, 705
52. – 52 –
Bautista, M. A., Peng, J., & Pradhan, A. K. 1996, ApJ, 460, 372
Beswick, R. J., Pedlar, A., Mundell, C. G., & Gallimore, J. F. 2001, MNRAS, 325, 151
Boller, T., Keil, R., Hasinger, G., et al. 2003, A&A, 411, 63
Borkowski, K. J., Lyerly, W. J., & Reynolds, S. P. 2001, ApJ, 548, 820
Boroson, B., Kim, D.-W., & Fabbiano, G. 2011, ApJ, 729, 12
Braine, J., Davoust, E., Zhu, M., et al. 2003, A&A, 408, L13
Brassington, N. J., Ponman, T. J., & Read, A. M. 2007, MNRAS, 377, 1439
Bush, S. J., Wang, Z., Karovska, M., & Fazio, G. G. 2008, ApJ, 688, 875
Canizares, C. R., Fabbiano, G., & Trinchieri, G. 1987, ApJ, 312, 503
Cash, W. 1979, ApJ, 228, 939
Chevalier, R. A. 1977, ARA&A, 15, 175
Chevalier, R. A., & Clegg, A. W. 1985, Nature, 317, 44
Ciotti, L., & Pellegrini, S. 2008, MNRAS, 387, 902
Colina, L., Arribas, S., & Clements, D. 2004, ApJ, 602, 181
Cox, T. J., Di Matteo, T., Hernquist, L., et al. 2006, ApJ, 643, 692
Cox, T. J., Jonsson, P., Somerville, R. S., Primack, J. R., & Dekel, A. 2008, MNRAS, 384,
386
Dasyra, K. M., Tacconi, L. J., Davies, R. I., et al. 2006, ApJ, 651, 835
Davis, J. E. 2001, ApJ, 548, 1010
Downes, D., Solomon, P. M., & Radford, S. J. E. 1993, ApJ, 414, L13
Dupke, R. A., & White, R. E., III 2000, ApJ, 528, 139
Ebeling, H., White, D. A., & Rangarajan, F. V. N. 2006, MNRAS, 368, 65
Egami, E., Neugebauer, G., Soifer, B. T., et al. 2006, AJ, 131, 1253
Engel, H., Tacconi, L. J., Davies, R. I., et al. 2010a, ApJ, 724, 233