Download to read offline
![The galaxy cluster merger Abell 2744 7
shear of the lens, with the two components expressed in VLT ellipticities in the innermost centre of the cluster is
complex notation. κ = ∂∂ ∗ ψ is the convergence, where problematic, but indeed the galaxy density is three times
the complex differential operator in the plane is defined as higher in the HST/ACS field and clearly dominating the
∂ ∂
∂ := ( ∂θ1 +i ∂θ2 ), with θ1 and θ2 being the two angular coor- adaptive-averaging process of the nonparametric reconstruc-
dinates in the sky. The indices i, j indicate the discretisation tion algorithm that we used for the further analysis (com-
of the input data and the lens properties, where we have to pare Sec. 2.4 and Merten et al. (2009)).
take into account the full χ2 -function because the averaging Another issue is the possible double-counting of galaxies, so
process of background galaxies might result in an overlap we cross-correlated both catalogues with a correlation ra-
of neighbouring mesh points, expressed by the covariance dius of 2.5 and found 160 double-count candidates over the
matrix Cij . full HST/ACS field. Given the pixel size of the final recon-
The strong-lensing term is defined as struction, this translates to an insignificant average double-
´2 count probability of less than one galaxy per pixel. Fur-
(1 − Z(z)κ(ψ))2 − |Z(z)γ(ψ)|2 k
`
2 (det A(ψ))2 k thermore, the weighting scheme of the adaptive-averaging
χs (ψ) = 2
= 2
, (7)
σs σs process was implemented such, that the highest weight of
where the index k labels all pixels in the reconstruction the VLT ellipticities was identical to the smallest weight of
mesh, which are supposed to be part of the critical curve the HST/ACS ellipticities. Finally, the errors in the ellip-
within the uncertainties σs , given by the pixel size of the ticity measurement are treated in the joint reconstruction
grid. At these points, the Jacobian determinant det A(ψ) of method in a purely statistical way by deriving the variance
the lens mapping must vanish. of the weight-averaged sample of ellipticities in each recon-
We iterate towards a best-fitting lens potential by min- struction pixel.
imising the χ2 -function at each mesh position To derive a physical surface mass density from the scaled
lensing convergence one needs to know at least the mean
∂χ2 (ψ) ! redshift of the background galaxy population that was used
=0 with l ∈ [0, ..., Npix ] . (8)
∂ψl to produce the ellipticity catalogues. Problems with the
In practice, we achieve this by translating this operation into different depths of the fields and therefore with the final
a linear system of equations and invoking a two-level itera- mass analysis should not be a crucial issue for a relatively
tion scheme (see Merten et al. 2009, and references therein). low-redshift cluster like Abell 2744. However, the redshift
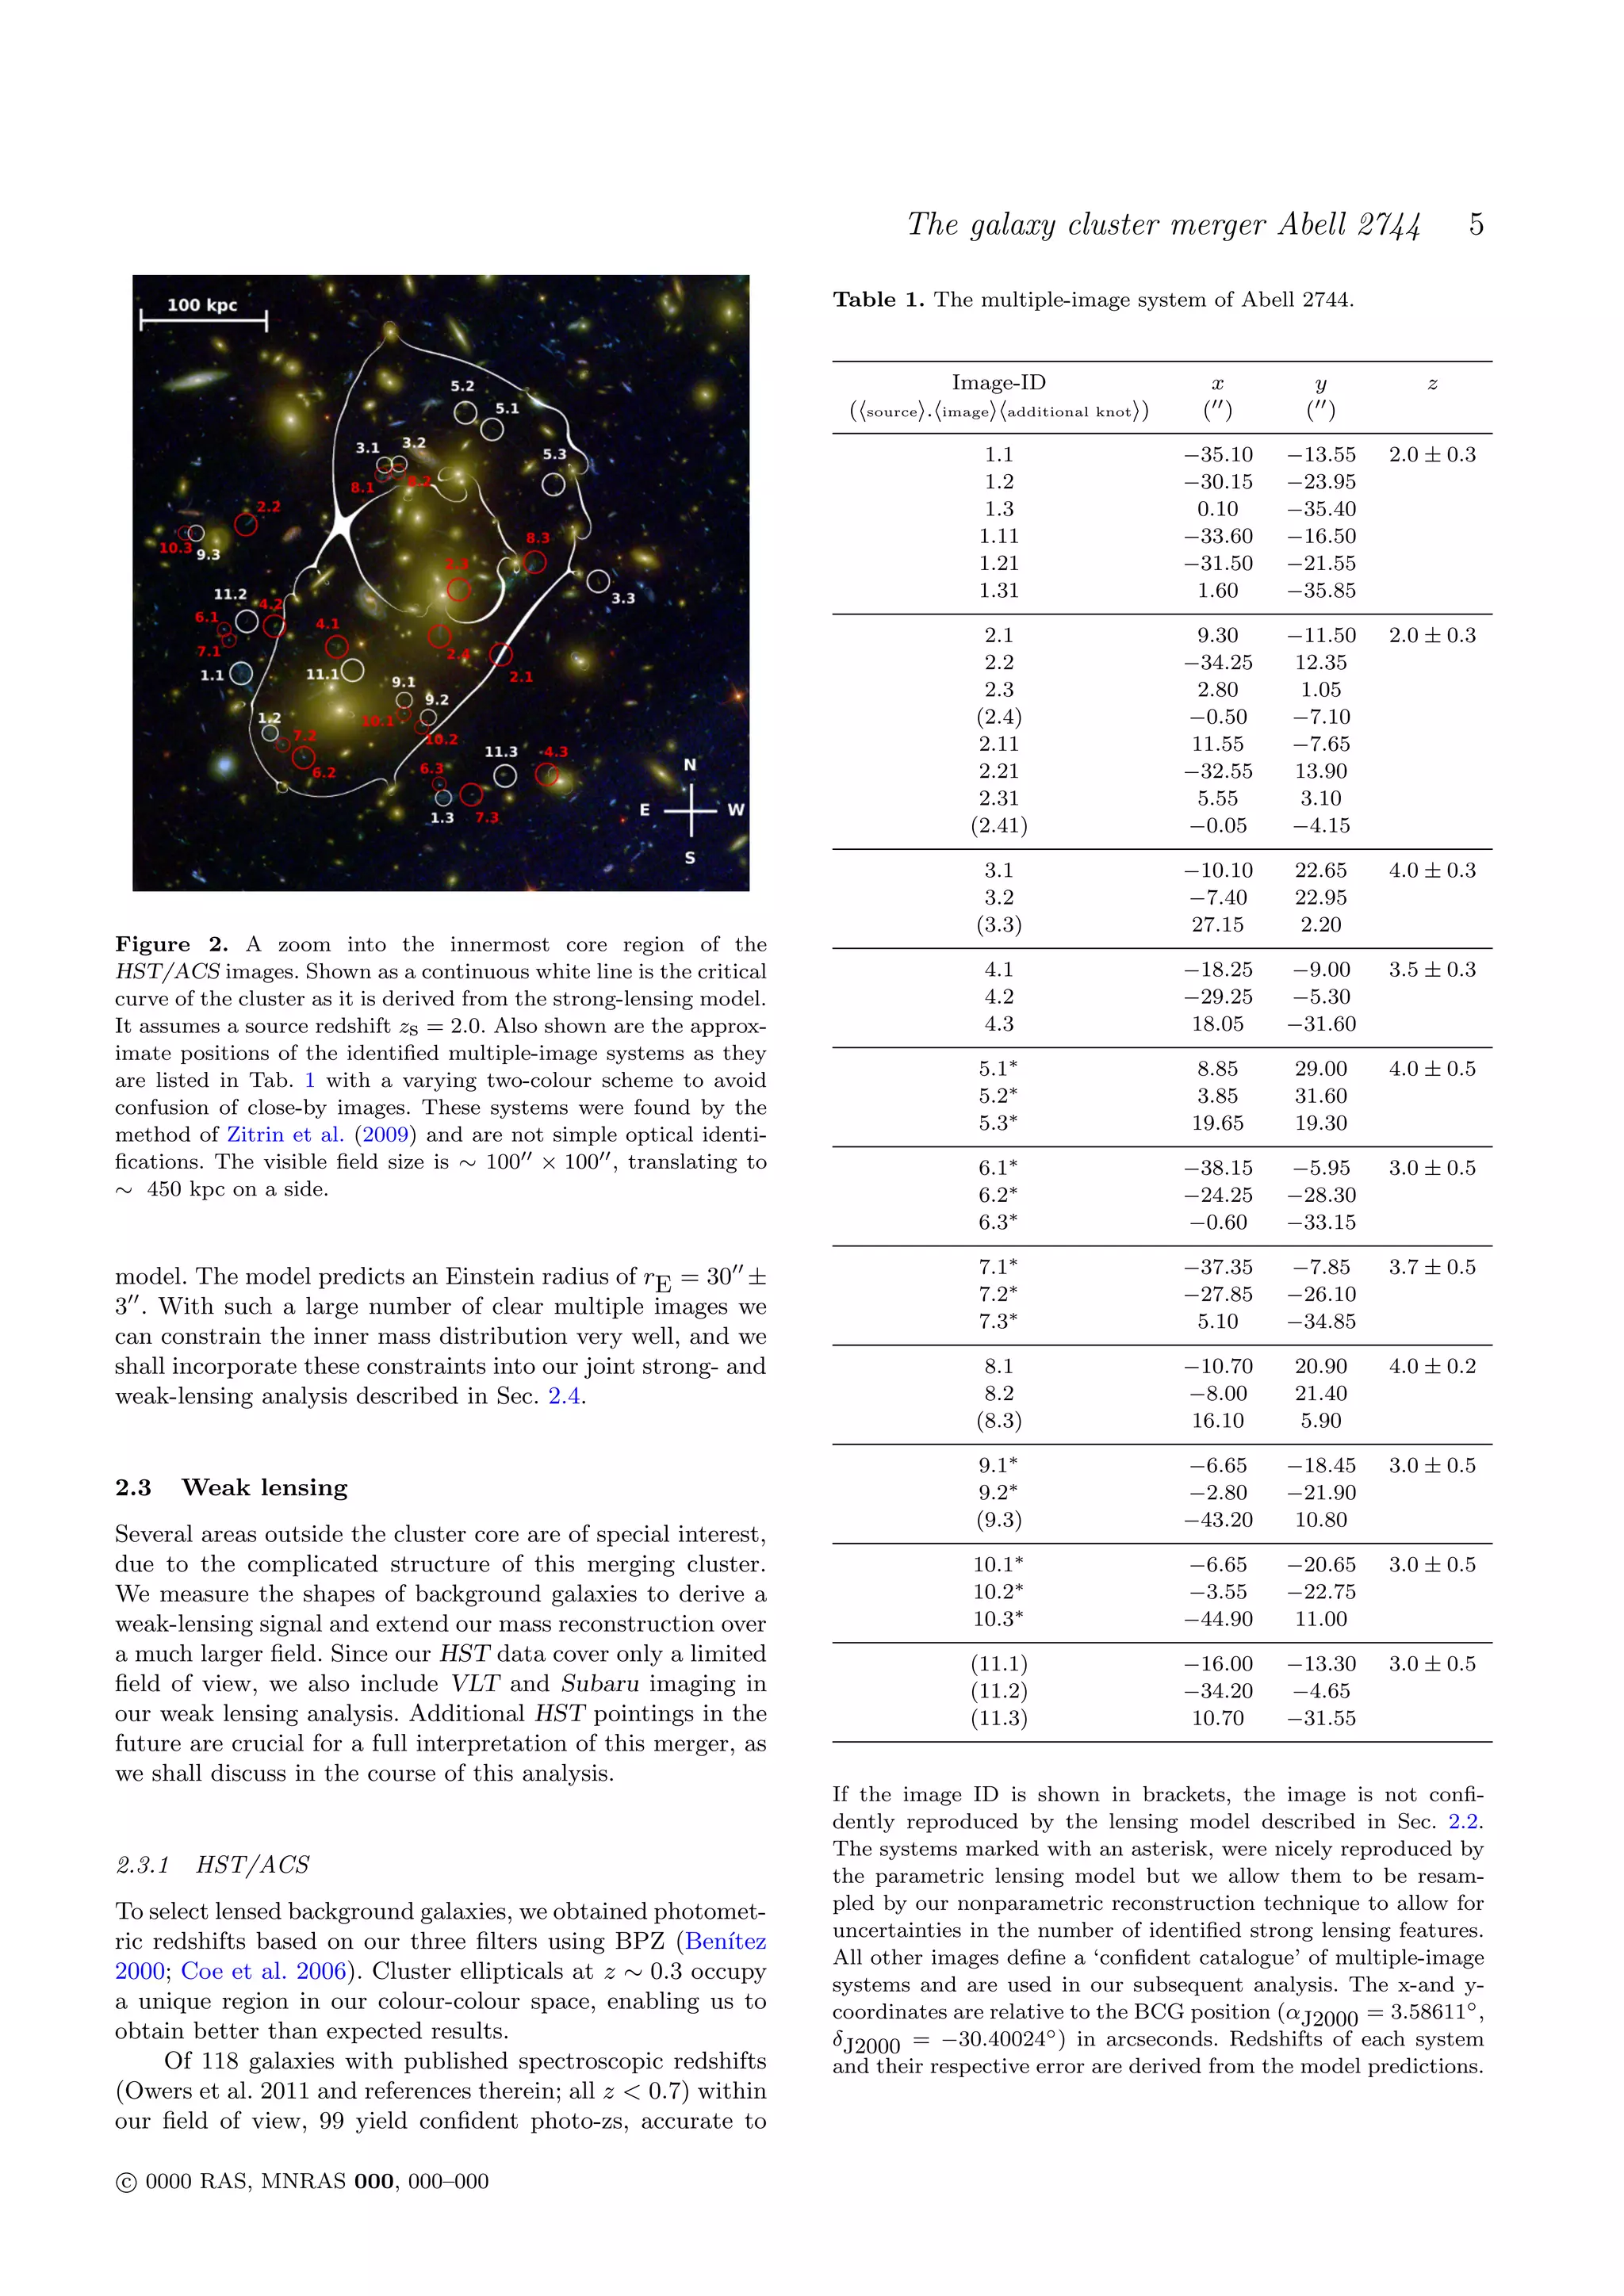
In this analysis, we use all strongly lensed multiple- for determining the surface-mass density from the recon-
image systems from the confident sample (Tab. 1) together structed convergence in the overlap area has been calculated
with their derived redshifts, and combine weak lensing shear as the galaxy-density weighted average of both, the VLT
catalogues from all three telescopes (see Sec. 2.3) as de- and theHST/ACS populations. The redshifts of the strong
scribed in Sec. 2.4.1. The combination of strong lensing data lensing features (compare Tab. 1) were included for the de-
and the density of background galaxies allows for a recon- termination of the core mass and the respective redshifts
struction on a mesh of 72 × 72 pixels in the central region of the VLT and Subaru source distribution was used in the
(corresponding to a pixel-scale of 8.4 /pix) and 36×36 pixels outskirts of the field.
in the outskirts of the field (corresponding to a pixel-scale of In order to test the effect of dilution in the outskirts of
16.7 /pix). Error estimates were produced by bootstrapping the field, we increased the ellipticity values for all Subaru
the redshift uncertainties of the strong-lensing constraints, background galaxies by 15% and repeated the reconstruc-
and resampling those multiple image systems in Tab. 1, tion. This test is necessary due to the single-band Subaru
which are marked with an asterisk. The result are 500 dif- imaging. As it turns out, the difference in the reconstructed
ferent bootstrap realisations of the refined cluster core. 150 convergence is marginal since the ellipticity values are al-
bootstrap realisations of the cluster outskirts were produced ready low with large scatter in this area of the field. How-
by bootstrapping the combined ellipticity catalogues. The ever, the effect was included in the determination of the error
number of bootstrap realisations is mainly constrained by budget for the reconstructed total mass and mass profile.
runtime considerations. All error estimates are calculated
from the scatter within the full bootstrap sample. If not
stated differently, the given value reflects 68% confidence 2.5 Reconstruction results
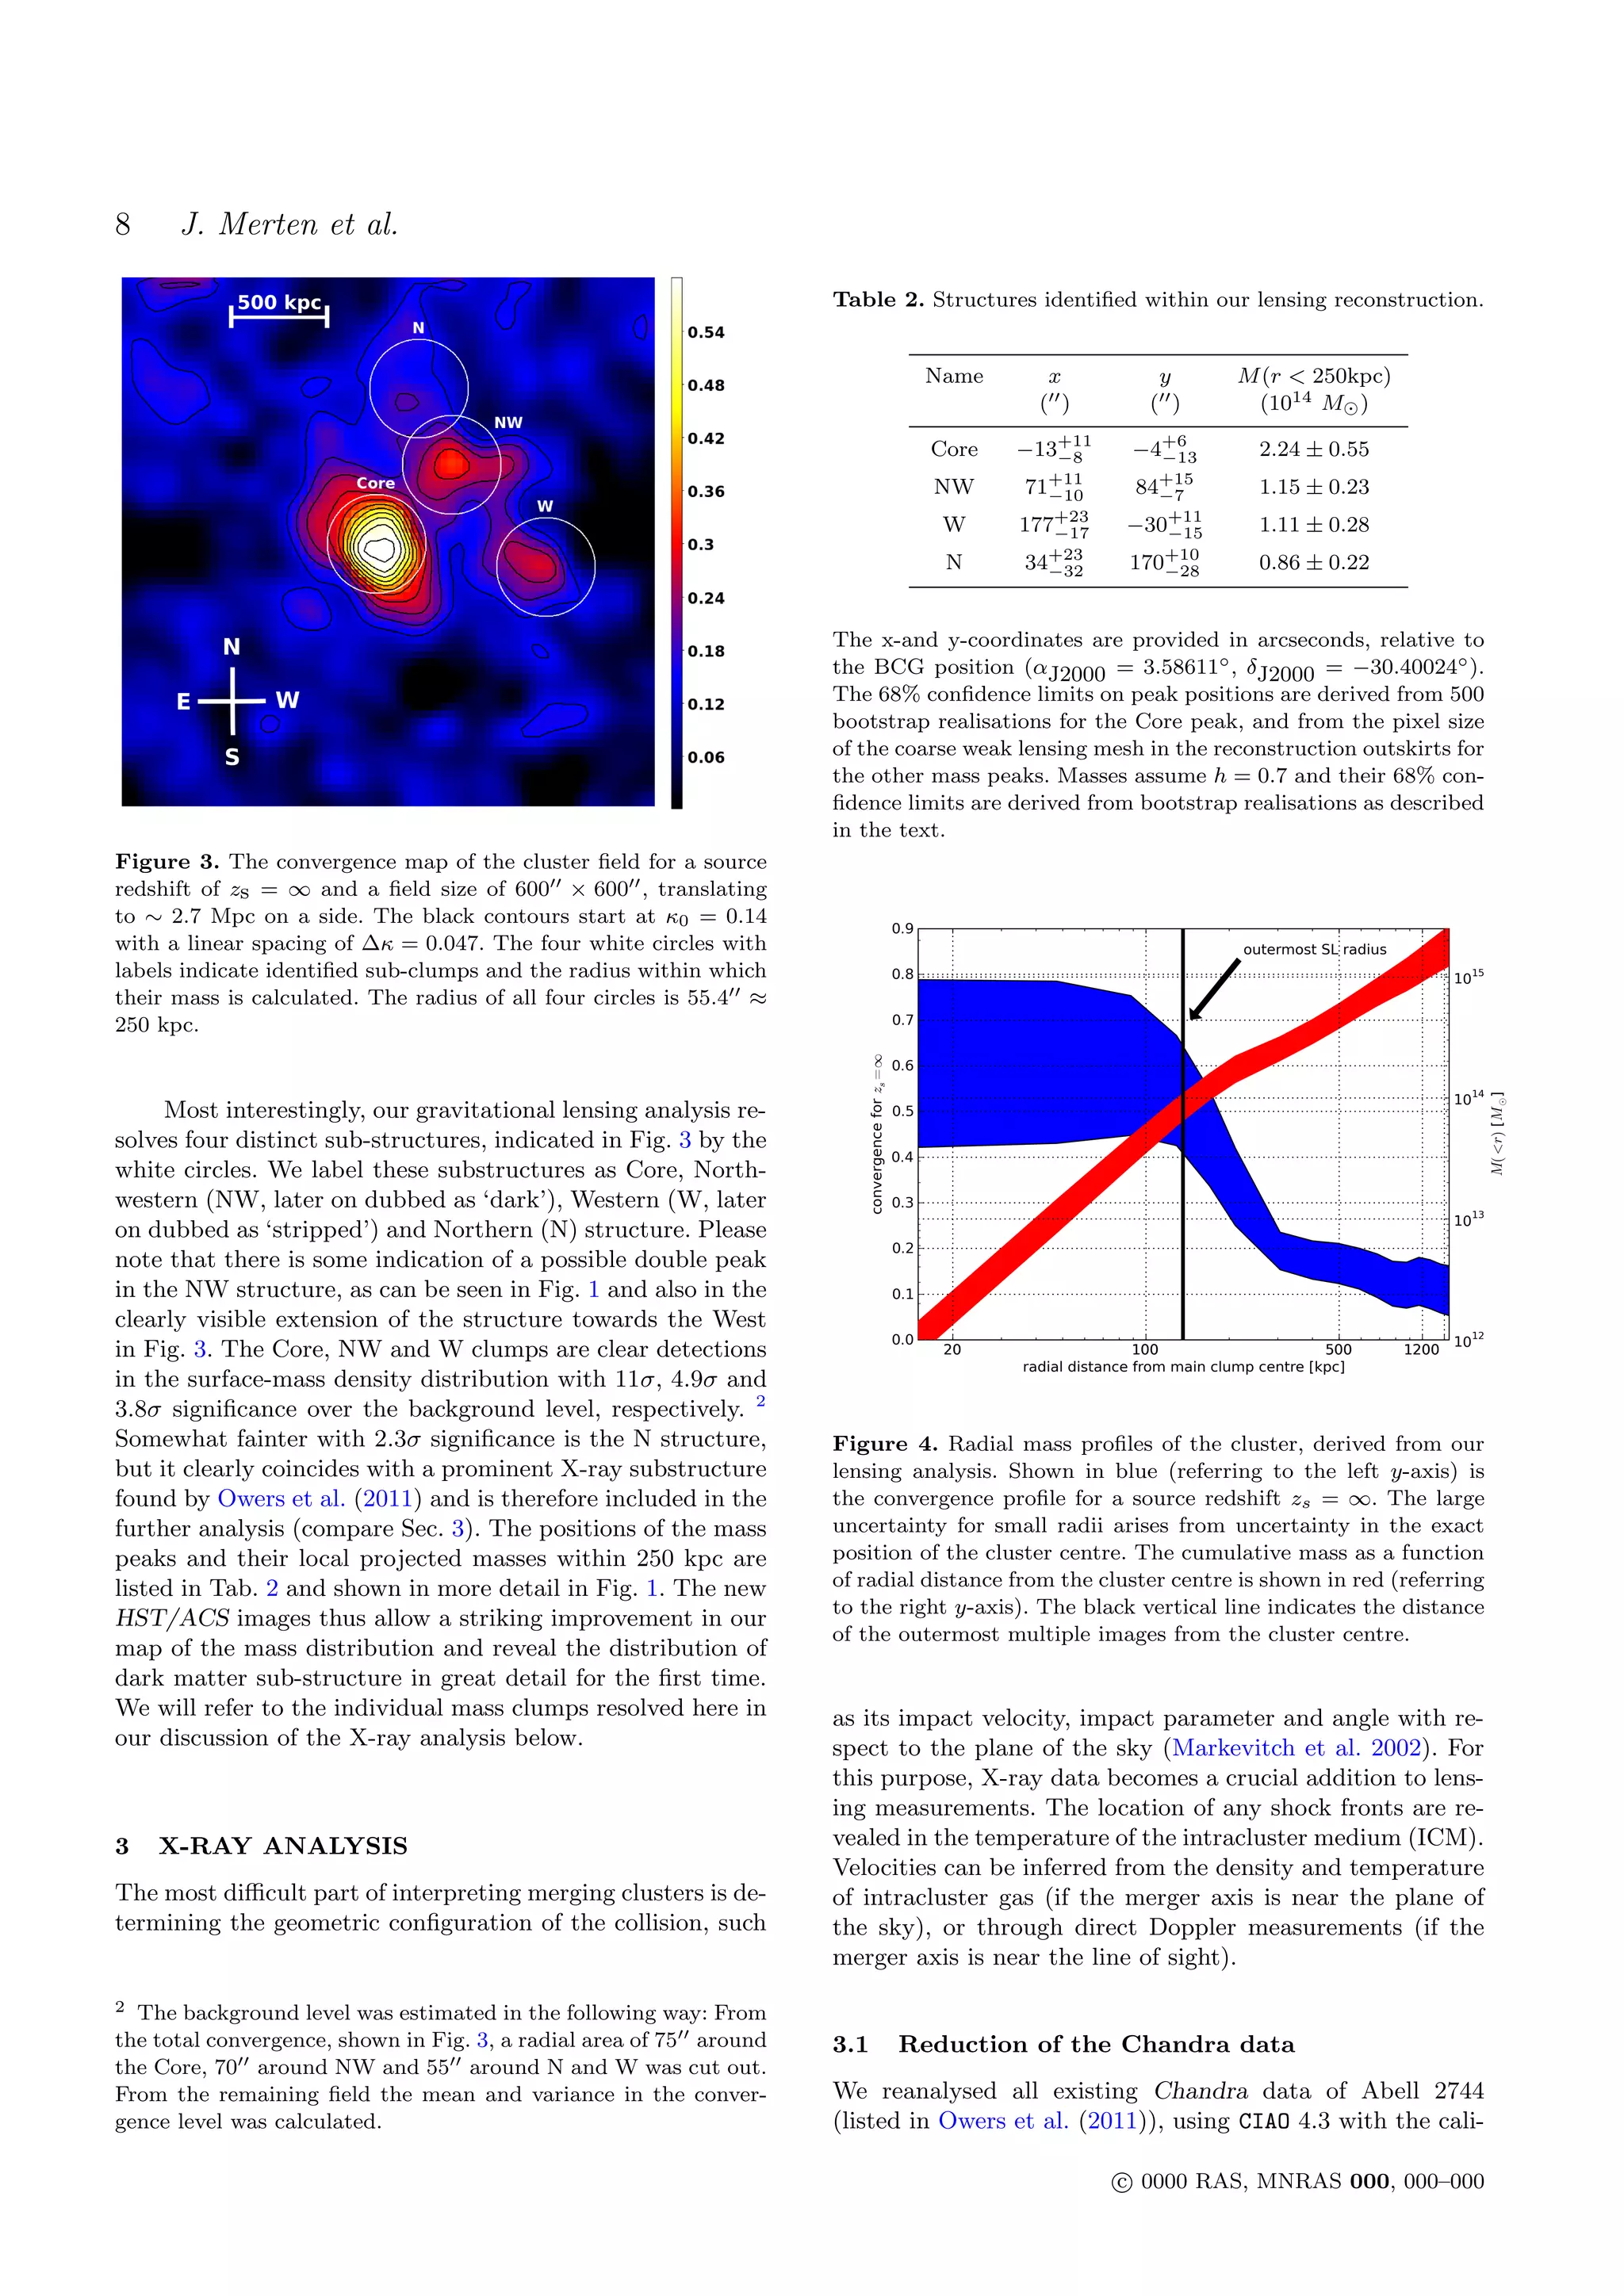
level. We obtain a map of the lensing convergence across the field
(proportional to the projected mass) by applying the Lapla-
cian operator to the lensing potential on the adaptively re-
2.4.1 Combining the catalogues
fined mesh (see Fig. 3). We find a total mass (by assuming
In order to combine the three different catalogues of ellip- h = 0.7 here and further on) within a radius of 1.3 Mpc
ticity measurements we used the following strategy. Clearly, around the Core of M (r < 1.3Mpc) = 1.8 ± 0.4 × 10¹⁵ M ,
the Subaru catalogue delivered the largest field-of-view but which is in good agreement with kinematically derived
it was derived from only single-band imaging and under bad masses (Boschin et al. 2006). A mass determination within a
seeing conditions. Therefore, we decided to limit its field field of (1300×750) kpc (to compare easily to the work on the
size to a box of 600 × 600 around the centre of the cluster Bullet Cluster of Bradaˇ et al. (2006)) centred on the Core
c
and to cut out the central ∼ 400 × 400 part, which was density peak yields M (1.73Mpc2 ) = 7.4 ± 1.0 × 10¹⁴ M ,
sufficiently covered by HST/ACS and VLT exposures with rendering Abell 2744 comparable in mass or slightly less
better data quality. As a result, Subaru data only covers the massive than the Bullet Cluster (Bradaˇ et al. 2006). The
c
outermost 200 on each side of the field. overall radial convergence and mass profile can be found in
One might argue that the combination of HST/ACS and Fig. 4.
c 0000 RAS, MNRAS 000, 000–000](https://image.slidesharecdn.com/creationofcosmicstructureinthecomplexgalaxyclustermergerabell2744-110622161403-phpapp02/75/Creation-of-cosmic-structure-in-the-complex-galaxy-cluster-merger-abell-2744-7-2048.jpg)
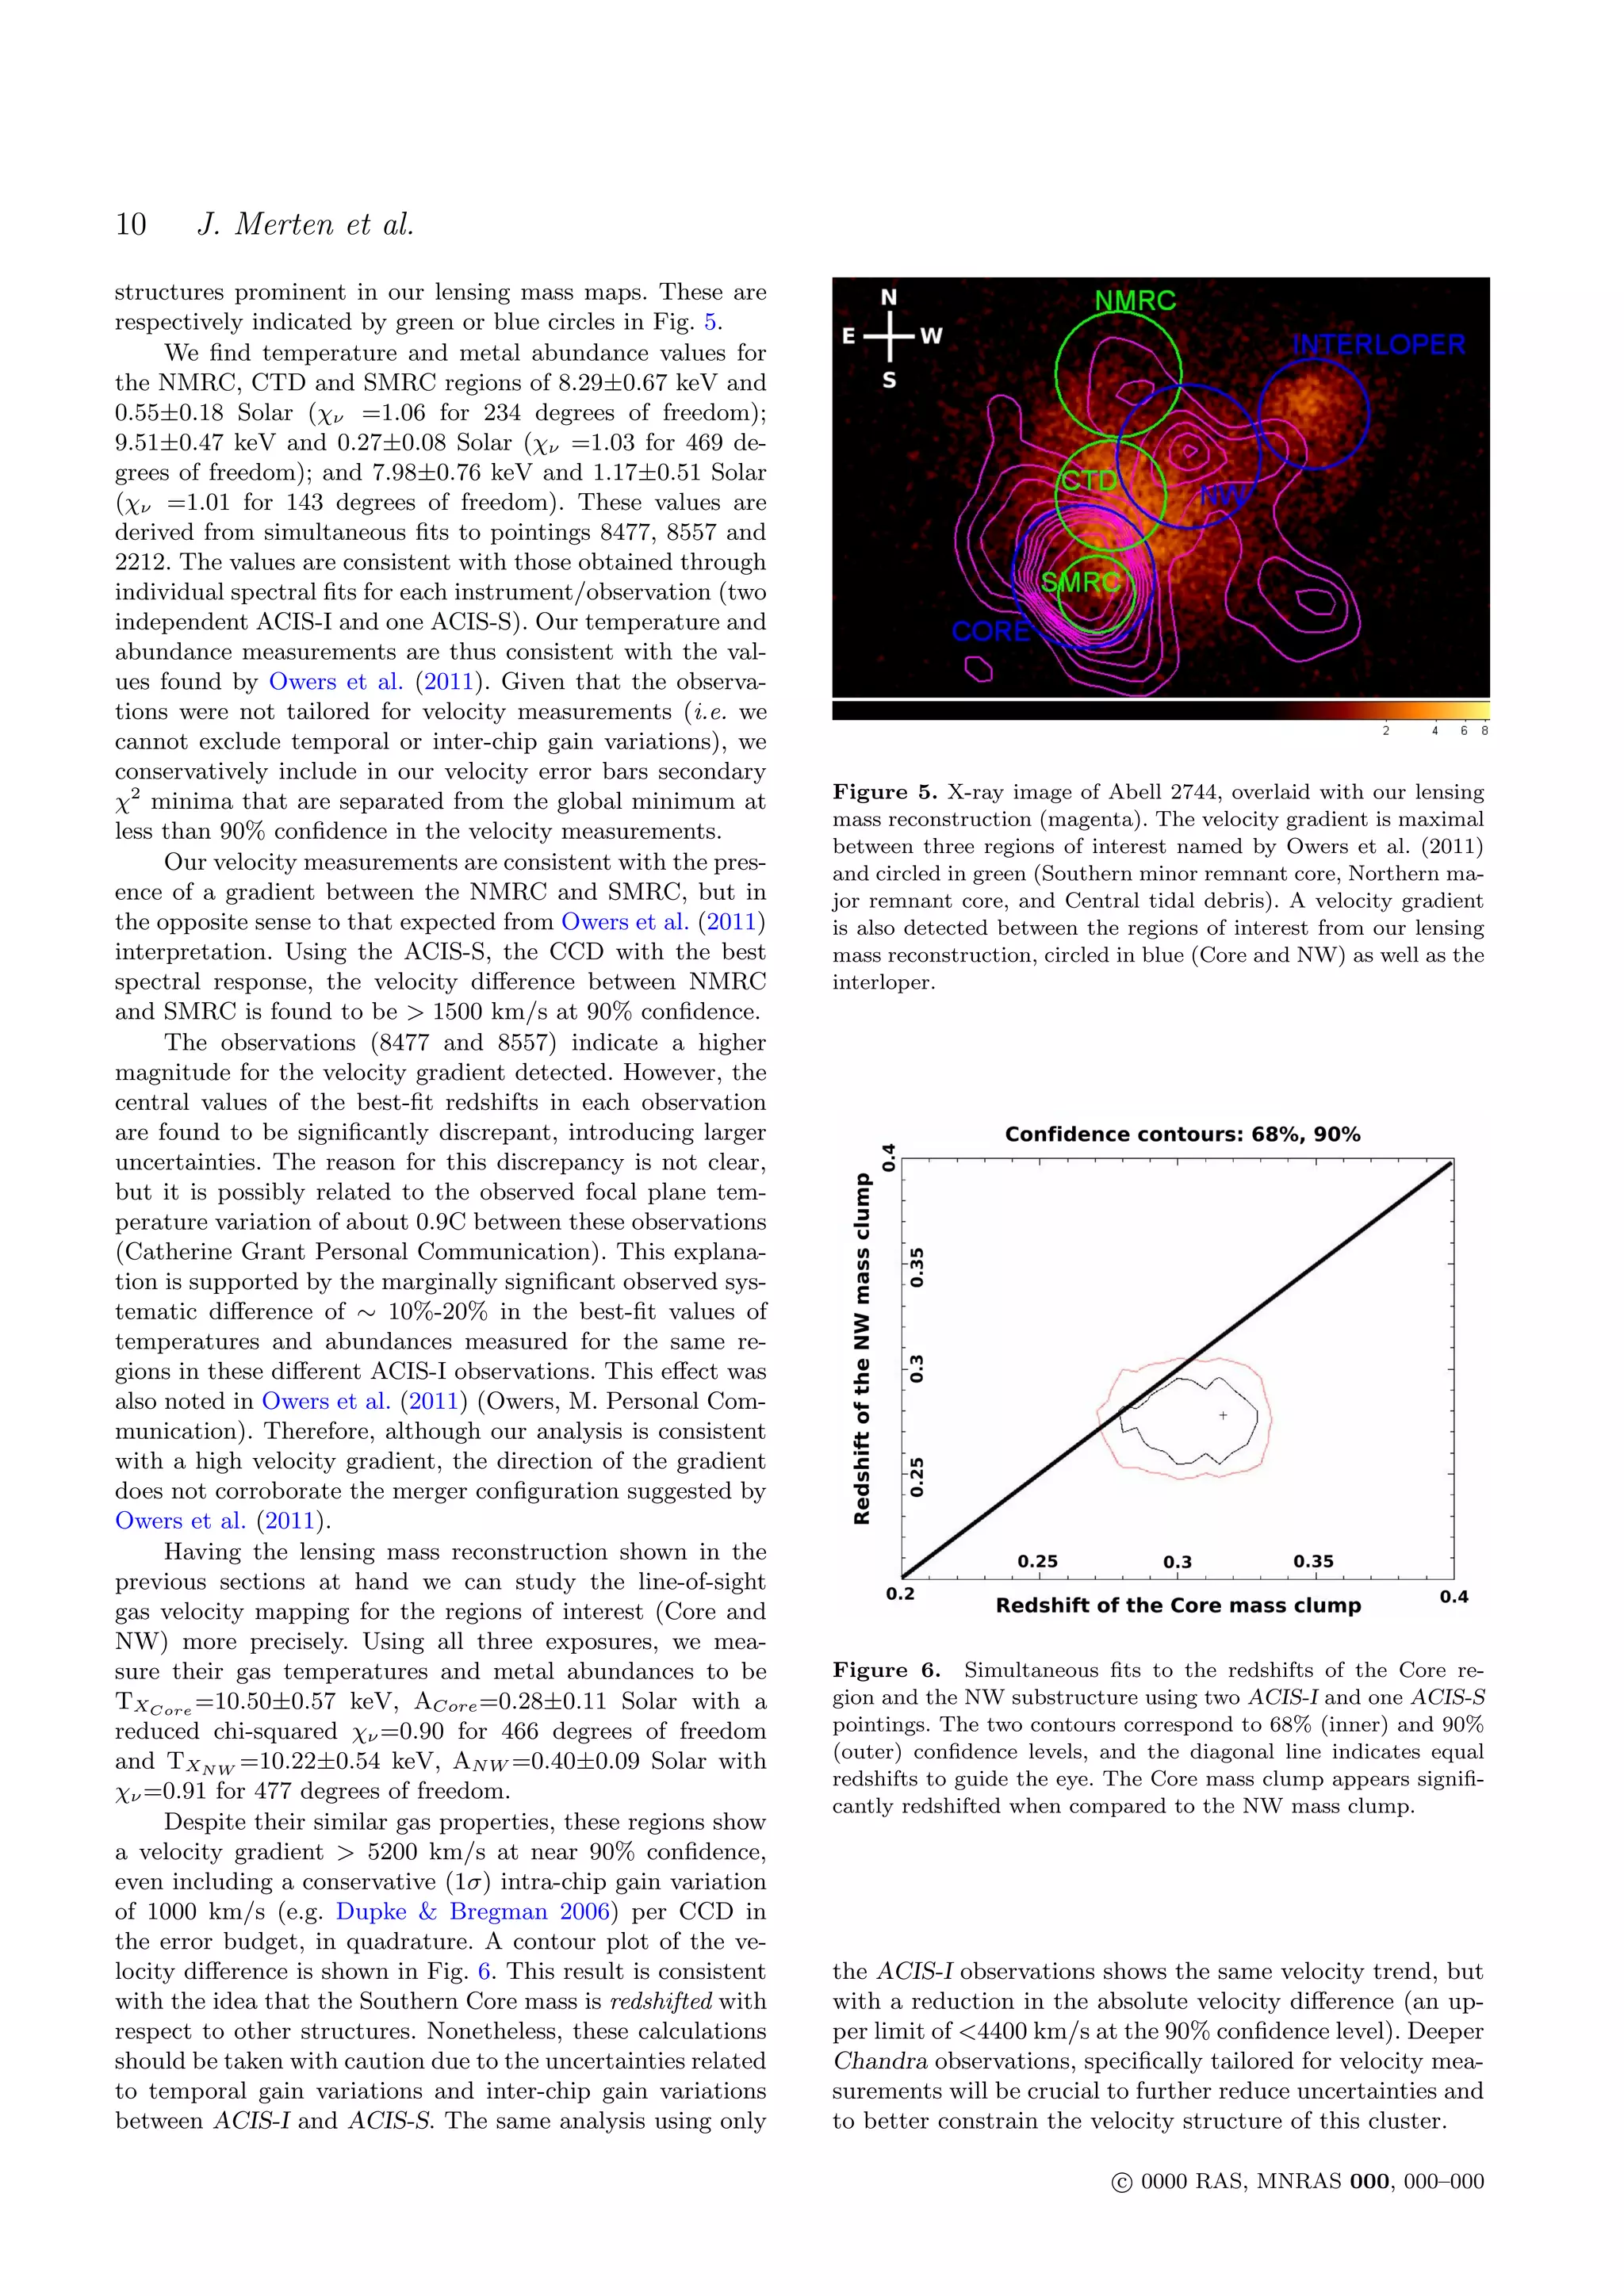

Abell 2744 is one of the most actively merging galaxy clusters known, appearing to have "dark", "ghost", "bullet", and "stripped" substructures of around 1014 solar masses each. The cluster shows a complex phenomenology that will challenge simulations to reproduce. The authors present a detailed strong lensing, weak lensing, and X-ray analysis of Abell 2744, identifying 34 strongly lensed images around the massive Southern core and producing the most detailed mass map to date. They find evidence that the Southern core and Northwestern substructure are post-merger systems similar to the Bullet Cluster viewed from an angle, and derive a new constraint on the self-interaction cross section of dark matter particles. They


