Download to read offline
![Accepted for Publication in ApJ
A Deep Chandra ACIS Study of NGC 4151. I. the X-ray
Morphology of the 3 kpc-diameter Circum-nuclear Region and
arXiv:1102.2661v1 [astro-ph.CO] 14 Feb 2011
Relation to the Cold ISM
Junfeng Wang1 , Giuseppina Fabbiano1 , Guido Risaliti1,2 , Martin Elvis1 , Margarita
Karovska1 , Andreas Zezas1,3 , Carole G. Mundell4 , Gaelle Dumas5 , and Eva Schinnerer5
juwang@cfa.harvard.edu
ABSTRACT
We report on the imaging analysis of ∼200 ks sub-arcsecond resolution Chan-
dra ACIS-S observations of the nearby Seyfert 1 galaxy NGC 4151. Bright,
structured soft X-ray emission is observed to extend from 30 pc to 1.3 kpc in the
south-west from the nucleus, much farther than seen in earlier X-ray studies. The
terminus of the north-eastern X-ray emission is spatially coincident with a CO
gas lane, where the outflow likely encounters dense gas in the host galactic disk.
X-ray emission is also detected outside the boundaries of the ionization cone,
which indicates that the gas there is not completely shielded from the nuclear
continuum, as would be the case for a molecular torus collimating the bicone. In
the central r < 200 pc region, the subpixel processing of the ACIS data recovers
the morphological details on scales of <30 pc (<0.5′′ ) first discovered in Chandra
HRC images.
The X-ray emission is more absorbed towards the boundaries of the ionization
cone, as well as perpendicular to the bicone along the direction of a putative torus
in NGC 4151. The innermost region where X-ray emission shows the highest
hardness ratio, is spatially coincident with the near-infrared resolved H2 emission
and dusty spirals we find in an HST V − H color image. The agreement between
1
Harvard-Smithsonian Center for Astrophysics, 60 Garden St, Cambridge, MA 02138
2
INAF-Arcetri Observatory, Largo E, Fermi 5, I-50125 Firenze, Italy
3
Physics Department, University of Crete, P.O. Box 2208, GR-710 03, Heraklion, Crete, Greece
4
Astrophysics Research Institute, Liverpool John Moores University, Birkenhead CH41 1LD, UK
5
Max-Planck-Institut f¨ r Astronomie, K¨nigstuhl 17, D-69117 Heidelberg, Germany
u o](https://image.slidesharecdn.com/ngc415101-111228072706-phpapp02/85/Ngc4151-01-1-320.jpg)
![–2–
the observed H2 line flux and the value predicted from X-ray-irradiated molecular
cloud models supports photo-excitation by X-rays from the active nucleus as the
origin of the H2 line, although contribution from UV fluorescence or collisional
excitation cannot be fully ruled out with current data. The discrepancy between
the mass of cold molecular gas inferred from recent CO and near-infrared H2
observations may be explained by the anomalous CO abundance in this X-ray
dominated region. The total H2 mass derived from the X-ray observation agrees
with the measurement in Storchi-Bergmann et al. (2009).
Subject headings: X-rays: galaxies — galaxies: Seyfert — galaxies: ISM — ISM:
jets and outflows — galaxies: individual (NGC 4151)
1. Introduction
′
NGC 4151 (classified as (R )SAB(rs)ab; de Vaucouleurs et al. 1991), one of the nearest
(d ∼ 13.3 Mpc, 1′′ = 65 pc; Mundell et al. 1999), and apparently brightest, active galaxy
(Seyfert 1.5, Osterbrock & Koski 1976), has been extensively studied in almost all wave-
bands (see Ulrich 2000 for a review). Because of its proximity, NGC 4151 offers a unique
opportunity to examine the fueling of the central supermassive black hole (SMBH) and its
impact on the host galaxy.
NGC 4151 is close to face-on (inclination i ≈ 21◦ ) with a major axis position angle
(P.A.) ≈ 22◦ (Pedlar et al. 1992; Mundell et al. 1999). A biconical extended narrow line
region (ENLR) is elongated along the northeast (NE) and southwest (SW) of the active
galactic nucleus (AGN), at P.A. ∼65◦ and 230◦ , respectively (Perez et al. 1989; P´rez-e
Fournon & Wilson 1990; Penston et al. 1990; Evans et al. 1993). Clumpy ionized gas is
seen in Hubble Space Telescope (HST) narrow-band images (e.g., [OIII] λ5007˚, Boksenberg
A
et al. 1995; Winge et al. 1999) outflowing along the bicone (Schulz 1990; Crenshaw et al.
2000; Kaiser et al. 2000; Das et al. 2005), and extending to ∼1 kpc away from the AGN. The
morphology, kinematics, and line ratio diagnostics from optical studies of NGC 4151’s ENLR
(e.g., Robinson et al. 1994; Hutchings et al. 1998; Das et al. 2005) strongly support that
AGN radiation in the optical bicone intersects with the host galactic disk, and photoionizes
ambient galactic gas that is participating in normal galactic rotation (Pedlar et al. 1992;
Evans et al. 1993; Asif et al. 1998; Mundell et al. 1999).
Near-infrared (NIR) emission line mapping of the narrow line region (NLR) of NGC 4151
(e.g., Paβ; Storchi-Bergmann et al. 2009, 2010) shows that the ionized gas closely follows the
optical bicone, and extends outside the bicone (also found in the HST study by Kraemer et al.](https://image.slidesharecdn.com/ngc415101-111228072706-phpapp02/85/Ngc4151-01-2-320.jpg)
![–3–
2008). The molecular hydrogen (H2 ) emission distribution is perpendicular to the bicone axis
(Fernandez et al. 1999; Storchi-Bergmann et al. 2009), following approximately the P.A. of
a large scale (3.2′ × 2.5′ ) gas-rich stellar bar (∼130◦ ; Pedlar et al. 1992; Mundell et al. 1999).
Storchi-Bergmann et al. (2010) propose that H2 emission is potentially excited by X-rays
from the AGN or shocks related to the accretion flow along the large scale bar. A spatially
resolved study of the 12 CO emission (Dumas et al. 2010) finds two prominent CO gas lanes
at 1 kpc from the nucleus, but no cold molecular gas in the central 300 pc where the NIR H2
line emission peaks. Dumas et al. (2010) further suggest that the H2 line emission is likely
photo-excited by the AGN.
The ENLR of NGC 4151 has been resolved in the soft X-rays with Einstein and ROSAT
observations (Elvis, Briel, & Henry 1983; Morse et al. 1995). Early Chandra images show
that the extended soft X-ray emission is generally correlated with the optical forbidden line
emission (e.g., Ogle et al. 2000; Yang et al. 2001), whereas the nucleus remains unresolved in
the hard X-ray band. Our recent deep Chandra observations of NGC 4151 (PI: Fabbiano) on
the circum-nuclear region are now providing detailed information on several spatial scales.
The Chandra HRC image (Wang et al. 2009) resolves the nuclear X-ray emission on spatial
scales of ∼30 pc, finding evidence for interactions between the radio outflow and NLR clouds1 .
Our deep ACIS data have led to the discovery of a large scale soft diffuse X-ray emission
(Wang et al. 2010a) extending out to ∼2 kpc from the active nucleus and filling in the
cavity in the HI 21 cm emission distribution (Asif et al. 1998; Mundell & Shone 1999). This
extended X-ray emission could be due to either hot gas in the galactic disk heated by the
nuclear outflow or gas photoionized by an outburst of the AGN (Komossa 2001; Wang et al.
2010a).
This is the first of a series of papers where we report on the results from deep Chandra
ACIS observations of the circum-nuclear region in NGC 4151, focusing on the imaging anal-
ysis and relating the X-ray morphology to the cold interstellar medium (ISM) in the host
galactic disk. This paper is organized as follows. In § 2 we describe the observations and data
reduction; in § 3 we describe the imaging analysis and present the X-ray morphology. In § 4
we discuss the results, in particular the role of the X-ray emission in exciting the molecular
material near the AGN. We summarize our findings in § 5. In a forthcoming paper (Wang et
al. in preparation; Paper II), we will present the X-ray emission line strength maps, detailed
comparison of these maps with the ionized gas distribution using Hα and [OIII] images, and
spatially resolved spectral fitting with self-consistent photoionization models.
1
For a comprehensive view of the NGC 4151 nuclear structure, see Mundell et al. (2003).](https://image.slidesharecdn.com/ngc415101-111228072706-phpapp02/85/Ngc4151-01-3-320.jpg)


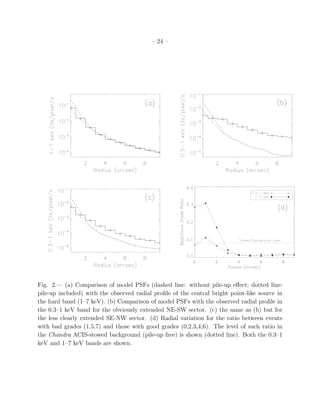
![–8–
of ∼35% encountered in this observation, there is ∼40% decrease in brightness in the core of
the PSF, but little distortion of its circular shape (Gaetz et al., private communication; see
the Chandra Proposers’ Observatory Guide [POG]10 Section 6.15.). Thus, although we will
discuss the images of extended features in the central 2′′ region that are affected by pile-up
with caution, deviations from circular shape must be related to real X-ray emission features.
3.3. ACIS Images with Subpixel Binning
Chandra HRMA’s PSF (half-power diameter HPD=0.6′′ , E ≤ 1.5 keV; see the Chandra
POG) is undersampled by the ACIS CCD pixels (0.492′′ × 0.492′′ ). To take advantage of the
telescope dithering11 to improve the sampling, a fine pixel size (0.0625′′, ∼1/8 of the native
ACIS pixel size) was used when extracting the images. This subpixel binning approach is
frequently adopted in imaging studies of X-ray jets pushing for the highest spatial resolution
(e.g., Harris et al. 2004; Siemiginowska et al. 2007; Perlman et al. 2010). In this section we
will also make use of the 50 ks Chandra observation of NGC 4151 with the High Resolution
Camera (HRC; Murray et al. 1997) presented in Wang et al. (2009).
Figure 3 compares the 0.3–1 keV subpixel ACIS and HRC (Wang et al. 2009) images both
smoothed with a F W HM = 0.4′′ gaussian kernel. Although the raw soft band ACIS image
(Figure 2a) already shows the presence of extended emission along the NE–SW direction
and hints of split emission in both NE and SW cones, the subpixel processed ACIS image
of Figure 3a reveals more morphological details, especially the presence of several X-ray
blobs (marked as “A”, “B”, “C”, and “D” in Figure 3) and the clear bifurcation of both
the NE and SW cones. The appearance of the NE–SW soft X-ray emission is an elongated
“X”-shape with an acute apex angle, resembling edge-brightened cones (c.f. Figure 1a). We
have measured the P.A. of the brighter bifurcated SW X-ray emission: the edges are located
at 227◦ ± 8◦ and 245◦ ± 5◦ , with a full opening angle of ∼ 20◦ . The HRC image shows
the identical extended morphology for the circum-nuclear region (Figure 3b), validating that
subpixel repositioning does not introduce unwanted artifacts.
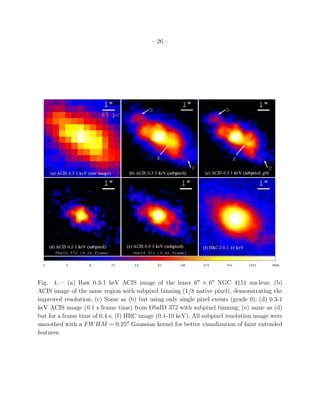
Figures 4a and b zoom in on the inner ∼ 6′′ × 6′′ (390 pc×390 pc) nuclear region, with
and without subpixel resolution. The X-ray emission on scales of 200 pc (≈ 3′′ ) is clearly
extended along the NE-SW direction. This extent is in good agreement with the overall
morphology of the [OIII] emission (e.g. Kaiser et al. 2000; Wang et al. 2009). The ACIS
10
Available at http://cxc.harvard.edu/proposer/POG/
11
see POG Version 12 § 5.8.2, page 75 (2009).](https://image.slidesharecdn.com/ngc415101-111228072706-phpapp02/85/Ngc4151-01-8-320.jpg)
![–9–
images with subpixel binning (e.g., Figures 3a and 4b) reveal curvy extensions 2′′ away from
the nucleus (labelled as “C” and “D”), which are not discernable in the raw soft ACIS image
(Figure 4a).
The subpixel ACIS image also shows a linear feature at P.A.=235◦ (labelled as “E” in
Figure 4b) and discrete knots in the inner region (on scales <1′′ from the nucleus). The soft
X-ray morphology is similar to that of the NLR clouds seen in HST optical images of NGC
4151 (e.g., Evans et al. 1993, Winge et al. 1999; see Wang et al. 2009 for a Chandra/HRC
and HST/WFPC2 image comparison). Corresponding outer clouds were previously detected
in deep HST images (Hutchings et al. 1998; Kaiser et al. 2000). Comparison of these features
to the [OIII] emission line clouds and radio outflows (e.g., Pedlar et al. 1992; Mundell et al.
2003), and emission modeling will be presented in Paper II.
We emphasize that although the inner 2′′ region is affected by pile-up (§ 3.2) in the 0.3–1
keV band, the ACIS features seen in the soft X-ray emission are not observation specific or
pile-up artifacts, for the following reasons:
1. For the on-axis nucleus, the PSF with pile-up simulated with MARX is circular, thus
the elongated features (4′′ across) seen in the soft band cannot be due to pile-up related
PSF distortion;
2. Using only the single pixel events (grade 0), which give the best spatial resolution and
are likely to be unaffected by pileup (Ballet 1999; Davis 2001), the extended features
are clearly present (Figure 4c);
3. Low pile-up ACIS images from Chandra archival observations of NGC 4151 (ObsID
372) show structures of similar shape and spatial scale as the features seen in our
images (Figures 4d and e). Because of the short frame time (0.1 s and 0.4 s) and
a factor of two lower nuclear flux, the estimated pile-up fraction is 6% and 11% in
these observations, respectively (Yang et al. 2001; Gonz´lez-Mart´ 2008). We also
a ın
examined the HETG zero-order images of NGC 4151. Although some suffer significant
pile-up due to longer frame time and a brightened nucleus (ObsID 7830), extended
emission along NE–SW with similar substructures as we detect is seen in ObsIDs 335
and 7829;
4. The PSF-deconvolved HRC image (Figure 2 in Wang et al. 2009), which is not affected
by pile-up, shows the same extended morphology and small-scale enhancements within
2′′ from the nucleus that are not seen in ACIS without subpixel binning.
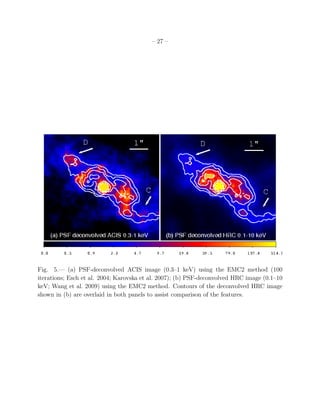
We applied two image reconstruction techniques to the ACIS data, the Richardson-Lucy
(R-L) algorithm (Richardson 1972; Lucy 1974) and the Expectation through Markov Chain](https://image.slidesharecdn.com/ngc415101-111228072706-phpapp02/85/Ngc4151-01-9-320.jpg)


![– 12 –
found in the NLR (Storchi-Bergmann et al. 2009) and the E(B − V ) = 0.5 − 1.0 found in
the V − H map. Mundell et al. (1995) find an HI absorption column density of 3.9 × 10²¹
cm−2 towards the radio nucleus; the factor ∼15 higher X-ray NH suggests that most of the
intervening hydrogen is in the form of H2 or high abundances ∼ 15Z/Z⊙.
4. Discussion
4.1. Extended X-ray Morphology
This is the first time such a high sensitivity high resolution X-ray spectral imaging
of the NGC 4151 nuclear region has been obtained. The HRC image provides no spectral
information, and previous ACIS images (Ogle et al. 2000; Yang et al. 2001) either lack
sensitivity to convincingly identify the X-ray features seen in subpixel resolution, or suffer
from heavy pile-up in the inner 3′′ .
The morphological features of the X-ray emission of NGC 4151 are summarized as
follows: (1) By pushing the spatial resolution of the ACIS image with subpixel resolution
techniques, X-ray enhancements in the innermost nuclear region (r 1′′ ) seen in the PSF-
deconvolved HRC image are recovered; (2) The extended soft X-ray emission shows the same
biconical morphology as the optical ENLR out to a radius (20′′ ; ∼1.3 kpc) larger than seen
in earlier X-ray studies (c.f. 14′′ ; ∼900 pc, Yang et al. 2001); (3) There is also firm detection
of extended X-ray emission at angles beyond the boundaries of the optical ENLR ionization
cone; (4) The observed X-ray emission is more absorbed towards the edge of the cone and
perpendicular to the cone axis at the apex of the cone.
The two-sided, bifurcated X-ray emission morphology is consistent with the model de-
scribed in Das et al. (2005) and Storchi-Bergmann et al. (2010), in which clouds are outflow-
ing along the walls of a hollow bicone inclined 45◦ to the line of sight. One side of the cone
is expected to exit the plane at 21◦ , intersecting an elongated area of the host galactic disk.
The projected appearance (c.f. Figure 9 in Storchi-Bergmann et al. 2010) closely resembles
the observed morphology here.
The extended X-ray emission seen perpendicular to the ENLR, along the NW-SE direc-
tion, was first suggested to be “unresolved or marginally resolved” in Yang et al. (2001). The
definitive resolved emission at angles beyond the edges of the bicone (Figure 2c) indicates
that the gas there is not completely shielded from the continuum, as would be the case for
a molecular torus collimating the bicone. This agrees well with the detection of significant
optical emission outside the emission-line bicone in the HST [OIII] and [OII] images, where
Kraemer et al. (2008) were able to model the emission lines with a weaker ionizing con-](https://image.slidesharecdn.com/ngc415101-111228072706-phpapp02/85/Ngc4151-01-12-320.jpg)
![– 15 –
The X-rays from the AGN may also explain the non-detection of CO gas in contrast to
the 107 − 109 M⊙ molecular gas estimated by Storchi-Bergmann et al. (2010). Dumas et al.
(2010) showed that no CO gas was detected within the inner 300 pc of the active nucleus,
where strong H2 line emission arises. Using a standard Galactic CO-to-H2 conversion factor
of XCO = 2 × 1020 cm−2 (K km s−1 )−1 (Solomon & Barrett 1991), Dumas et al. (2010)
derived a 1-σ upper limit of 105 M⊙ for the cold molecular gas mass. They suggested that
CO itself may not be a good tracer of molecular gas in X-ray dominated regions (XDR)
close to an active nucleus, where equilibrium molecular abundances are affected (Meijerink
& Spaans 2005, 2007).
Model 3 in Meijerink & Spaans (2005) calculated the CO/H2 abundance ratio for Fx =
1.6 erg cm−2 s−1 and n = 105.5 cm−3 (the model parameters most close to the flux and
density seen here), which is ≪ 10−4 at column densities below NH = 1023 cm−2 . For clouds
closer to the nucleus or immersed in diffuse X-ray emission, Fx can be higher, and a CO/H2
ratio of > 10−4 can only be found at column densities NH 1024 cm−2 (model 4 in Meijerink
& Spaans 2005). Given that the absorption column from the spectral fit is NH ∼ 6.5 × 10²²
cm−2 , the lack of CO perhaps can be explained by a low CO abundance relative to H2 in
the XDR.
Assuming that most intervening material is in the form of H2 , the X-ray derived NH =
6.5 ± 1.5 × 10²² indicates a total H2 mass of 2 × 10⁷ M⊙ in the 3′′ × 3′′ (200 pc diameter)
nuclear region imaged by Storchi-Bergmann et al. (2009). This value agrees well with the
lower end of total H2 mass (107 − 109 M⊙ ) in Storchi-Bergmann et al. (2009), which was
derived using the mass of “hot” H2 (240 M⊙ ) detected in the near-IR.
One clear prediction of the XDR scenario is that, like in shocks, the [OI] 63µm/[CII]
158µm ratio is higher ( 10) than generally found in PDRs (Maloney et al. 1996). This can
be tested with new observations using far-infrared (FIR) facilities such as PACS spectrometer
(Poglitsch et al. 2010) on board the Herschel Space Observatory (Pilbratt et al. 2010). NGC
4151 was observed as part of Herschel Key Program SHINING (PI: Sturm). They find that
the [O I] 63µm emission is highly concentrated on the central spaxel, while the [C II] 158µm
emission is more extended. The ratio of [O I] 63µm / [C II] 158µm in the central spaxel is
high, ∼11 (E. Sturm, private communication), consistent with XDR or shock models with
an effective ionization parameter of log ξeff ∼ −3 (Figure 12 in Maloney et al. 1996). We
note that this value is higher than log ξeff = −3.7 in the XDR model analysis above using
the observed X-ray flux and column density. This discrepancy might be attributed to more
than one mechanism at work exciting the H2 emission. Similar [OI]/[CII] ratios of ∼10 have
been reported in dense PDRs with no significant X-ray excitation, for example in regions
near the ionizing stars of the Orion Nebula (Boreiko & Betz 1996).](https://image.slidesharecdn.com/ngc415101-111228072706-phpapp02/85/Ngc4151-01-15-320.jpg)


![– 31 –
5×10⁻³
0.01
Counts sec−1 keV−1
Counts sec−1 keV−1
2×10⁻³
10−3 10−3
(a) R1 (Cone Center) 5×10⁻⁴ (b) R2 (Cone Edge)
10 −4
2 2
0 1
0
χ
χ
−2
−1
−4
−2
0.5 1 2 5 0.5 1 2 5
Energy [keV] Energy [keV]
0.01
Counts sec−1 keV−1
5×10⁻³
2×10⁻³
(c) R3 (Perpendicular to the cone)
10−3
2
0
χ
−2
0.5 1 2 5
Energy [keV]
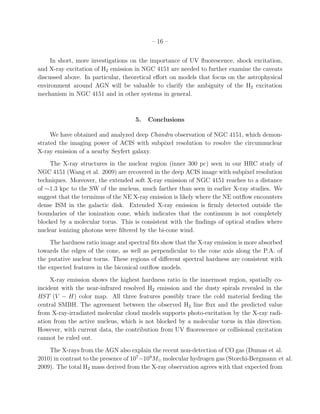
Fig. 9.— The X-ray spectra and fits obtained for three regions defined in Figure 9 that are
morphologically distinct (see text and Table 2).](https://image.slidesharecdn.com/ngc415101-111228072706-phpapp02/85/Ngc4151-01-31-320.jpg)

![Table 2. Spectral Fits to Extended X-ray Emission Features
Regiona HRb NH Temperature PSF fractionc χ2 / d.o.f.
[×1022cm−2 ] [keV] [%]
R1 −0.63+0.01
−0.02 0.02d 0.28+0.02
−0.01 0.5 135/94
R2 −0.27 ± 0.03 0.70+0.45
−0.54 0.08+0.09
−0.05 0.7 66/75
R3 −0.04 ± 0.02 6.5±1.5 1.94+0.48
−0.51 2.2 261/231
a The regions and spectra are presented in Figure 9. R1–the central inner part of the
cone; R2–the edges of the cone; and R3–the high hardness ratio region perpendicular to
the bicone-axis.
b Hardness ratio is defined as (C1−2keV − C0.3−1keV )/(C1−2keV + C0.3−1keV ).
c The fraction of nuclear emission contributed to the extended emission.
d Absorption fixed at Galactic column as required by the fit.](https://image.slidesharecdn.com/ngc415101-111228072706-phpapp02/85/Ngc4151-01-33-320.jpg)

This study uses deep Chandra observations to examine the X-ray morphology of the circum-nuclear region of NGC 4151 on spatial scales down to 30 pc. Extended soft X-ray emission is detected out to 1.3 kpc from the nucleus, farther than seen in previous studies. The X-ray emission is more absorbed towards the boundaries of the ionization cone and perpendicular to the bicone, suggesting absorption by a torus. The innermost X-ray emission, coincident with H2 emission and dusty spirals, supports X-ray excitation of molecular gas. The extended X-ray emission may be due to hot gas heated by the AGN outflow or photoionized by past AGN activity.


