The Business Café Survey Report
•
2 likes•1,393 views

The document summarizes the results of a market research survey of micro-businesses in the Farnham area. It finds that most micro-businesses are sole proprietorships or have fewer than 4 employees and work from home or in multiple locations. These micro-businesses make good use of coffee shops, spending an average of £5-10 per week, and prefer sitting over takeaway. The businesses are highly engaged with technology, having websites and using social media, though many want access to more digital skills training. An overwhelming majority expressed interest in a "Business Café" that would provide workspace and services for local micro-businesses.

Recommended
Recommended
More Related Content
What's hot
What's hot (20)
Viewers also liked
Similar to The Business Café Survey Report
Similar to The Business Café Survey Report (20)
More from Penny Power
More from Penny Power (20)
The Business Café Survey Report
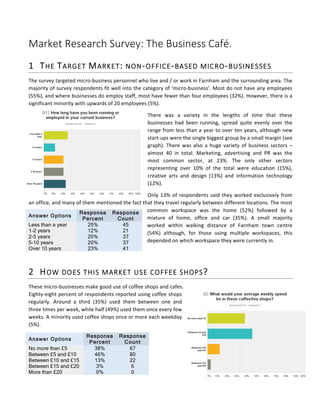
- 1. Market Research Survey: The Business Café. 1 THE TARGET MARKET: NON-‐OFFICE-‐BASED MICRO-‐BUSINESSES The survey targeted micro-‐business personnel who live and / or work in Farnham and the surrounding area. The majority of survey respondents fit well into the category of ‘micro-‐business’. Most do not have any employees (55%), and where businesses do employ staff, most have fewer than four employees (32%). However, there is a significant minority with upwards of 20 employees (5%). There was a variety in the lengths of time that these businesses had been running, spread quite evenly over the range from less than a year to over ten years, although new start-‐ups were the single biggest group by a small margin (see graph). There was also a huge variety of business sectors – almost 40 in total. Marketing, advertising and PR was the most common sector, at 23%. The only other sectors representing over 10% of the total were education (15%), creative arts and design (13%) and information technology (12%). Only 13% of respondents said they worked exclusively from an office, and many of them mentioned the fact that they travel regularly between different locations. The most common workspace was the home (52%) followed by a mixture of home, office and car (35%). A small majority worked within walking distance of Farnham town centre (54%) although, for those using multiple workspaces, this depended on which workspace they were currently in. 2 HOW DOES THIS MARKET USE COFFEE SHOPS? These micro-‐businesses make good use of coffee shops and cafes. Eighty-‐eight percent of respondents reported using coffee shops regularly. Around a third (35%) used them between one and three times per week, while half (49%) used them once every few weeks. A minority used coffee shops once or more each weekday (5%). Answer Options Response Percent Response Count No more than £5 38% 67 Between £5 and £10 46% 80 Between £10 and £15 13% 22 Between £15 and £20 3% 6 More than £20 0% 0 Answer Options Response Percent Response Count Less than a year 25% 45 1-2 years 12% 21 2-5 years 20% 37 5-10 years 20% 37 Over 10 years 23% 41
- 2. The most common spend was £5-‐10 per week (46%), with another 38% spending up to £5 (see graph). A minority (16%) spent between £10 and £20 on coffee shops per week, with one respondent noting that their spend can increase to £10 per day when they are travelling. Some respondents mentioned specifically that they use coffee shops for business meetings. In line with this, the survey showed that the vast majority of respondents using coffee shops prefer to sit in rather than take away (86% compared to 14%), although 16% commented that they use both sit-‐in and takeaway services depending on circumstances. 3 HOW TECH-‐SAVVY IS THIS MARKET? These micro-‐businesses are already engaging with technology. Eighty-‐two percent of respondents have their own website, and 94% are engaged in social media. Facebook was the most commonly used form of social media (81%), followed by Twitter (68%) and Linked In (56%), but 47% of respondents use all three. Of those who are not currently using social media, 91% would like to. Despite a relatively high level of information technology ability, this market is keen to improve and add to their skills: eighty-‐one percent would like to have access to more digital skills. However, according to participants’ comments, the level of help and information would have to pitched carefully; most are beyond basic-‐level skills and would require help only with higher-‐level and business-‐specific digital skills. 4 DOES THIS MARKET WANT A BUSINESS CAFÉ? An overwhelming majority (88%) said they would like to have a Business Café in their local area. A further 6% said “maybe” or that they did not know, with a number of these explaining that they did not yet understand what a Business Café is. Forty-‐six percent of respondents expected to visit the Business Café once every two weeks, with a further 42% expecting to visit once or twice per week (see graph). The majority (61%) do not pay a membership fee to a business community, nor would they be willing to. However, over a quarter of respondents (27%) already do, and a further 12% would be willing to. Answer Options Response Percent Response Count Never, it's not my thing 8% 13 Once every couple of weeks 46% 76 Once a week 24% 40 Twice a week 18% 29
- 3. A small majority of respondents (56%) would be happy to take part in a focus group to direct the Business Café concept, even if they were not paid. Another 4% would take part if they were paid, and a further 4% might take part depending on circumstances. We received unique email addresses for future contact from 134 people. 5 SUMMARY This is a client group for whom a flexible workspace away from home is very attractive, given their lack of dedicated office space and their itinerant work life. They already use coffee shops for business, so a dedicated Business Café would represent a valuable upgrade of an already familiar and useful environment. Increasing digital skills is a priority for this market. Due to the ‘micro’ nature of their businesses, they are likely to be personally responsible for much of their IT and social media presence, meaning that they value the kind of specific, intermediate-‐ to high-‐level, business-‐orientated training and support that a Business Café can provide. Most days 4% 6