Downloaded 171 times
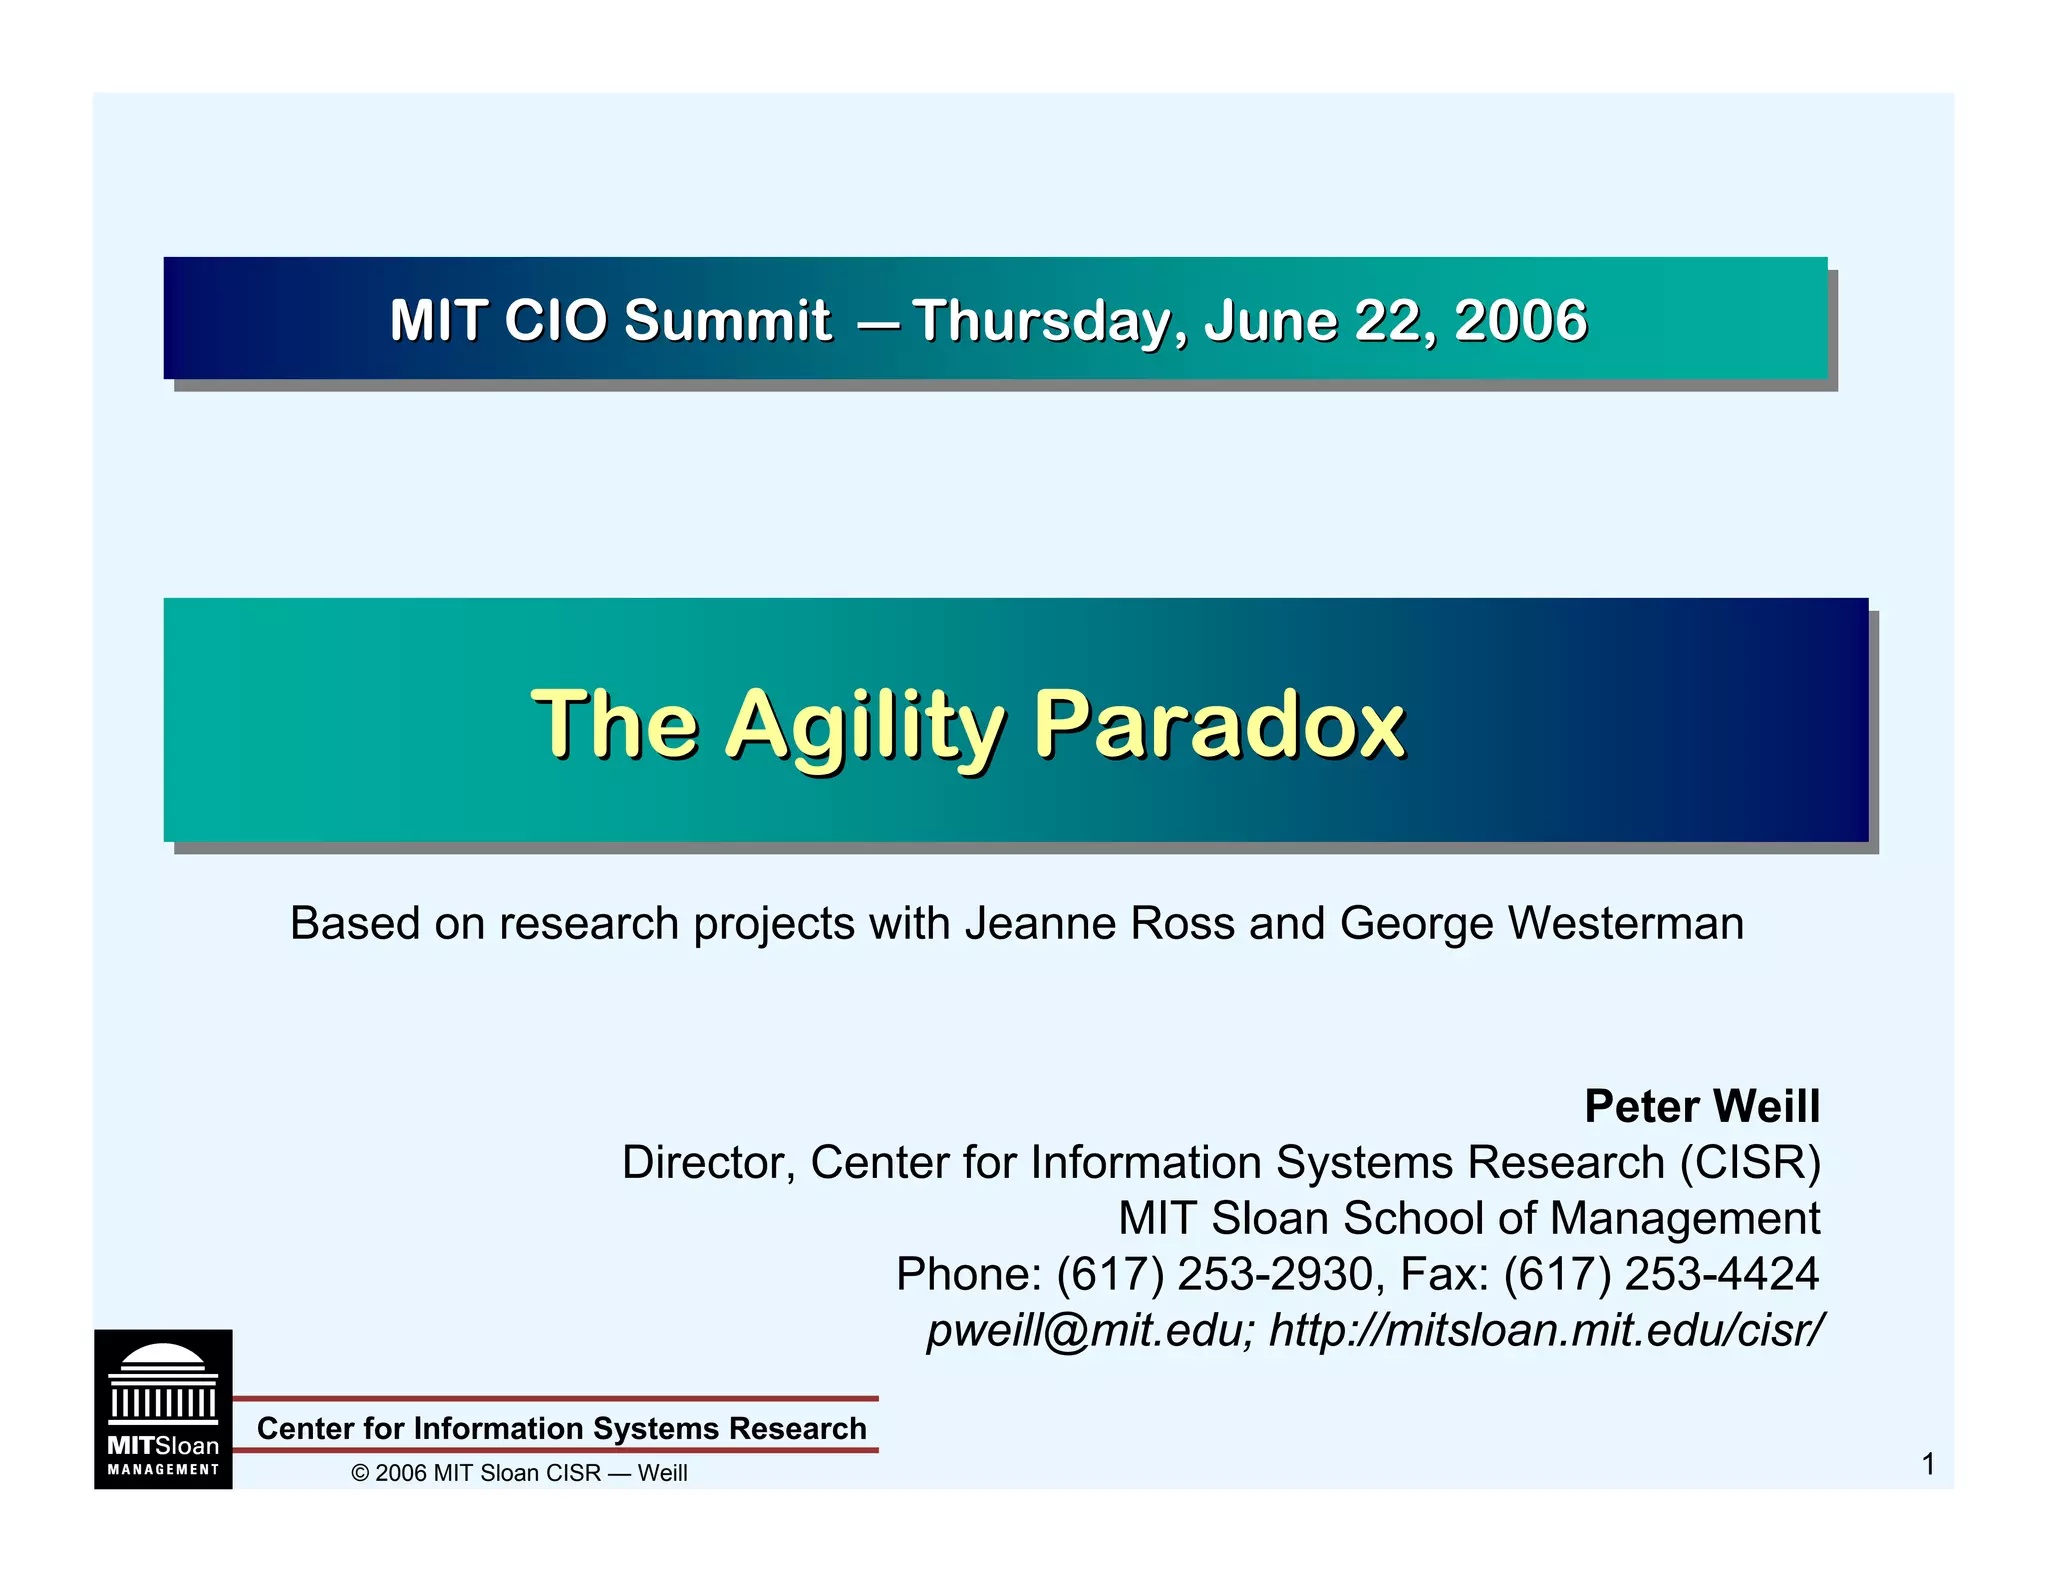
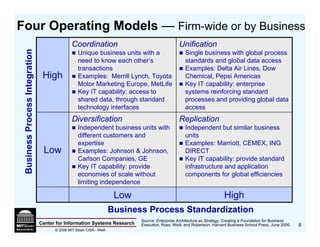
![Different Standardization Requirements
of the Four Operating Models
Coordination Unification
Business Process Integration
Technology Technology
Customer and Product Data Customer and Product Data
[Shared Services] Shared Services
High Core Processes such as
Operations, Customer
Service, Logistics [R&D,
Marketing/Sales]
Diversification Replication
Technology Technology
(Shared Services) Shared Services
Low Core Processes such as
Operations, Customer
Services, Logistics [R&D,
Marketing/Sales]
Low High
Business Process Standardization
Source: Enterprise Architecture as Strategy: Creating a Foundation for Business
Center for Information Systems Research Execution, Ross, Weill, and Robertson, Harvard Business School Press, June 2006.
10
© 2006 MIT Sloan CISR - Weill](https://image.slidesharecdn.com/weillslides-110527094132-phpapp01/85/The-Agility-Paradox-10-320.jpg)
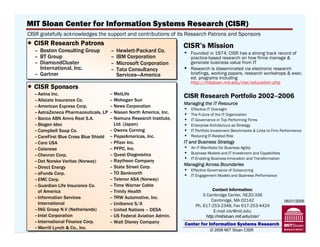
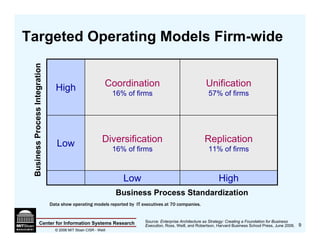
![IT Portfolios of Top Performers
with Different Strategies
Information
Strategic
Business Strategy and Top Performance
Transactional
Average Firm11
Average Firm Cost 22
Cost Balance Cost &
Balance Cost & Agile44
Agile
Infrastructure [n=337]
[n=337] [n=22]
[n=22] Agility33 [n=50]
Agility [n=50] [n=22]
[n=22]
18% 11%
IT Portfolio 17% 11% 17% 11%
15% 10%
Mix of 27%
24%
26% 24%
Investments 44%
46% 48% 51%
$IT compared to Average percent
Average percent 15% more than
15% more than 3% less than
3% less than
industry avg. as % of expenses industry average
Industry average
Industry average industry average
of expenses of expenses industry average industry average
1 All 337 US stock exchange listed firms in the sample of 640 3 Balanced: middle 50% on % of sales from modified products and top 50% on ROIC
2 Cost Focus: top 50% on ROIC and bottom 25% on % of 4 Agile: top 50% on revenue growth and top 25% on % sales from modified products.
sales from modified product.
Source: Analysis by MIT CISR (Weill and Johnson) using IT Investment (2003-5 average) and firm
performance (2003-4 average). IT Data: Collected from 640 firms using MIT CISR framework.
Center for Information Systems Research Performance data from Compustat. NSF Grant Number IIS-0085725 15
© 2006 MIT Sloan CISR - Weill](https://image.slidesharecdn.com/weillslides-110527094132-phpapp01/85/The-Agility-Paradox-15-320.jpg)
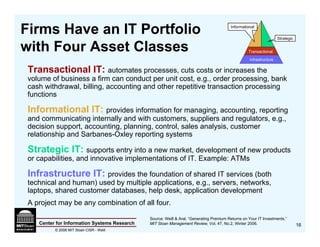
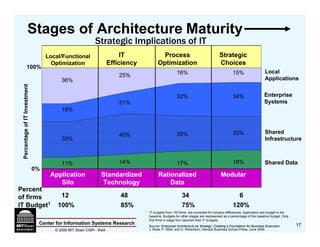

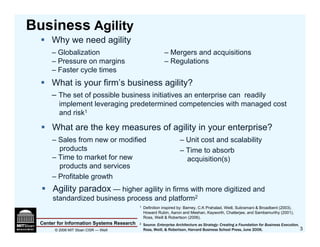
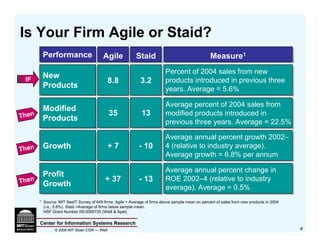
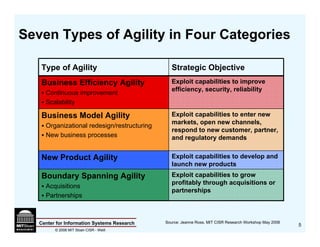
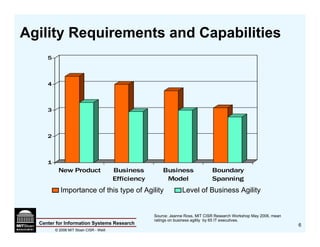
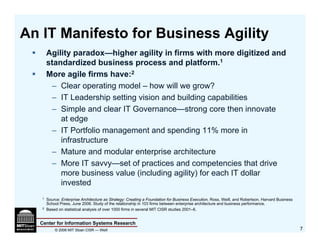
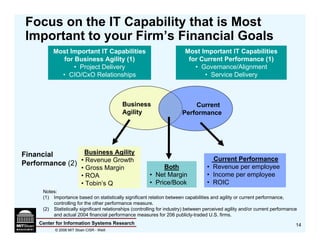
The MIT CIO Summit discusses the concept of business agility and its importance in the modern corporate environment, emphasizing globalization, mergers, and regulatory pressures that require firms to innovate rapidly. Research highlights an 'agility paradox' where firms with more digitized and standardized processes achieve higher agility, supported by effective IT governance and investment strategies. The document also outlines different types of agility and their strategic implications, alongside case studies demonstrating successful implementations.