Slide Title Content Visual Suggestion
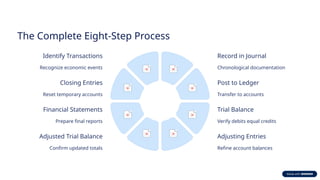
1 Intro: The Accounting Cycle “A step-by-step process of recording and reporting financial information.” Circular infographic with 8 steps as icons.
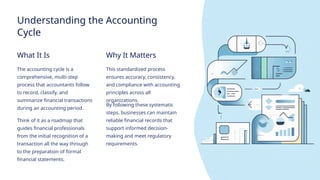
2 What is the Accounting Cycle? Definition + “Converts daily transactions into financial statements.” Image of a flow from Transactions ➜ Reports.
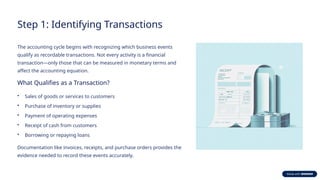
3 Step 1: Identifying Transactions Recognizing sales, purchases, and expenses. Icons: cash, receipt, document.
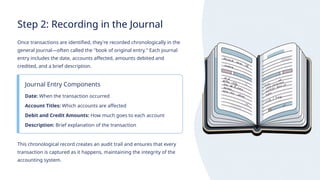
4 Step 2: Recording in Journal Chronological recording of transactions. Open ledger image or sample journal entry.
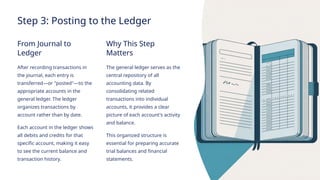
5 Step 3: Posting to Ledger Transferring entries from journal to ledger. Split screen: journal on left, ledger on right.
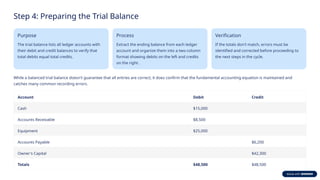
6 Step 4: Trial Balance Checking if debit = credit. Table with Debit & Credit columns.
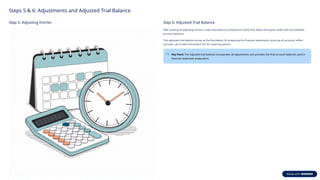
7 Step 5: Adjusting Entries Adjustments for accruals, depreciation, etc. Clock + calculator icons.
8 Step 6: Adjusted Trial Balance Updated balances after adjustments. Simple table with checkmark.
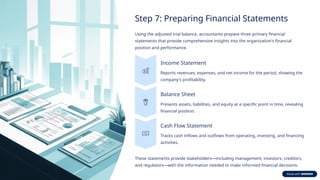
9 Step 7: Financial Statements Income Statement, Balance Sheet, Cash Flow. Report icons or charts.
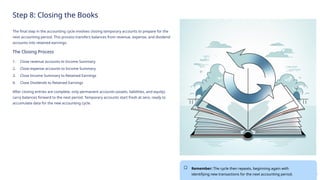
10 Step 8: Closing Entries Close temporary accounts for next period. Book closing