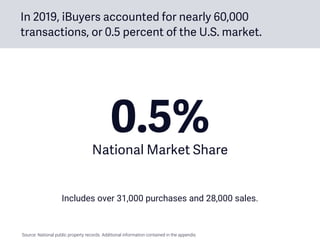
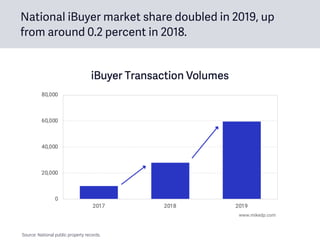
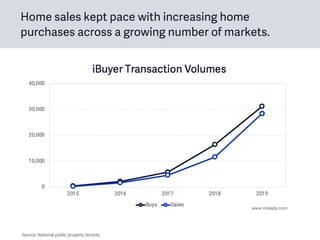
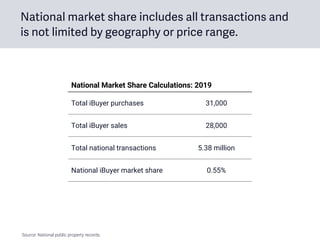
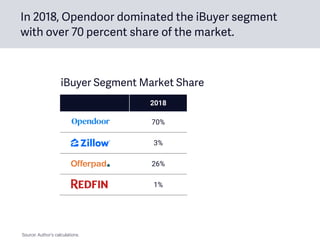
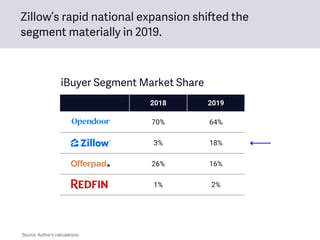
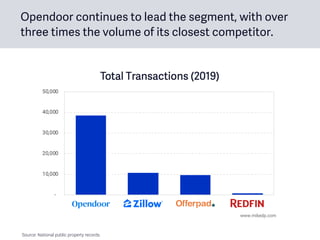
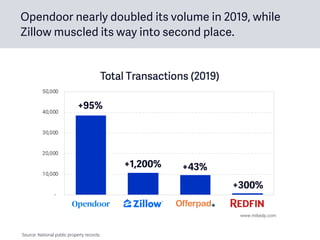
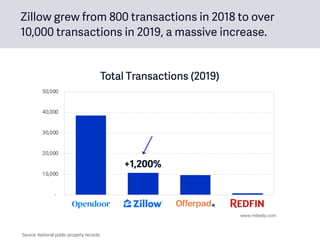
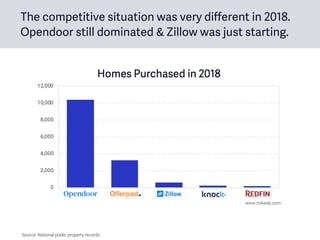
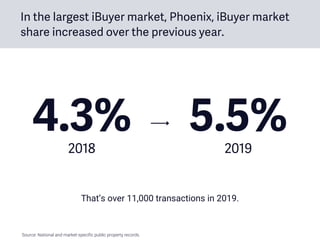
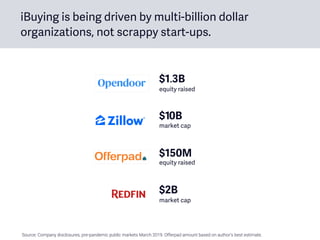
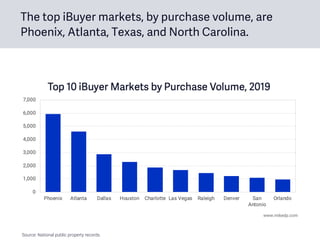
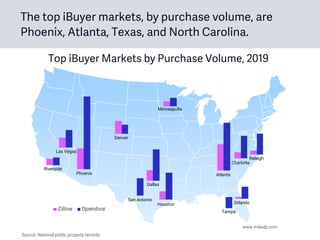
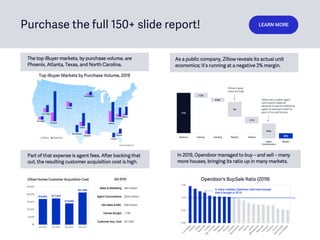
2 0 2 0
The 2020
iBuyer Report
Introducing The iBuyer Report
Since their emergence five years ago,
iBuyers – instant buyers – have been a
disruptive force in residential real estate.
The major iBuyers have doubled their
market share for the past two years.
While still a niche offering, the sector is
one of the fastest moving in an industry
notoriously slow to change.
I’ve been studying iBuyers for years:
conducting extensive research, talking
to the top players, and extracting
strategic insights. Let this report
calibrate our thinking on iBuyers and
the impact they are – and will – have
on the global real estate industry.
Mike DelPrete
May 2020
Table of Contents
1. Overview
2. Financials
3. iBuyer Markets
4. Market Expansion
5. Phoenix Deep Dive
6. Evolution to Zillow 2.0
7. Working with Agents
8. Offer Quality
9. iBuying in a Pandemic
10. Key Themes for 2020
Overview
iBuyers buy homes directly from consumers, turning
the traditional home selling process on its head.
The iBuyer movement is led by Opendoor, founded in
2014, and currently the world’s largest iBuyer.
• Opendoor buys homes directly from consumers, quickly
spruces them up, and resells them on the open market.
• By March 2019, Opendoor had raised over $1.3 billion in
equity, $3 billion in debt, and was valued at close to $4 billion.
• Opendoor offers a compelling customer proposition focused
on speed, certainty, and simplicity.
In 2019, iBuyers accounted for nearly 60,000
transactions, or 0.5 percent of the U.S. market.
0.5%National Market Share
Includes over 31,000 purchases and 28,000 sales.
Source: National public property records. Additional information contained in the appendix.
National iBuyer market share doubled in 2019, up
from around 0.2 percent in 2018.
Source: National public property records.
Home sales kept pace with increasing home
purchases across a growing number of markets.
Source: National public property records.
National market share includes all transactions and
is not limited by geography or price range.
Total iBuyer purchases 31,000
Total iBuyer sales 28,000
Total national transactions 5.38 million
National iBuyer market share 0.55%
National Market Share Calculations: 2019
Source: National public property records.
$8.1+ Billion
Value of Homes Purchased in 2019
With over 31,000 purchases at an average price of
$260,000, iBuyers bought $8.1+ billion of homes.
Source: National public property records.
In 2018, Opendoor dominated the iBuyer segment
with over 70 percent share of the market.
2018
Opendoor 70%
Zillow 3%
Offerpad 26%
Redfin 1%
iBuyer Segment Market Share
Source: Author’s calculations.
2018 2019
Opendoor 70% 64%
Zillow 3% 18%
Offerpad 26% 16%
Redfin 1% 2%
iBuyer Segment Market Share
Zillow’s rapid national expansion shifted the
segment materially in 2019.
Source: Author’s calculations.
Opendoor continues to lead the segment, with over
three times the volume of its closest competitor.
Source: National public property records.
+95%
+1,200% +43%
+300%
Opendoor nearly doubled its volume in 2019, while
Zillow muscled its way into second place.
Source: National public property records.
+1,200%
Zillow grew from 800 transactions in 2018 to over
10,000 transactions in 2019, a massive increase.
Source: National public property records.
The competitive situation was very different in 2018.
Opendoor still dominated & Zillow was just starting.
Source: National public property records.
In the largest iBuyer market, Phoenix, iBuyer market
share increased over the previous year.
5.5%2019
That’s over 11,000 transactions in 2019.
4.3%2018
Source: National and market-specific public property records.
Financials
iBuying is being driven by multi-billion dollar
organizations, not scrappy start-ups.
Source: Company disclosures, pre-pandemic public markets March 2019. Offerpad amount based on author’s best estimate.
$150M
equity raised
$10B
market cap
$1.3B
equity raised
$2B
market cap
iBuyers use debt to purchase homes. The amount
secured directly correlates to purchase activity.
Source: Company disclosures. Offerpad amount based on author’s estimate.
Opendoor has raised nearly 10 times the amount of
equity funding than its closest competitor.
Source: Company disclosures. Offerpad amount based on author’s estimate.
This is a key reason no new iBuyers launched in 2019; the cost
of entry is hundreds of millions of dollars.
The iBuyer business model works best at scale:
higher profits, less risk, and economies of scale.
Few markets
• Low profits and low revenues
(low margin)
• Market concentration risk in
single-market slowdowns
• Limited economies of scale
(tech, procurement, other)
• Per market advertising, one-
off and expensive
• Less volume, less favorable
financing terms
Many markets
• Higher profits and higher
revenues (low margin)
• Market diversification hedges
against single-market slowdown
• Ecosystem economies of scale
(greater buying power)
• National brand marketing
economies of scale
• More volume, more favorable
financing terms
iBuyers have two sources of revenue: service fees,
and the spread on the houses they buy and sell.
Revenue = Service fee + Price appreciation
The difference between
what an iBuyer buys and
subsequently sells a
house for.
The fee
charged to the
home seller.
1%–5%6%–10%
Note: These are gross revenue numbers, and don’t include costs. Percentages based on actual market data.
There are different ways to account for revenue
which include or exclude the full value of the home.
Gross revenue Includes the total home sale value as revenue.
Net revenue
Only includes the service fee and price appreciation
as revenue.
The top iBuyers operate high gross revenue
businesses, with very small profit margins.
Opendoor Offerpad Zillow
Total home sales 19,100 4,600 4,300
Gross revenue $5.1 billion $1.2 billion $1.4 billion
Net revenue $520 million $163 million $126 million
Net revenue per home $27,000 $36,000 $29,000
Net margin Anywhere from 0%–5% (2%)
Estimated Revenue Build-up: 2019
Note: Net revenue calculations based on 7% service fee and the average price appreciation and sold home price for each iBuyer. Net margin
based on author’s estimates, and Zillow’s public disclosures.
Offerpad’s higher net revenue per home is driven by
more favorable unit economics.
Opendoor Offerpad Zillow
Total home sales 19,100 4,600 4,300
Gross revenue $5.1 billion $1.2 billion $1.4 billion
Net revenue $520 million $163 million $126 million
Net revenue per home $27,000 $36,000 $29,000
Net margin Anywhere from 0%–5% (2%)
Estimated Revenue Build-up: 2019
Note: Net revenue calculations based on 7% service fee and the average price appreciation and sold home price for each iBuyer. Net margin
based on author’s estimates, and Zillow’s public disclosures.
Driven by a higher spread, or price
appreciation, on each home.
At its core, iBuying is a (very) low margin business.
• While consumers will pay for liquidity (ex: used car dealers),
there are considerable costs in the iBuyer business model.
• Profit margins are in the low single-digit percentages, if that.
• The biggest costs are agent fees (specifically iBuyers paying a
buyer’s agent fee), holding costs, and home repairs.
Unit economics vary by iBuyer, but they all face
similar costs in a low margin business.
Revenue
11%
1.25%
Source: Author’s estimates, plus public disclosures from Zillow.
Agent
Commissions
Closing Carrying Repairs Interest Margin
0.25%
0.8%
2%
3%
3.7%
Estimated iBuyer Unit Economics
Agent commissions remain an iBuyer’s largest
expense.
Revenue
11%
1.25%
Agent
Commissions
Closing Carrying Repairs Interest Margin
0.25%
2%
0.8%
3%
3.7%
Buyer’s agent commission
paid when a home is sold.
Source: Author’s estimates, company sources, plus public disclosures from Zillow.
One of the biggest variable costs is repairs and
renovation.
Revenue
11%
1.25%
Agent
Commissions
Closing Carrying Repairs Interest Margin
0.25%
2–5%
0.8%
3%
3.7%
Offerpad’s average repair
costs are around 4%, Zillow’s
are around 5%, and Opendoor’s
are between 2–2.5%.
Source: Author’s estimates, company sources, plus public disclosures from Zillow.
(2%)
As a public company, Zillow reveals its actual unit
economics; it’s running at a negative 2% margin.
Revenue
11%
1.2%
Agent
Commissions
Closing Carrying Repairs Interest
Margin
0.2%
5%
1.7%
4.8%
Zillow has a higher agent
commission expense
because it pays an additional
agent to represent itself on
each of its sold homes.
Source: Zillow’s Fourth Quarter 2019 Homes Unit Economics Exhibit from its Shareholder Letter.
Zillow’s repair
costs are high.
Future profitability will be driven by a number of
factors.
• Sheer scale. Small margins become more meaningful with big
volumes.
• Adjacent services like mortgage and title. Revenue and profit
projections are promising, but no one is doing it at scale.
• Fees. Opendoor would like to reduce its fees even further,
which is only possible by eliminating buyer agent
commissions or offering adjacent services.
• More competitive offers. A highly competitive environment
drives prices up and reduces the sale price spread.
iBuyer Markets
The iBuyers have a growing national presence,
clustered in around two dozen markets.
Denver
Phoenix
Atlanta
Dallas
Houston
Charlotte
Raleigh
Las Vegas
Orlando
Tampa
Minneapolis
San Diego
Austin
San Antonio
Miami
Jacksonville
Nashville
Tucson
Portland
Sacramento
Riverside
Los Angeles
Salt Lake City
Source: Zillow’s market data, April 2020, median home value.
The classic iBuyer markets all have median home
prices around $250,000 – the sweet spot.
$250k
Source: Zillow’s market data, April 2020, median home value.
Denver and Riverside, CA, are the outliers, with
significantly higher median home values.
There are a variety of factors that make up the ideal
iBuyer market.
Market Factor
• “Middle of the road” average
home price
• Turn-key houses with minimal
work required
• Homogenous housing stock
• High overall market activity
iBuyer Benefit
• Less time on the market to
resell
• Less renovation cost and less
holding time
• More predictable house prices
• Less time on the market to
resell
The top iBuyer markets, by purchase volume, are
Phoenix, Atlanta, Texas, and North Carolina.
Source: National public property records.
The top iBuyer markets, by purchase volume, are
Phoenix, Atlanta, Texas, and North Carolina.
Denver
Phoenix Atlanta
Dallas
Houston
Charlotte
Raleigh
San Antonio
Las Vegas
Orlando
Tampa
Minneapolis
Riverside
Top iBuyer Markets by Purchase Volume, 2019
www.mikedp.com
Source: National public property records.
Purchase the full 150+ slide report! LEARN MORE
• iBuyer Markets
• Market Expansion
• Phoenix Deep Dive
• Evolution to Zillow 2.0
• Working with Agents
• Offer Quality
• iBuying in a Pandemic
• Key Themes for 2020
Get the full picture – don’t miss the following sections:
I’m a global real estate tech strategist, and a
scholar-in-residence at the University of Colorado
Boulder. I’m a former tech entrepreneur, CEO, and
strategy director with broad expertise in online
real estate tech.
I’ve travelled the world talking to and working with
leading property portals and real estate tech
businesses, gathering first-hand knowledge and
insights on industry trends and themes. I advise
corporates, work with startups, mentor founders
and executives, and work on challenging
entrepreneurial projects.
About the author: Mike DelPrete
www.mikedp.com Mailing list mike@mikedp.com
I split my time between research & writing, teaching,
and working with select clients.
Start-up
Advisor
I’m leading the University’s new
Real Estate Tech program, one of
the world’s first.
www.curealestatetech.com
I’m a strategy and new ventures
consultant for businesses of all
sizes, with a focus on real estate
portals and disruptive models in real
estate tech. Learn more ⟶
I advise and invest in a select
group of real estate tech start-ups
and growth-stage businesses
around the world. Learn more ⟶
Strategy
Consultant
Appendix:
Data Accuracy
The data is based on tracking
over 60 different buying entities
used by the major iBuyers.
All data is within 1 percent of the
iBuyers’ official numbers.
(Which they have kindly shared to confirm accuracy.)
A note on data sources
The data sources include company reports, investor presentations, earnings
calls (and transcripts), public property records, MLS data, company web site
listing data, and public records sourced from various listing portals. All
information used is in the public domain. No confidential information has been
used in this report. Some data has been estimated from financial statements
and other known data points.
Aggregate market data provided by Attom Data Solutions.
Copyright © Mike DelPrete

The 2020 iBuyer Report (Preview)

  • 1.
    2 0 20 The 2020 iBuyer Report
  • 2.
    Introducing The iBuyerReport Since their emergence five years ago, iBuyers – instant buyers – have been a disruptive force in residential real estate. The major iBuyers have doubled their market share for the past two years. While still a niche offering, the sector is one of the fastest moving in an industry notoriously slow to change. I’ve been studying iBuyers for years: conducting extensive research, talking to the top players, and extracting strategic insights. Let this report calibrate our thinking on iBuyers and the impact they are – and will – have on the global real estate industry. Mike DelPrete May 2020
  • 3.
    Table of Contents 1.Overview 2. Financials 3. iBuyer Markets 4. Market Expansion 5. Phoenix Deep Dive 6. Evolution to Zillow 2.0 7. Working with Agents 8. Offer Quality 9. iBuying in a Pandemic 10. Key Themes for 2020
  • 4.
  • 5.
    iBuyers buy homesdirectly from consumers, turning the traditional home selling process on its head.
  • 6.
    The iBuyer movementis led by Opendoor, founded in 2014, and currently the world’s largest iBuyer. • Opendoor buys homes directly from consumers, quickly spruces them up, and resells them on the open market. • By March 2019, Opendoor had raised over $1.3 billion in equity, $3 billion in debt, and was valued at close to $4 billion. • Opendoor offers a compelling customer proposition focused on speed, certainty, and simplicity.
  • 7.
    In 2019, iBuyersaccounted for nearly 60,000 transactions, or 0.5 percent of the U.S. market. 0.5%National Market Share Includes over 31,000 purchases and 28,000 sales. Source: National public property records. Additional information contained in the appendix.
  • 8.
    National iBuyer marketshare doubled in 2019, up from around 0.2 percent in 2018. Source: National public property records.
  • 9.
    Home sales keptpace with increasing home purchases across a growing number of markets. Source: National public property records.
  • 10.
    National market shareincludes all transactions and is not limited by geography or price range. Total iBuyer purchases 31,000 Total iBuyer sales 28,000 Total national transactions 5.38 million National iBuyer market share 0.55% National Market Share Calculations: 2019 Source: National public property records.
  • 11.
    $8.1+ Billion Value ofHomes Purchased in 2019 With over 31,000 purchases at an average price of $260,000, iBuyers bought $8.1+ billion of homes. Source: National public property records.
  • 12.
    In 2018, Opendoordominated the iBuyer segment with over 70 percent share of the market. 2018 Opendoor 70% Zillow 3% Offerpad 26% Redfin 1% iBuyer Segment Market Share Source: Author’s calculations.
  • 13.
    2018 2019 Opendoor 70%64% Zillow 3% 18% Offerpad 26% 16% Redfin 1% 2% iBuyer Segment Market Share Zillow’s rapid national expansion shifted the segment materially in 2019. Source: Author’s calculations.
  • 14.
    Opendoor continues tolead the segment, with over three times the volume of its closest competitor. Source: National public property records.
  • 15.
    +95% +1,200% +43% +300% Opendoor nearlydoubled its volume in 2019, while Zillow muscled its way into second place. Source: National public property records.
  • 16.
    +1,200% Zillow grew from800 transactions in 2018 to over 10,000 transactions in 2019, a massive increase. Source: National public property records.
  • 17.
    The competitive situationwas very different in 2018. Opendoor still dominated & Zillow was just starting. Source: National public property records.
  • 18.
    In the largestiBuyer market, Phoenix, iBuyer market share increased over the previous year. 5.5%2019 That’s over 11,000 transactions in 2019. 4.3%2018 Source: National and market-specific public property records.
  • 19.
  • 20.
    iBuying is beingdriven by multi-billion dollar organizations, not scrappy start-ups. Source: Company disclosures, pre-pandemic public markets March 2019. Offerpad amount based on author’s best estimate. $150M equity raised $10B market cap $1.3B equity raised $2B market cap
  • 21.
    iBuyers use debtto purchase homes. The amount secured directly correlates to purchase activity. Source: Company disclosures. Offerpad amount based on author’s estimate.
  • 22.
    Opendoor has raisednearly 10 times the amount of equity funding than its closest competitor. Source: Company disclosures. Offerpad amount based on author’s estimate. This is a key reason no new iBuyers launched in 2019; the cost of entry is hundreds of millions of dollars.
  • 23.
    The iBuyer businessmodel works best at scale: higher profits, less risk, and economies of scale. Few markets • Low profits and low revenues (low margin) • Market concentration risk in single-market slowdowns • Limited economies of scale (tech, procurement, other) • Per market advertising, one- off and expensive • Less volume, less favorable financing terms Many markets • Higher profits and higher revenues (low margin) • Market diversification hedges against single-market slowdown • Ecosystem economies of scale (greater buying power) • National brand marketing economies of scale • More volume, more favorable financing terms
  • 24.
    iBuyers have twosources of revenue: service fees, and the spread on the houses they buy and sell. Revenue = Service fee + Price appreciation The difference between what an iBuyer buys and subsequently sells a house for. The fee charged to the home seller. 1%–5%6%–10% Note: These are gross revenue numbers, and don’t include costs. Percentages based on actual market data.
  • 25.
    There are differentways to account for revenue which include or exclude the full value of the home. Gross revenue Includes the total home sale value as revenue. Net revenue Only includes the service fee and price appreciation as revenue.
  • 26.
    The top iBuyersoperate high gross revenue businesses, with very small profit margins. Opendoor Offerpad Zillow Total home sales 19,100 4,600 4,300 Gross revenue $5.1 billion $1.2 billion $1.4 billion Net revenue $520 million $163 million $126 million Net revenue per home $27,000 $36,000 $29,000 Net margin Anywhere from 0%–5% (2%) Estimated Revenue Build-up: 2019 Note: Net revenue calculations based on 7% service fee and the average price appreciation and sold home price for each iBuyer. Net margin based on author’s estimates, and Zillow’s public disclosures.
  • 27.
    Offerpad’s higher netrevenue per home is driven by more favorable unit economics. Opendoor Offerpad Zillow Total home sales 19,100 4,600 4,300 Gross revenue $5.1 billion $1.2 billion $1.4 billion Net revenue $520 million $163 million $126 million Net revenue per home $27,000 $36,000 $29,000 Net margin Anywhere from 0%–5% (2%) Estimated Revenue Build-up: 2019 Note: Net revenue calculations based on 7% service fee and the average price appreciation and sold home price for each iBuyer. Net margin based on author’s estimates, and Zillow’s public disclosures. Driven by a higher spread, or price appreciation, on each home.
  • 28.
    At its core,iBuying is a (very) low margin business. • While consumers will pay for liquidity (ex: used car dealers), there are considerable costs in the iBuyer business model. • Profit margins are in the low single-digit percentages, if that. • The biggest costs are agent fees (specifically iBuyers paying a buyer’s agent fee), holding costs, and home repairs.
  • 29.
    Unit economics varyby iBuyer, but they all face similar costs in a low margin business. Revenue 11% 1.25% Source: Author’s estimates, plus public disclosures from Zillow. Agent Commissions Closing Carrying Repairs Interest Margin 0.25% 0.8% 2% 3% 3.7% Estimated iBuyer Unit Economics
  • 30.
    Agent commissions remainan iBuyer’s largest expense. Revenue 11% 1.25% Agent Commissions Closing Carrying Repairs Interest Margin 0.25% 2% 0.8% 3% 3.7% Buyer’s agent commission paid when a home is sold. Source: Author’s estimates, company sources, plus public disclosures from Zillow.
  • 31.
    One of thebiggest variable costs is repairs and renovation. Revenue 11% 1.25% Agent Commissions Closing Carrying Repairs Interest Margin 0.25% 2–5% 0.8% 3% 3.7% Offerpad’s average repair costs are around 4%, Zillow’s are around 5%, and Opendoor’s are between 2–2.5%. Source: Author’s estimates, company sources, plus public disclosures from Zillow.
  • 32.
    (2%) As a publiccompany, Zillow reveals its actual unit economics; it’s running at a negative 2% margin. Revenue 11% 1.2% Agent Commissions Closing Carrying Repairs Interest Margin 0.2% 5% 1.7% 4.8% Zillow has a higher agent commission expense because it pays an additional agent to represent itself on each of its sold homes. Source: Zillow’s Fourth Quarter 2019 Homes Unit Economics Exhibit from its Shareholder Letter. Zillow’s repair costs are high.
  • 33.
    Future profitability willbe driven by a number of factors. • Sheer scale. Small margins become more meaningful with big volumes. • Adjacent services like mortgage and title. Revenue and profit projections are promising, but no one is doing it at scale. • Fees. Opendoor would like to reduce its fees even further, which is only possible by eliminating buyer agent commissions or offering adjacent services. • More competitive offers. A highly competitive environment drives prices up and reduces the sale price spread.
  • 34.
  • 35.
    The iBuyers havea growing national presence, clustered in around two dozen markets. Denver Phoenix Atlanta Dallas Houston Charlotte Raleigh Las Vegas Orlando Tampa Minneapolis San Diego Austin San Antonio Miami Jacksonville Nashville Tucson Portland Sacramento Riverside Los Angeles Salt Lake City
  • 36.
    Source: Zillow’s marketdata, April 2020, median home value. The classic iBuyer markets all have median home prices around $250,000 – the sweet spot. $250k
  • 37.
    Source: Zillow’s marketdata, April 2020, median home value. Denver and Riverside, CA, are the outliers, with significantly higher median home values.
  • 38.
    There are avariety of factors that make up the ideal iBuyer market. Market Factor • “Middle of the road” average home price • Turn-key houses with minimal work required • Homogenous housing stock • High overall market activity iBuyer Benefit • Less time on the market to resell • Less renovation cost and less holding time • More predictable house prices • Less time on the market to resell
  • 39.
    The top iBuyermarkets, by purchase volume, are Phoenix, Atlanta, Texas, and North Carolina. Source: National public property records.
  • 40.
    The top iBuyermarkets, by purchase volume, are Phoenix, Atlanta, Texas, and North Carolina. Denver Phoenix Atlanta Dallas Houston Charlotte Raleigh San Antonio Las Vegas Orlando Tampa Minneapolis Riverside Top iBuyer Markets by Purchase Volume, 2019 www.mikedp.com Source: National public property records.
  • 41.
    Purchase the full150+ slide report! LEARN MORE
  • 42.
    Purchase the full150+ slide report! LEARN MORE • iBuyer Markets • Market Expansion • Phoenix Deep Dive • Evolution to Zillow 2.0 • Working with Agents • Offer Quality • iBuying in a Pandemic • Key Themes for 2020 Get the full picture – don’t miss the following sections:
  • 44.
    I’m a globalreal estate tech strategist, and a scholar-in-residence at the University of Colorado Boulder. I’m a former tech entrepreneur, CEO, and strategy director with broad expertise in online real estate tech. I’ve travelled the world talking to and working with leading property portals and real estate tech businesses, gathering first-hand knowledge and insights on industry trends and themes. I advise corporates, work with startups, mentor founders and executives, and work on challenging entrepreneurial projects. About the author: Mike DelPrete www.mikedp.com Mailing list mike@mikedp.com
  • 45.
    I split mytime between research & writing, teaching, and working with select clients. Start-up Advisor I’m leading the University’s new Real Estate Tech program, one of the world’s first. www.curealestatetech.com I’m a strategy and new ventures consultant for businesses of all sizes, with a focus on real estate portals and disruptive models in real estate tech. Learn more ⟶ I advise and invest in a select group of real estate tech start-ups and growth-stage businesses around the world. Learn more ⟶ Strategy Consultant
  • 46.
  • 47.
    The data isbased on tracking over 60 different buying entities used by the major iBuyers.
  • 48.
    All data iswithin 1 percent of the iBuyers’ official numbers. (Which they have kindly shared to confirm accuracy.)
  • 49.
    A note ondata sources The data sources include company reports, investor presentations, earnings calls (and transcripts), public property records, MLS data, company web site listing data, and public records sourced from various listing portals. All information used is in the public domain. No confidential information has been used in this report. Some data has been estimated from financial statements and other known data points. Aggregate market data provided by Attom Data Solutions.
  • 50.