
Download as PDF, PPTX


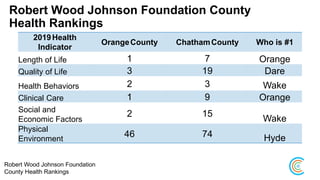
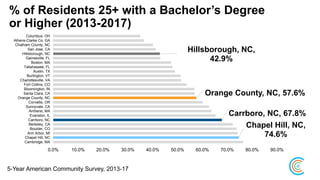
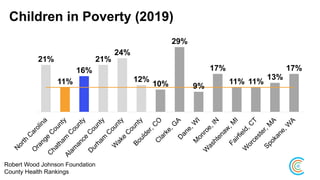
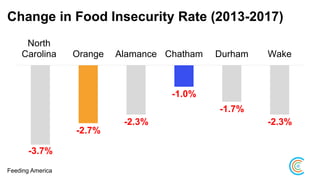
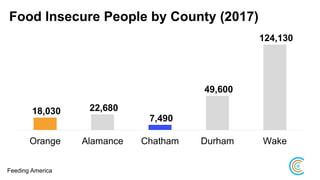
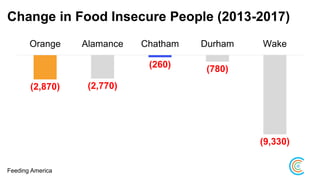
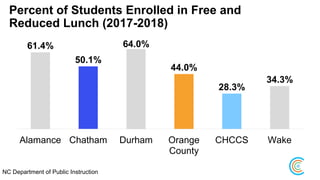

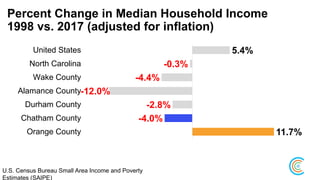


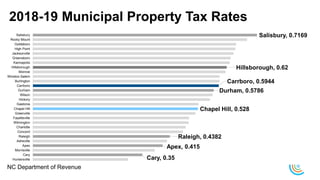
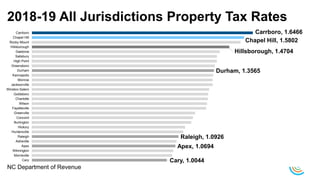
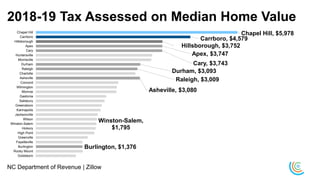

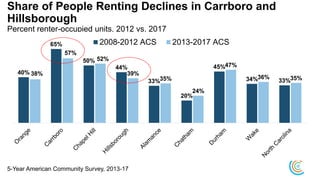


The State of the Community Report from September 19, 2019, highlights various socio-economic and health indicators within Orange County and surrounding areas, including property values, health behaviors, education levels, and income statistics. Significant findings include the assessment of housing units, crime rates, food insecurity, and changes in poverty rates among children. Overall, the report emphasizes community engagement and leadership development opportunities while showcasing the region’s achievements and challenges.


![NYC, Race, Covid-19 [timestamp Jun 12, 2020]](https://cdn.slidesharecdn.com/ss_thumbnails/nycracecovid-192020jun12-200715145521-thumbnail.jpg?width=640&height=640&fit=bounds)


