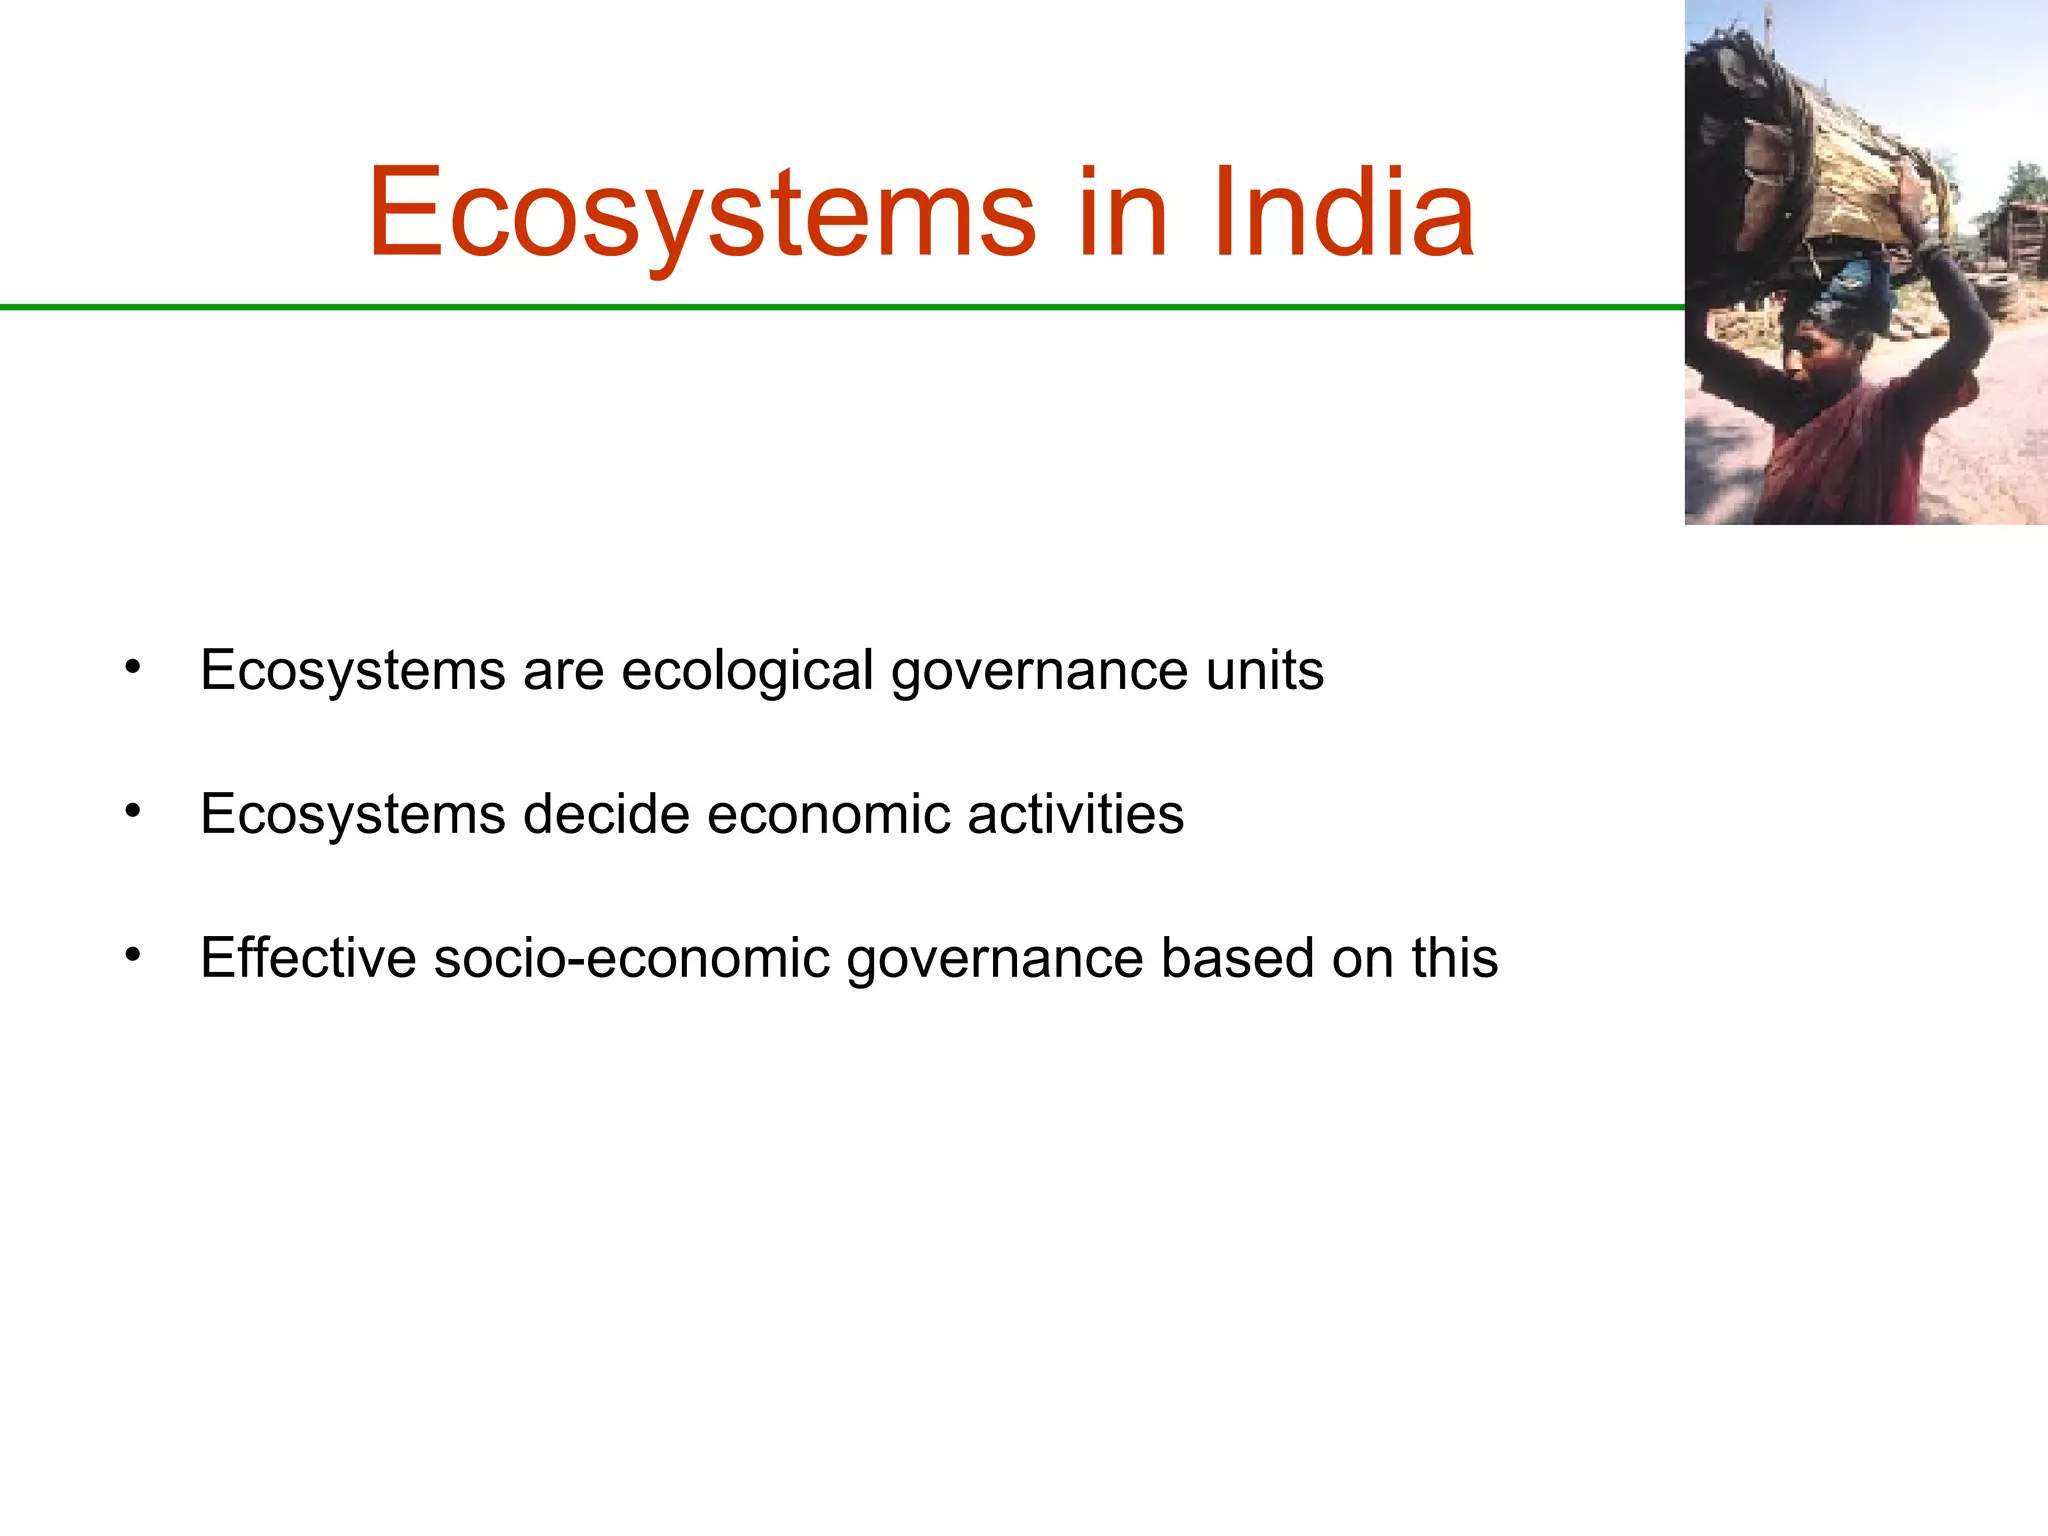
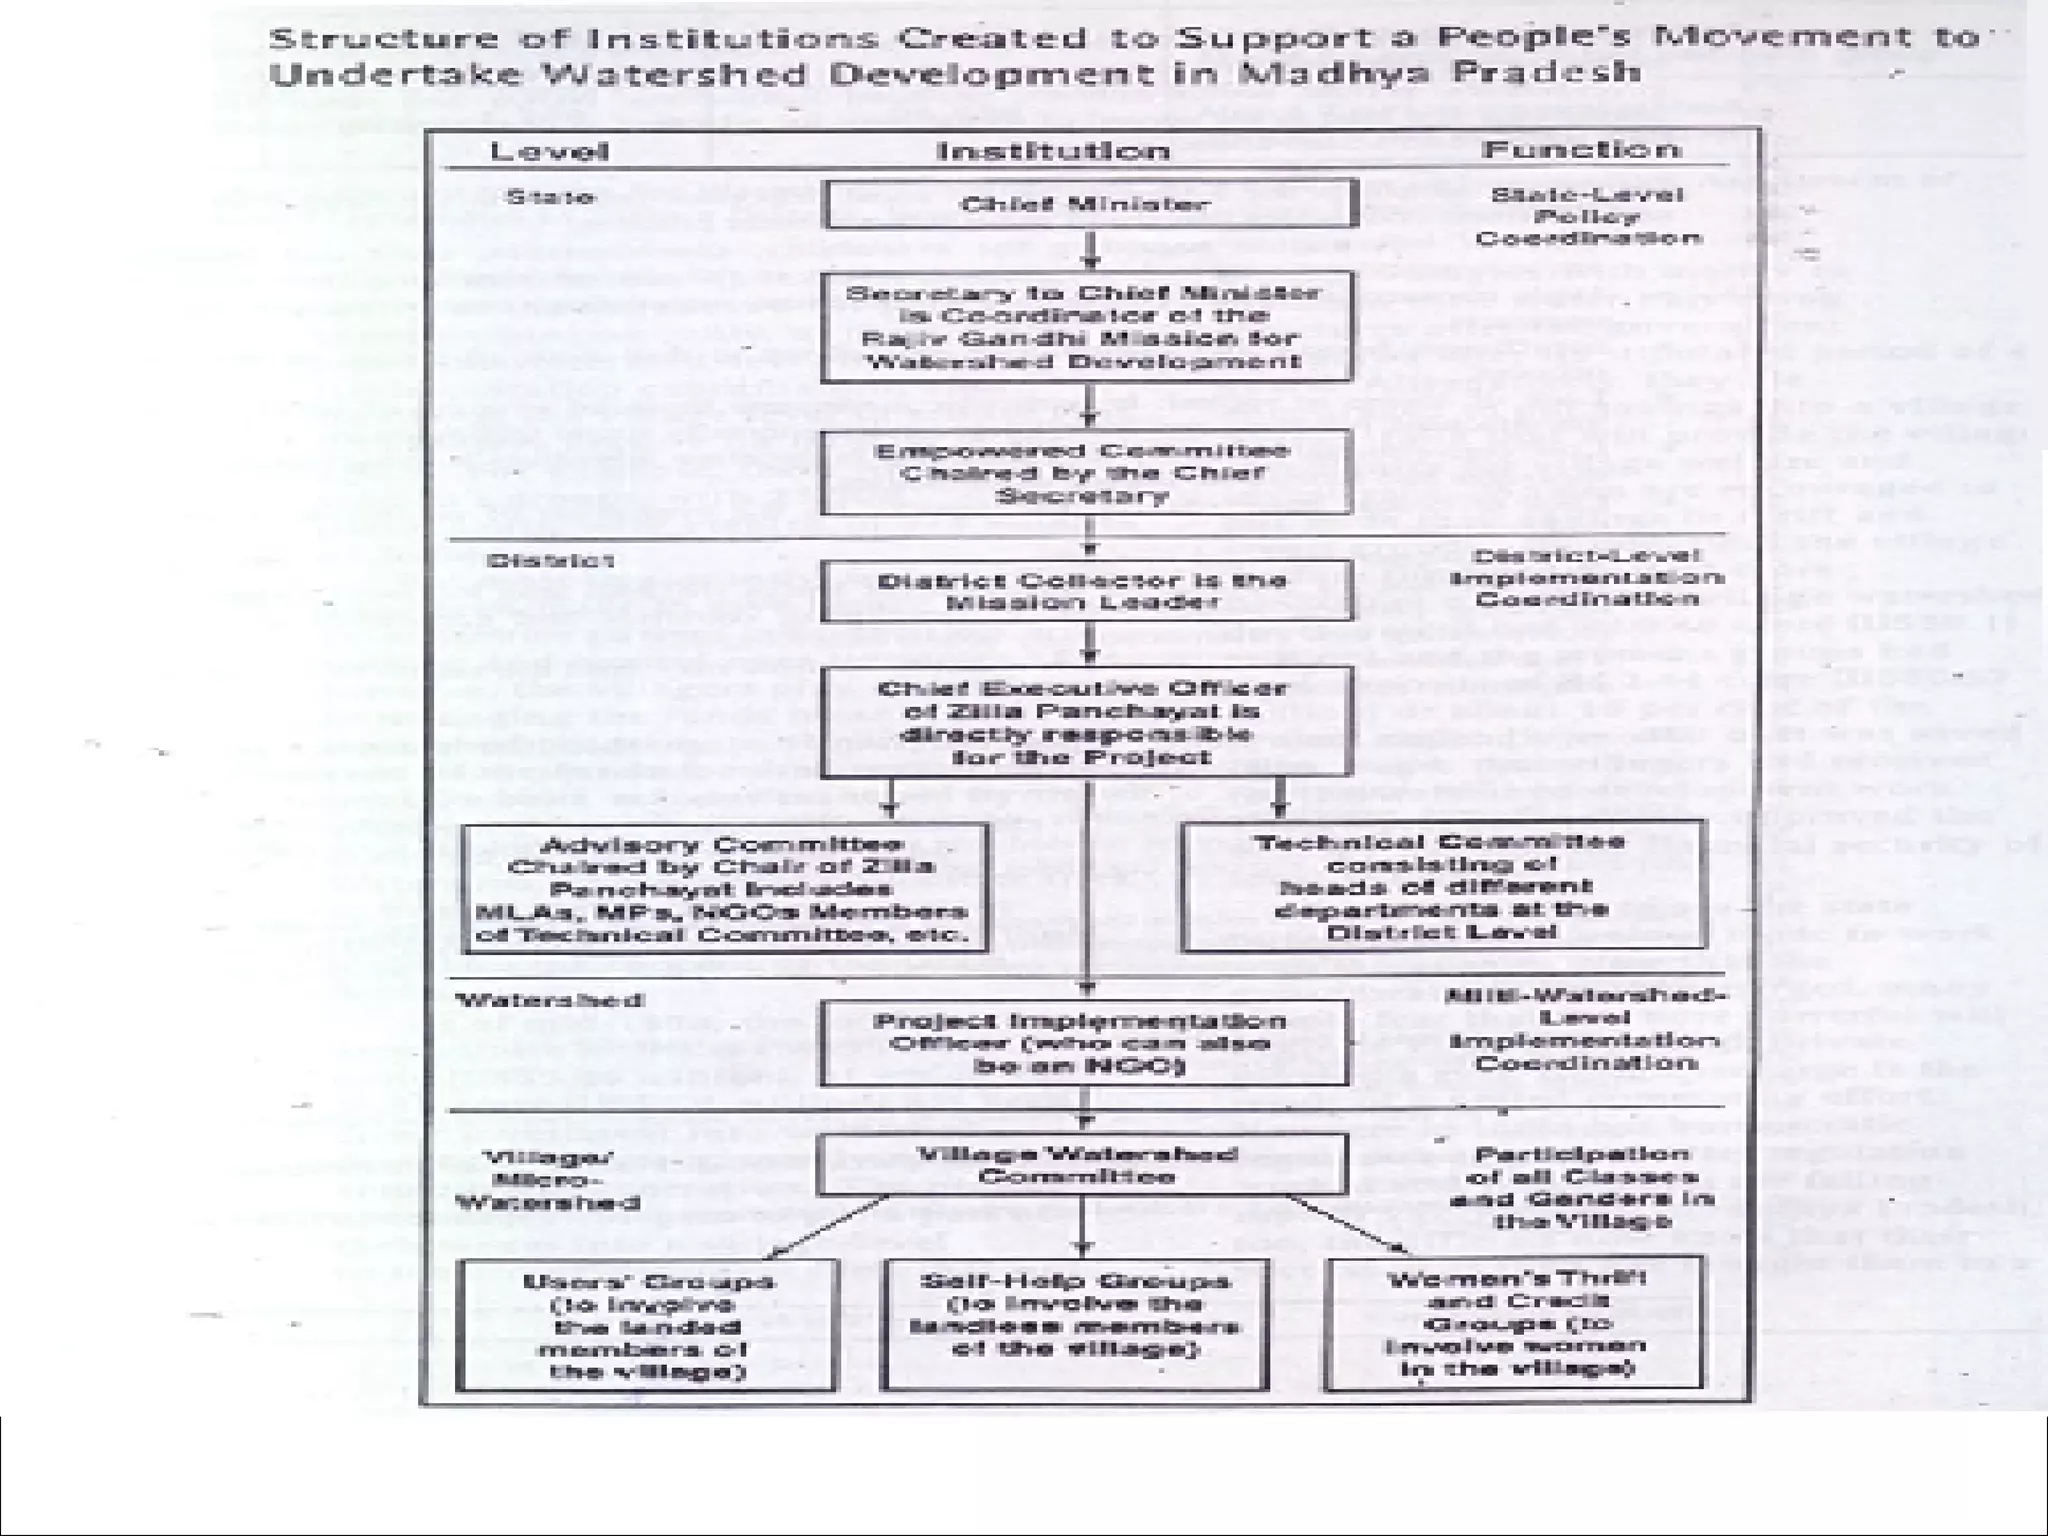
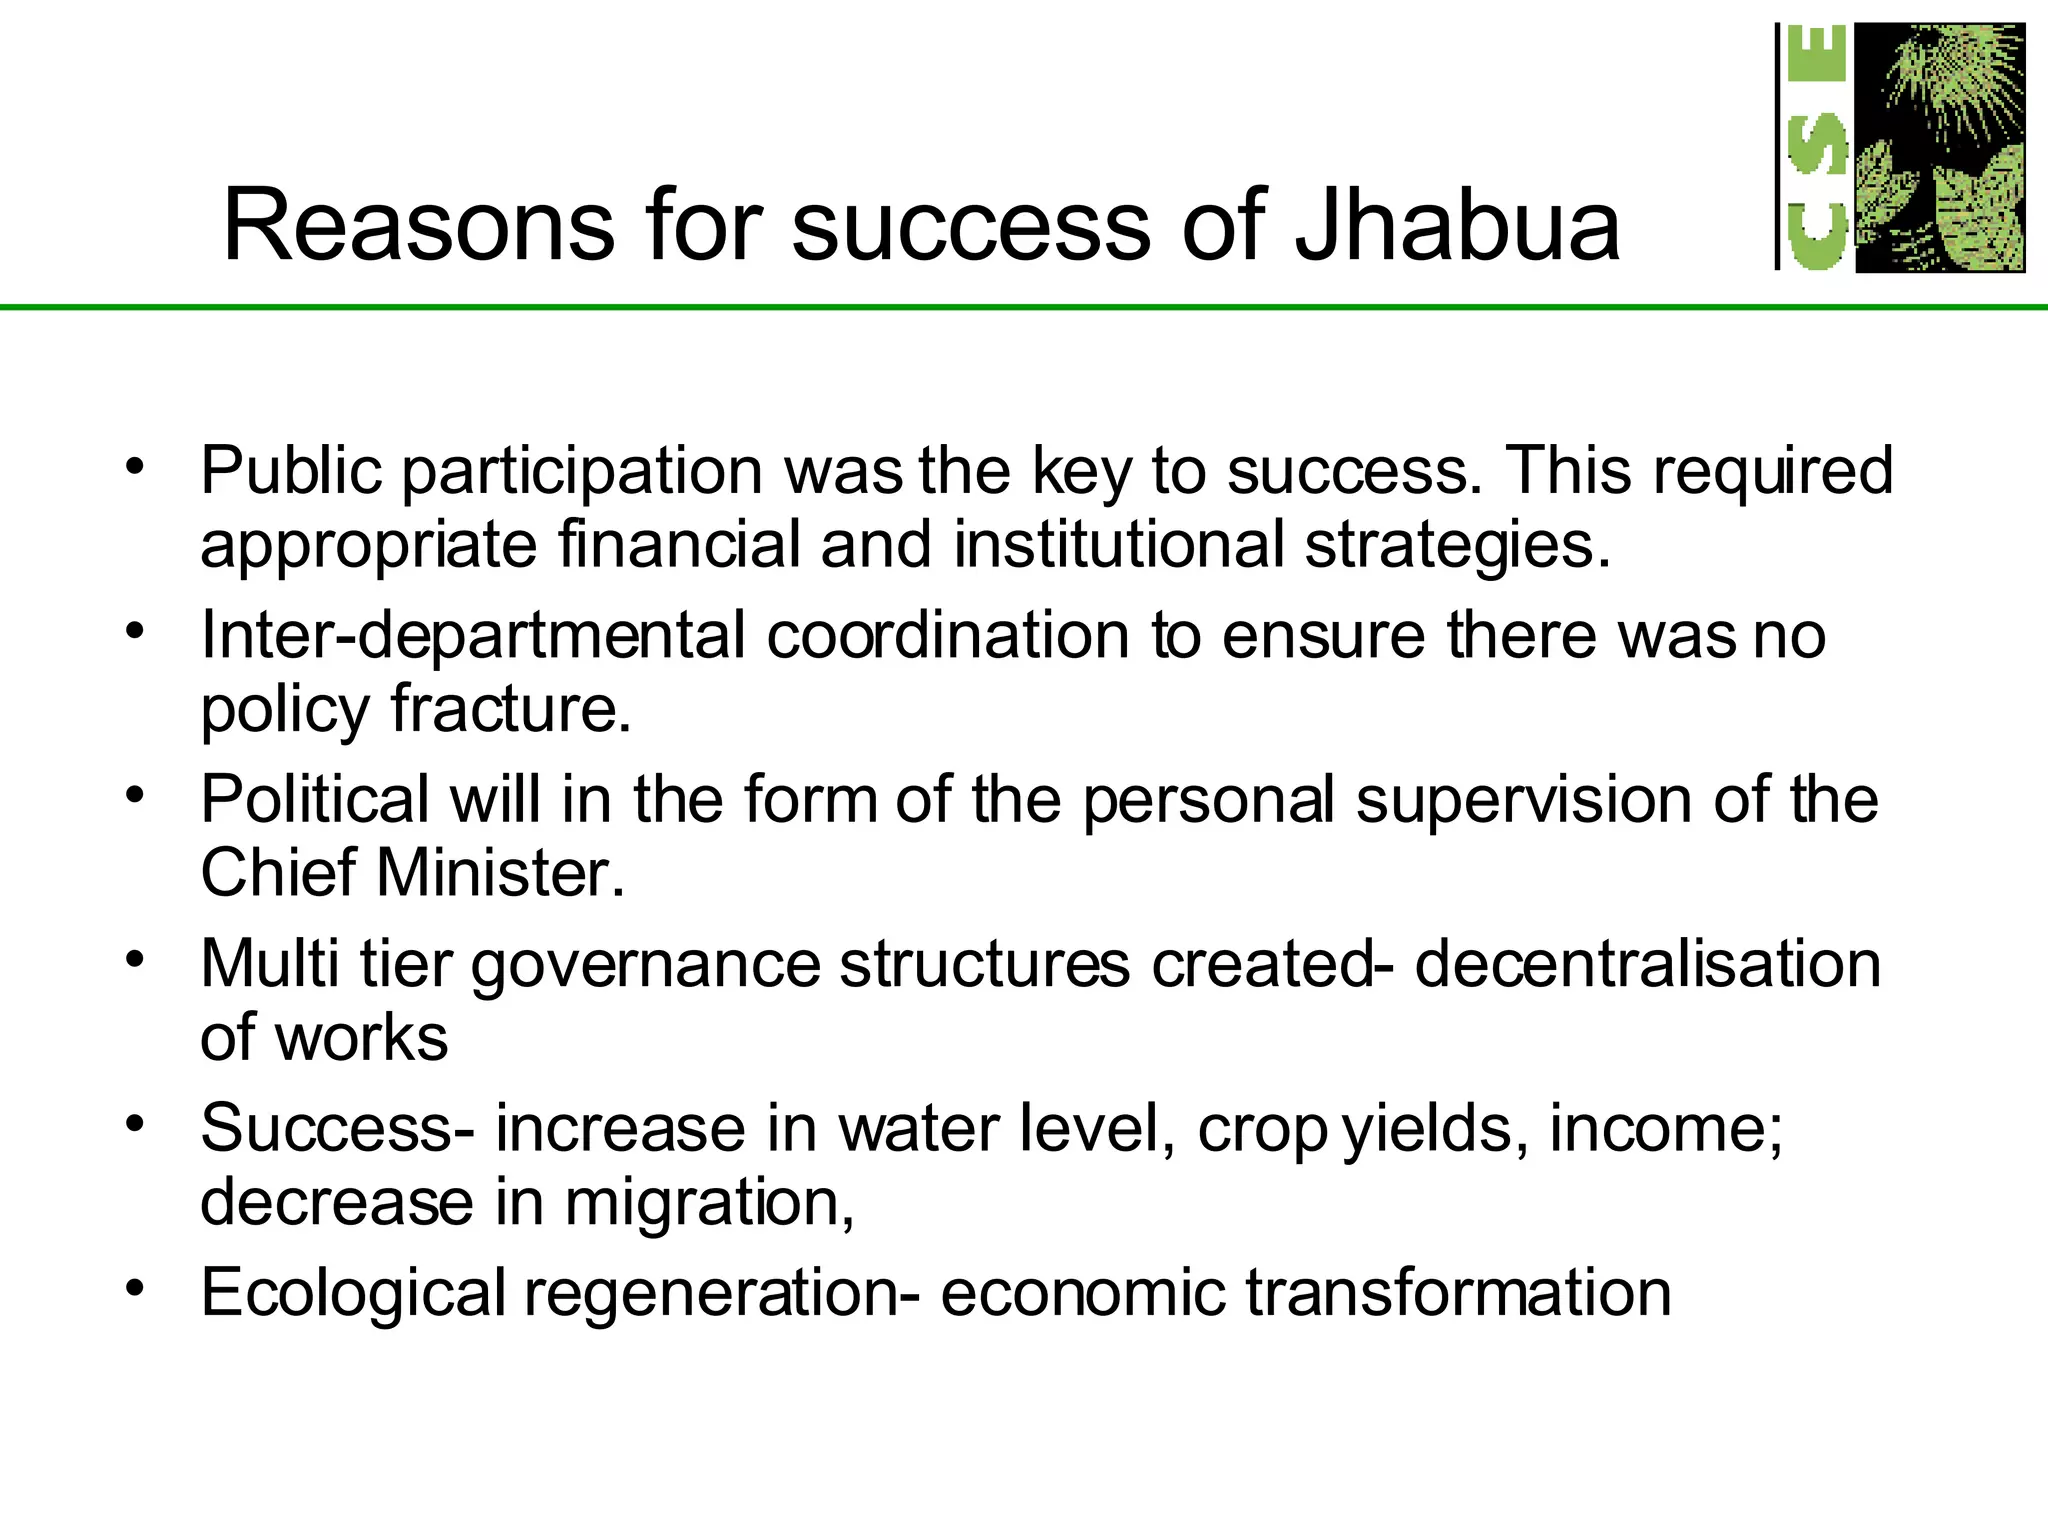
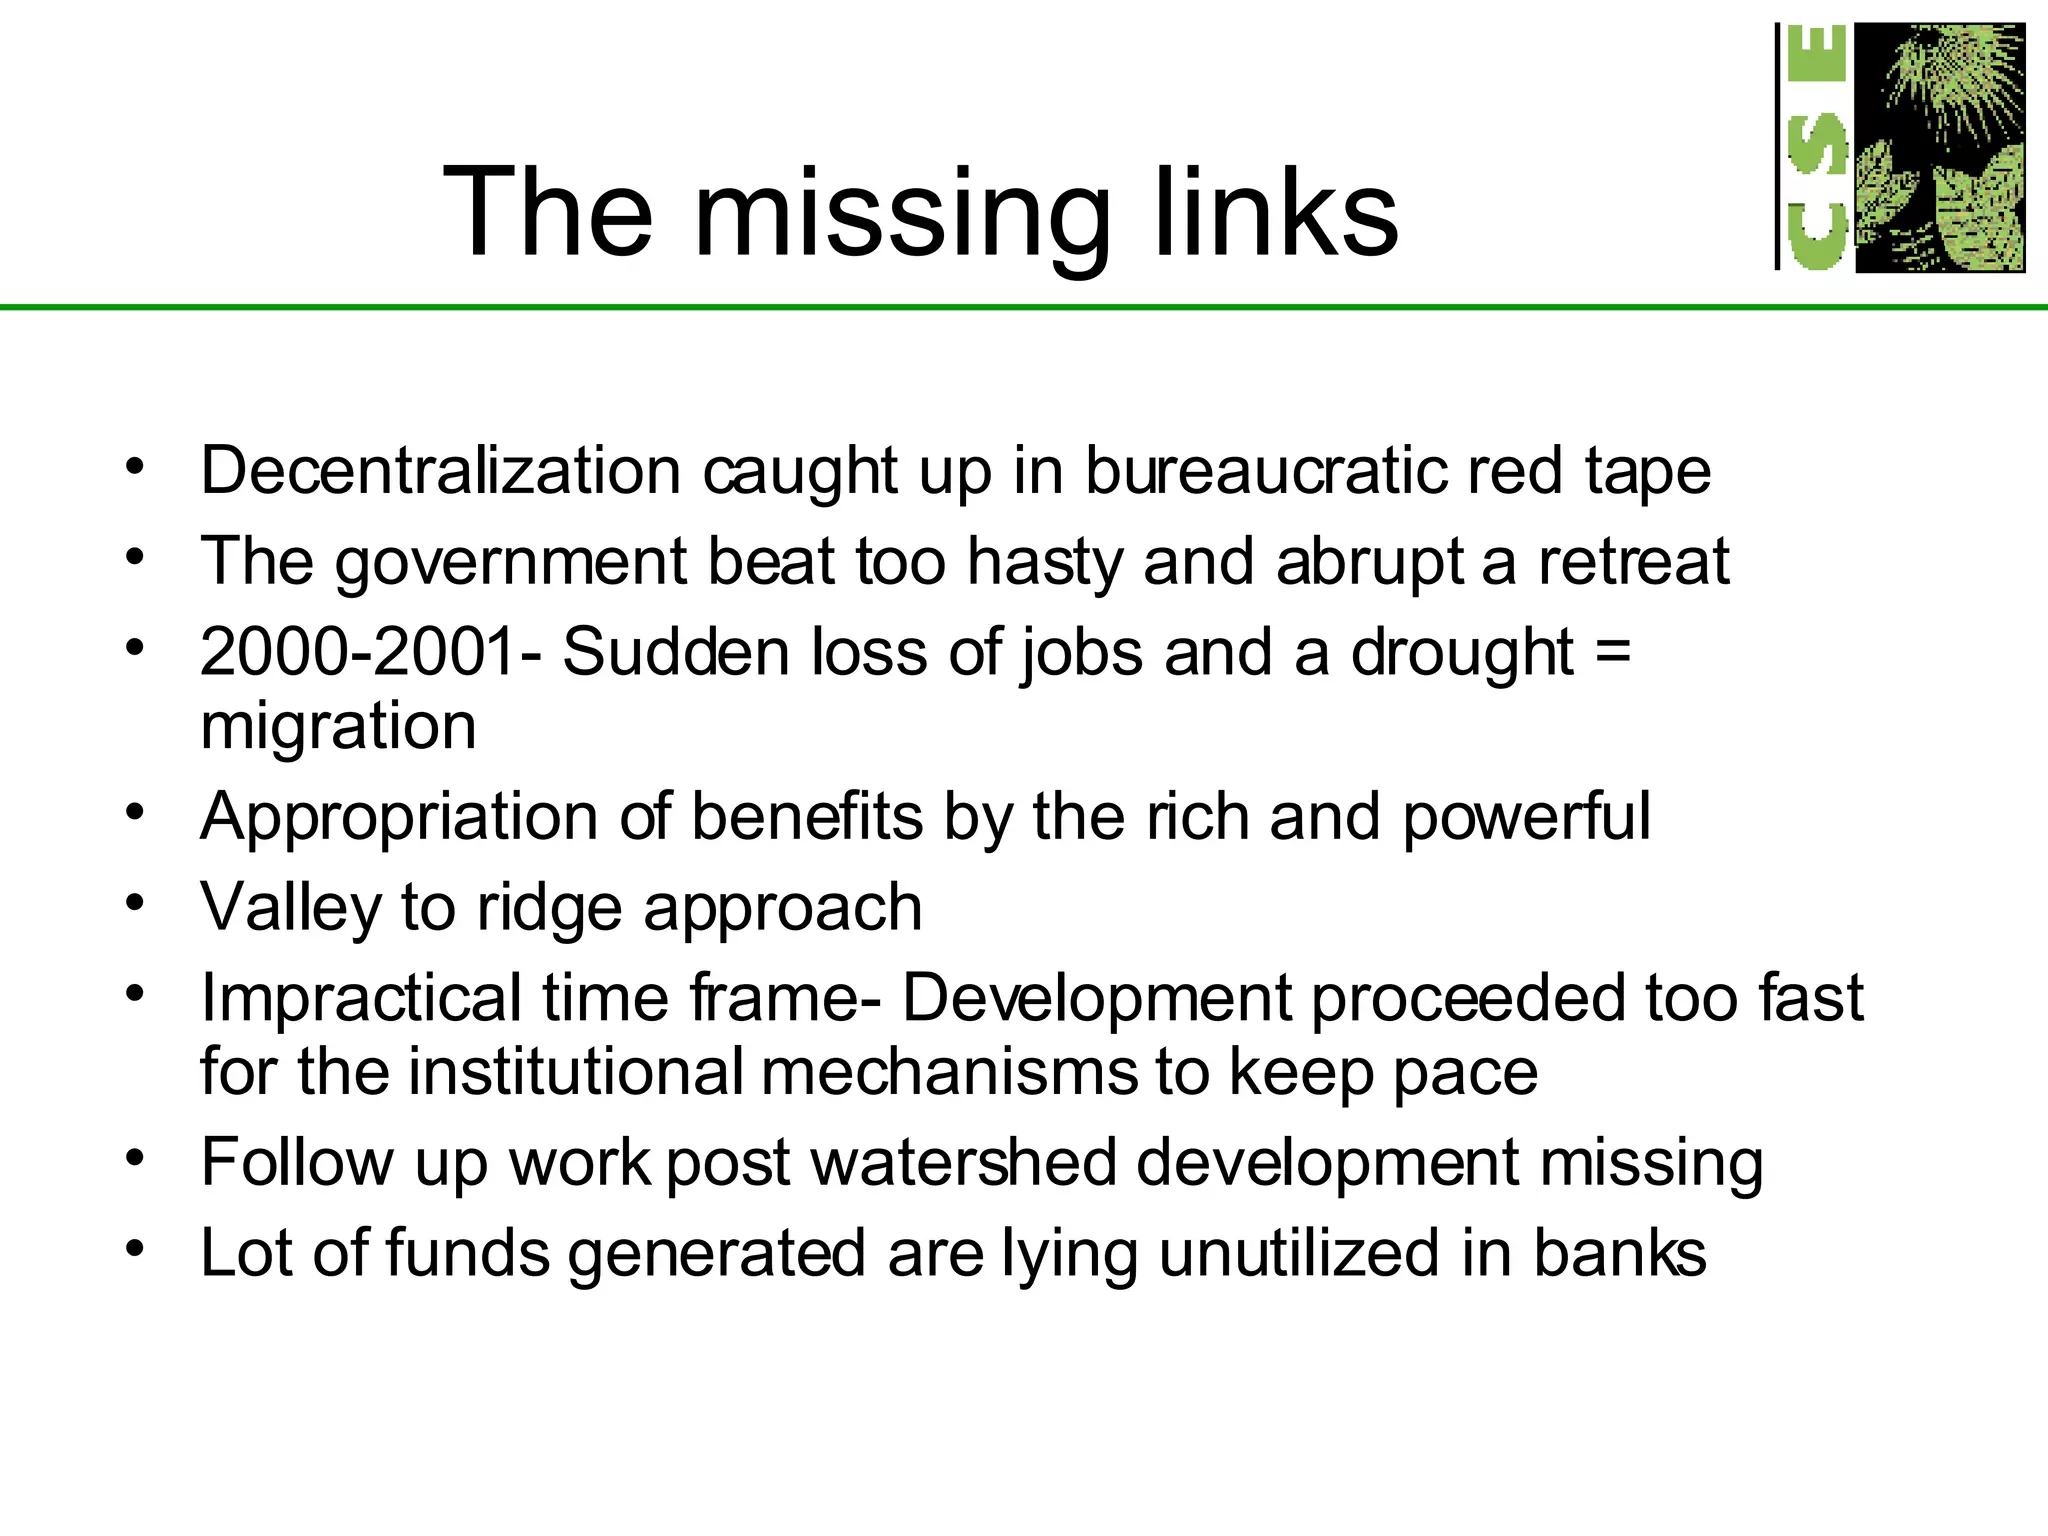
Towards Green Villages
Objectives   To understand the biomass economy To debate and dialogue environmental sustainability To take stock of current state of rural development  To evolve ways to use ecology for economy
Structure Not a skill sharing but deepening understanding Content is evidence based Focus on sharpening our advocacy/ implementation strategy Speakers represent key areas Emphasis on group works
Expectation To broaden our understanding To seek/form alliance for greater common good To initiate change
India’s Biomass Economy
India’s Biomass Economy SD  is  development that meets present needs without  compromising the ability of  future  generations to meet their  needs Economics often gives the wrong signals It is internally consistent but makes the wrong assumptions It works in the short term but leaves us vulnerable in the long term It should create employment and eliminate poverty It should create wealth for everyone This requires an economic system that is strongly altruistic and cooperative
India’s Biomass Economy Ecology contributes 80 percent of income of poor Around 29 percent of ‘national wealth’ sustains 60 percent of population The ‘informal’ sector employs 92 percent of India. Private and public together only 8 percent Over 60% people depend on agriculture, fisheries and forests Agriculture: directly employs 234 million people
India’s Biomass Economy Agriculture contributes 21% of GDP Though declining, dependence increasing GDP may not be showing the right dependence Industry’s major resources are biomass Latest trends show that people still feel agriculture as the livelihood So GNP (Gross Nature Produce) is the right indicator
Ecosystems in India
Ecosystems in India Ecosystems are ecological governance units Ecosystems decide economic activities Effective socio-economic governance based on this
Ecological Regions of India Ecological Regions of India
Ecosystems in India Importance of ecosystems   Key components of eco-systems They are the origin of all ecological maladies A small change in ecosystem triggers poverty The most effective unit for development They define precisely the local needs based on ecology They have clues to persistent poverty issues They are the basic unit for sustainable development
Ecosystems in India   Ecosystems and current development plans Rural schemes are uniform Few of them are area specific like DPAP Centralised development ignores ecosystems So most programmes fail to impact
Ecosystems of India   State of economy in ecosystems Very difficult to measure Arid and semi-arid ecosystems are the poor regions Most of migration happens from degraded ecosystems Majority of unemployment in these areas
State of Poverty in India
State of Poverty in India India’s poverty line: Rs. 12/day in rural, Rs.18/day in urban India More than 300 million people below this line (70% in rural) Poverty > getting chronic, concentrated Natural resource rich areas the poorest (60%)
State of Poverty   Economy grows at around 9%, agriculture at 2.3 % Food grain available: 152 kg /person (rural). 23 kg less than in 90s 30% households eat less than 1,700 kilo calories per day/person Rural poor spend 70 percent of income on food.  Starvation 57% of land facing  degradation  (increase of 53 percent since 1994) Impact esp. on common lands & rain fed areas. About 68 percent of the net sown area  drought prone . 60% of cultivable areas are rainfed (no irrigation). Produce 42% of food 2.5tons/ha productivity 80 % of India’s landholding is less than one hectare The average annual land fragmentation is 2.7/land holding 33% landless (22% in 1991-92) Every second farmer today indebted.  Suicides
State of Poverty Govt.’s anti-poverty schemes 60 years of targeted anti-poverty programmes More than 2000 rural development programmes Rs. 314 billion for poverty alleviation/year Rs. 260 billion for food subsidy/year Rs. 71 billion for irrigation/year Rs. 6 billion for afforestation/year Rs. 2,270 Billion to sustain the bureaucracy/annual It takes Rs. 3.65 to transfer Rs. 1 programme money to poor 58% subsidised food doesn’t reach poor 1/3rd employment creation against target
State of Poverty   Growth vs Poverty Highest rate of economic growth in history Lowest rate of agriculture growth in history Employment per growth unit lowest ever, less than 1% Rural unemployment at 9.1 percent, double in 2 decades Poverty reduction slower during post-reform Need 108 jobs a minute for the next five years Can create 10 jobs from current growth Ecology has huge potential: 110 jobs/minute Need to redefine poverty GNP is effective gross nature produce
State of Poverty   Increasing demands on Biomass Population is increasing by 2 per cent every year 1 Ha sustains now four people, 1.5 people/Ha in 1980s Firewood production must increase from 100 million ton to 300 million tonnes Green fodder production from about 230 million tonnes to 780 million tonnes. India’s per capita forests decreasing: 0.08 Ha now, 0.20 in 1951 Number of people dependent on forests is growing: from 184 million in 1996 to 226 in 2006.  Timber demand (both housing and industrial): from 23 million cubic metres to 29 million cubic metres in 2006. Per capita consumption of paper rose from 3 kgs in 1995 to about 5 kgs in 2003 (in China it was 29.1 kg per person). In Asia, per capita paper consumption is five times higher than in India. But overall biomass production in India seems to be declining rapidly Around 240.62 million Ha of India’s 306.25 million Ha reported land are used for biomass production. Out of this only on a very small fraction of agricultural lands productivity has improved due to irrigation. On the rest, productivity has gone down. And it is declining.
Ecological Poverty Explained   India is biomass based thus dependent on ecology Poverty is caused by ecological degradation Poverty is caused by less access to ecology Thus India’s poverty is ecological poverty Ecological poverty is thus lack of access to natural resources To face the unprecedented demands from biomass this has to be fixed
An Opportunity Ecological poverty is recognised now This gives us an opportunity to redesign rural programmes Programmes like NREGA and BRGF are instruments Civil society has more roles to play
Challenges for Ecological Poverty 0.6 million villages, .23 million elected local governments, 3.8 million elected representatives 2.3 villages per Panchayat (in Assam, as high as 29 villages/Panchayat)  But a centralised approach: gradually the Federal government is in charge of resources Those who take decisions are not the ones who have to live with the consequences of those decisions Panchayats have all power over natural resources Panchayats are regarded as implementing agencies Only one state has devolved power In tribal areas, it is in more distress India has to make a fundamental shift to meet this challenge.  A shift in state’s role from an often-corrupt regulator of the micro-environment to the provider of an enabling and more market-friendly environment
Rainfed Areas, New Crisis Center
Rainfed areas, new crisis center Introduction Irrigation areas stagnating Food production less than pre-Green Revolution period Need to double up food production  Rainfed areas are the answer
Rainfed areas, new crisis center Rainfed agriculture in India extends over an area of 97 million ha and  constitute nearly 67 % of the net cultivated area
Rainfed areas, new crisis center The ecology of rainfed areas   One crop agriculture but 42% production Degraded natural resource base, low soil fertility, soil erosion 15-20% rainwater runs off from rainfed farms But has 65% of unutilized irrigation  Most of backward districts in these areas 60-70% poor of India are in these areas
Rainfed areas, new crisis center Challenges - Opportunities Future food security: 37% extra food grain has to come from here  Huge opportunity for regeneration of ecology Watershed approach: way out of chronic poverty Overall employment and livelihood opportunities
Ecological opportunities Every village in India has the resources to self-sustain Water conservation emerges as the core of these models Community governance is key to sustainability Lays key principles of sustainable development
Community-led Water Management Initiatives Jhabua - Government initiated but implemented successfully by local communities Hivre Bazar - Community initiated, highly successful - Second generation model
Jhabua  Jhabua: A watershed in rural development? Background- history of ecological degradation From ecological degradation to ecological poverty- impacts on economy Migration
Copyright Supriya Singh, SANDEE 2005
Jhabua 1985  A moonscape devoid of any vegetation Copyright Centre for Science and Environment, 1985
Jhabua 1997  Soil and water conservation begun in 1994 begin to bring life back to the land Copyright Centre for Science and Environment, 1997
Jhabua 2005  Dynamic community leadership in some of the mission villages has continued the conservation work Copyright Supriya Singh, SANDEE 2005
A People’s Movement Copyright Supriya Singh, SANDEE 2005
Jhabua 2005  But in other villages….. Copyright Supriya Singh, SANDEE 2005
Reasons for success of Jhabua Public participation was the key to success. This required appropriate financial and institutional strategies. Inter-departmental coordination to ensure there was no policy fracture. Political will in the form of the personal supervision of the Chief Minister. Multi tier governance structures created- decentralisation of works Success- increase in water level, crop yields, income; decrease in migration,  Ecological regeneration- economic transformation
The missing links Decentralization caught up in bureaucratic red tape The government beat too hasty and abrupt a retreat 2000-2001- Sudden loss of jobs and a drought = migration Appropriation of benefits by the rich and powerful Valley to ridge approach Impractical time frame- Development proceeded too fast for the institutional mechanisms to keep pace Follow up work post watershed development missing Lot of funds generated are lying unutilized in banks
Hivre Bazar: A tall order   A replication of Ralegaon Siddhi From punishment zone to model village Community leadership, charismatic leader Revival of community institutions Discipline Lesson – It takes little to reclaim your life- the economics of community led conservation
The starting point of ecological regeneration and economic revival was water The villagers took control of their ecological destiny in their hands. They started harvesting their rainwater endowment. With groundwater recharged, agriculture improved and animal productivity increased. Once they became concerned about their water, the villagers also became concerned about their watershed. The hills are today rich and green.  Distress out-migration has stopped .
Key Lessons - A case for how ecological regeneration is married to economic well being Government for the people- collective leadership Importance of ecology in economy Let people control their natural resources (get rid of the state) Respect traditional knowledge (learn from the villagers themselves)
Ecological opportunities Every village in India has the resources to self-sustain Water conservation emerges as the core of these models Community governance is key to sustainability Lays key principles of sustainable development
A roadmap for sustainable village Key development tips   Need of a new development paradigm (flow chart) Redefined poverty as lack of access to natural resources Water invariably becomes the core Built strong institutions based on right based approach
A roadmap for sustainable village ECOLOGICAL POVERTY Create NATURAL WEALTH   Create ECONOMIC WEALTH
A roadmap to sustainable village Key governance tips   Government does not recognise these, ignore as sporadic cases Government never supports/empowers local institutions
A roadmap

Tgv

  • 1.
  • 2.
    Objectives To understand the biomass economy To debate and dialogue environmental sustainability To take stock of current state of rural development To evolve ways to use ecology for economy
  • 3.
    Structure Not askill sharing but deepening understanding Content is evidence based Focus on sharpening our advocacy/ implementation strategy Speakers represent key areas Emphasis on group works
  • 4.
    Expectation To broadenour understanding To seek/form alliance for greater common good To initiate change
  • 5.
  • 6.
    India’s Biomass EconomySD is development that meets present needs without compromising the ability of future generations to meet their needs Economics often gives the wrong signals It is internally consistent but makes the wrong assumptions It works in the short term but leaves us vulnerable in the long term It should create employment and eliminate poverty It should create wealth for everyone This requires an economic system that is strongly altruistic and cooperative
  • 7.
    India’s Biomass EconomyEcology contributes 80 percent of income of poor Around 29 percent of ‘national wealth’ sustains 60 percent of population The ‘informal’ sector employs 92 percent of India. Private and public together only 8 percent Over 60% people depend on agriculture, fisheries and forests Agriculture: directly employs 234 million people
  • 8.
    India’s Biomass EconomyAgriculture contributes 21% of GDP Though declining, dependence increasing GDP may not be showing the right dependence Industry’s major resources are biomass Latest trends show that people still feel agriculture as the livelihood So GNP (Gross Nature Produce) is the right indicator
  • 9.
  • 10.
    Ecosystems in IndiaEcosystems are ecological governance units Ecosystems decide economic activities Effective socio-economic governance based on this
  • 11.
    Ecological Regions ofIndia Ecological Regions of India
  • 12.
    Ecosystems in IndiaImportance of ecosystems   Key components of eco-systems They are the origin of all ecological maladies A small change in ecosystem triggers poverty The most effective unit for development They define precisely the local needs based on ecology They have clues to persistent poverty issues They are the basic unit for sustainable development
  • 13.
    Ecosystems in India Ecosystems and current development plans Rural schemes are uniform Few of them are area specific like DPAP Centralised development ignores ecosystems So most programmes fail to impact
  • 14.
    Ecosystems of India State of economy in ecosystems Very difficult to measure Arid and semi-arid ecosystems are the poor regions Most of migration happens from degraded ecosystems Majority of unemployment in these areas
  • 15.
  • 16.
    State of Povertyin India India’s poverty line: Rs. 12/day in rural, Rs.18/day in urban India More than 300 million people below this line (70% in rural) Poverty > getting chronic, concentrated Natural resource rich areas the poorest (60%)
  • 17.
    State of Poverty Economy grows at around 9%, agriculture at 2.3 % Food grain available: 152 kg /person (rural). 23 kg less than in 90s 30% households eat less than 1,700 kilo calories per day/person Rural poor spend 70 percent of income on food. Starvation 57% of land facing degradation (increase of 53 percent since 1994) Impact esp. on common lands & rain fed areas. About 68 percent of the net sown area drought prone . 60% of cultivable areas are rainfed (no irrigation). Produce 42% of food 2.5tons/ha productivity 80 % of India’s landholding is less than one hectare The average annual land fragmentation is 2.7/land holding 33% landless (22% in 1991-92) Every second farmer today indebted. Suicides
  • 18.
    State of PovertyGovt.’s anti-poverty schemes 60 years of targeted anti-poverty programmes More than 2000 rural development programmes Rs. 314 billion for poverty alleviation/year Rs. 260 billion for food subsidy/year Rs. 71 billion for irrigation/year Rs. 6 billion for afforestation/year Rs. 2,270 Billion to sustain the bureaucracy/annual It takes Rs. 3.65 to transfer Rs. 1 programme money to poor 58% subsidised food doesn’t reach poor 1/3rd employment creation against target
  • 19.
    State of Poverty Growth vs Poverty Highest rate of economic growth in history Lowest rate of agriculture growth in history Employment per growth unit lowest ever, less than 1% Rural unemployment at 9.1 percent, double in 2 decades Poverty reduction slower during post-reform Need 108 jobs a minute for the next five years Can create 10 jobs from current growth Ecology has huge potential: 110 jobs/minute Need to redefine poverty GNP is effective gross nature produce
  • 20.
    State of Poverty Increasing demands on Biomass Population is increasing by 2 per cent every year 1 Ha sustains now four people, 1.5 people/Ha in 1980s Firewood production must increase from 100 million ton to 300 million tonnes Green fodder production from about 230 million tonnes to 780 million tonnes. India’s per capita forests decreasing: 0.08 Ha now, 0.20 in 1951 Number of people dependent on forests is growing: from 184 million in 1996 to 226 in 2006. Timber demand (both housing and industrial): from 23 million cubic metres to 29 million cubic metres in 2006. Per capita consumption of paper rose from 3 kgs in 1995 to about 5 kgs in 2003 (in China it was 29.1 kg per person). In Asia, per capita paper consumption is five times higher than in India. But overall biomass production in India seems to be declining rapidly Around 240.62 million Ha of India’s 306.25 million Ha reported land are used for biomass production. Out of this only on a very small fraction of agricultural lands productivity has improved due to irrigation. On the rest, productivity has gone down. And it is declining.
  • 21.
    Ecological Poverty Explained India is biomass based thus dependent on ecology Poverty is caused by ecological degradation Poverty is caused by less access to ecology Thus India’s poverty is ecological poverty Ecological poverty is thus lack of access to natural resources To face the unprecedented demands from biomass this has to be fixed
  • 22.
    An Opportunity Ecologicalpoverty is recognised now This gives us an opportunity to redesign rural programmes Programmes like NREGA and BRGF are instruments Civil society has more roles to play
  • 23.
    Challenges for EcologicalPoverty 0.6 million villages, .23 million elected local governments, 3.8 million elected representatives 2.3 villages per Panchayat (in Assam, as high as 29 villages/Panchayat) But a centralised approach: gradually the Federal government is in charge of resources Those who take decisions are not the ones who have to live with the consequences of those decisions Panchayats have all power over natural resources Panchayats are regarded as implementing agencies Only one state has devolved power In tribal areas, it is in more distress India has to make a fundamental shift to meet this challenge. A shift in state’s role from an often-corrupt regulator of the micro-environment to the provider of an enabling and more market-friendly environment
  • 24.
    Rainfed Areas, NewCrisis Center
  • 25.
    Rainfed areas, newcrisis center Introduction Irrigation areas stagnating Food production less than pre-Green Revolution period Need to double up food production Rainfed areas are the answer
  • 26.
    Rainfed areas, newcrisis center Rainfed agriculture in India extends over an area of 97 million ha and constitute nearly 67 % of the net cultivated area
  • 27.
    Rainfed areas, newcrisis center The ecology of rainfed areas One crop agriculture but 42% production Degraded natural resource base, low soil fertility, soil erosion 15-20% rainwater runs off from rainfed farms But has 65% of unutilized irrigation Most of backward districts in these areas 60-70% poor of India are in these areas
  • 28.
    Rainfed areas, newcrisis center Challenges - Opportunities Future food security: 37% extra food grain has to come from here Huge opportunity for regeneration of ecology Watershed approach: way out of chronic poverty Overall employment and livelihood opportunities
  • 29.
    Ecological opportunities Everyvillage in India has the resources to self-sustain Water conservation emerges as the core of these models Community governance is key to sustainability Lays key principles of sustainable development
  • 30.
    Community-led Water ManagementInitiatives Jhabua - Government initiated but implemented successfully by local communities Hivre Bazar - Community initiated, highly successful - Second generation model
  • 31.
    Jhabua Jhabua:A watershed in rural development? Background- history of ecological degradation From ecological degradation to ecological poverty- impacts on economy Migration
  • 32.
  • 33.
    Jhabua 1985 A moonscape devoid of any vegetation Copyright Centre for Science and Environment, 1985
  • 34.
    Jhabua 1997 Soil and water conservation begun in 1994 begin to bring life back to the land Copyright Centre for Science and Environment, 1997
  • 35.
    Jhabua 2005 Dynamic community leadership in some of the mission villages has continued the conservation work Copyright Supriya Singh, SANDEE 2005
  • 36.
    A People’s MovementCopyright Supriya Singh, SANDEE 2005
  • 37.
    Jhabua 2005 But in other villages….. Copyright Supriya Singh, SANDEE 2005
  • 38.
    Reasons for successof Jhabua Public participation was the key to success. This required appropriate financial and institutional strategies. Inter-departmental coordination to ensure there was no policy fracture. Political will in the form of the personal supervision of the Chief Minister. Multi tier governance structures created- decentralisation of works Success- increase in water level, crop yields, income; decrease in migration, Ecological regeneration- economic transformation
  • 39.
    The missing linksDecentralization caught up in bureaucratic red tape The government beat too hasty and abrupt a retreat 2000-2001- Sudden loss of jobs and a drought = migration Appropriation of benefits by the rich and powerful Valley to ridge approach Impractical time frame- Development proceeded too fast for the institutional mechanisms to keep pace Follow up work post watershed development missing Lot of funds generated are lying unutilized in banks
  • 40.
    Hivre Bazar: Atall order A replication of Ralegaon Siddhi From punishment zone to model village Community leadership, charismatic leader Revival of community institutions Discipline Lesson – It takes little to reclaim your life- the economics of community led conservation
  • 41.
    The starting pointof ecological regeneration and economic revival was water The villagers took control of their ecological destiny in their hands. They started harvesting their rainwater endowment. With groundwater recharged, agriculture improved and animal productivity increased. Once they became concerned about their water, the villagers also became concerned about their watershed. The hills are today rich and green. Distress out-migration has stopped .
  • 42.
    Key Lessons -A case for how ecological regeneration is married to economic well being Government for the people- collective leadership Importance of ecology in economy Let people control their natural resources (get rid of the state) Respect traditional knowledge (learn from the villagers themselves)
  • 43.
    Ecological opportunities Everyvillage in India has the resources to self-sustain Water conservation emerges as the core of these models Community governance is key to sustainability Lays key principles of sustainable development
  • 44.
    A roadmap forsustainable village Key development tips   Need of a new development paradigm (flow chart) Redefined poverty as lack of access to natural resources Water invariably becomes the core Built strong institutions based on right based approach
  • 45.
    A roadmap forsustainable village ECOLOGICAL POVERTY Create NATURAL WEALTH   Create ECONOMIC WEALTH
  • 46.
    A roadmap tosustainable village Key governance tips   Government does not recognise these, ignore as sporadic cases Government never supports/empowers local institutions
  • 47.