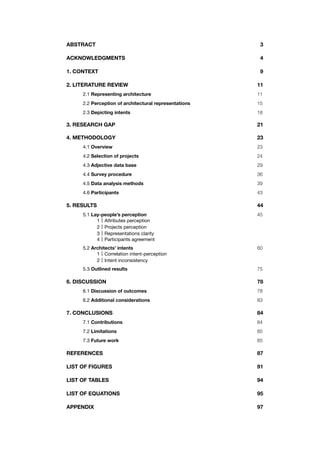
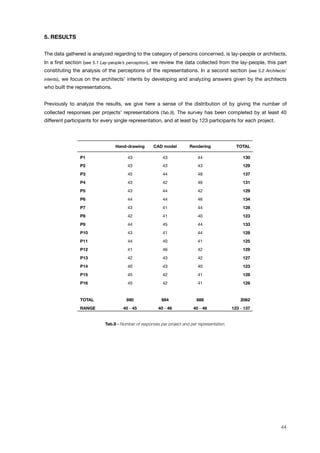
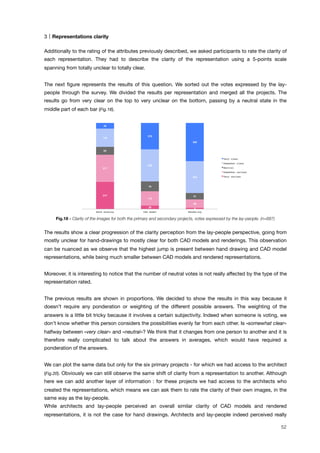
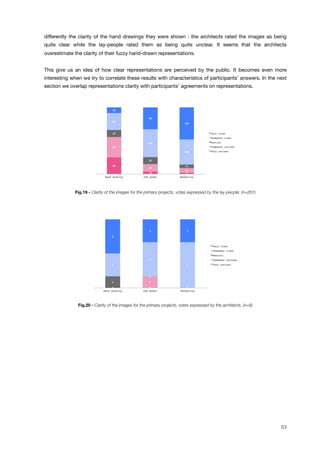
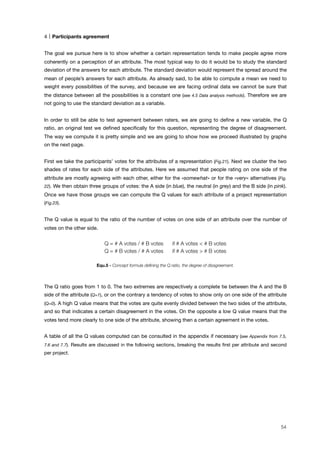
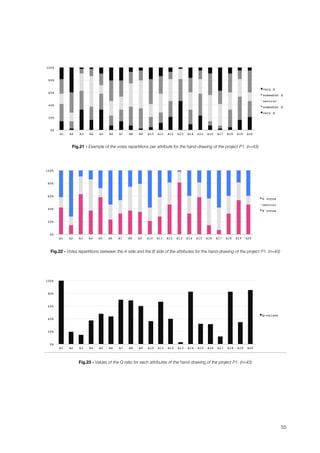
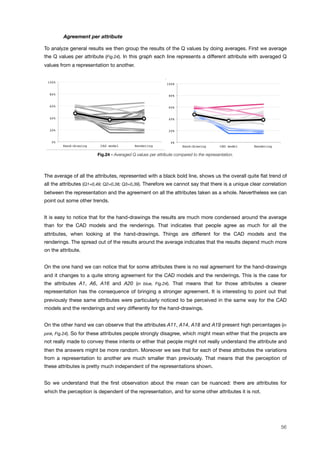
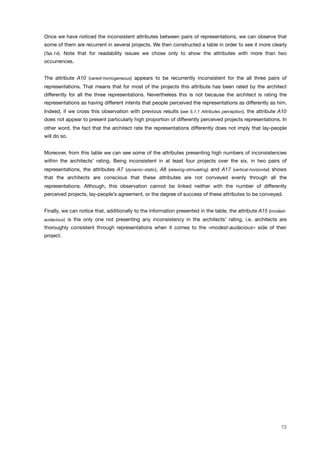
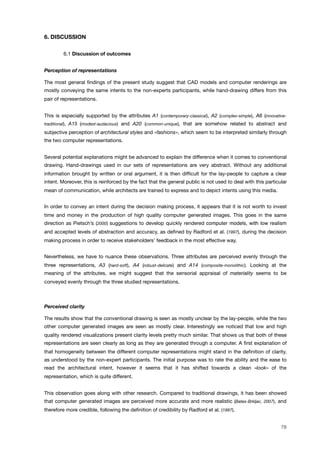
This study examines how laypeople perceive architectural representations of different forms and how well the representations convey the architect's intended message. A survey was conducted with roughly 700 laypeople who were shown representations in the form of hand drawings, CAD models, and computer renderings for several projects. The results show that computer representations were generally perceived as conveying the same intents, with renderings conveying the architect's intentions slightly more faithfully than CAD models. Overall, the findings suggest that lower-fidelity representations provide the most efficient communication, balancing successful conveyance of intent with time commitment. These results can help architects choose representations that maximize the value of feedback received from laypeople during the design process.


![2. LITERATURE REVIEW
! 2.1 Representing architecture
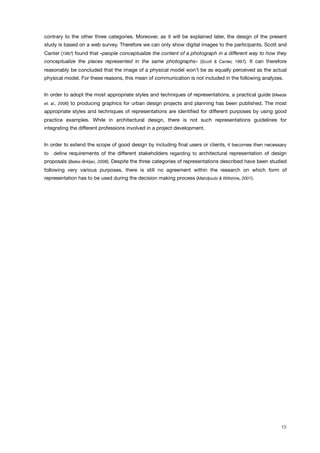
rep• re• sen• ta• tion /r!pr"z!n#te"$(#)n/ noun
The description or portrayal of someone or something in a particular way.
source: Oxford American College Dictionary
During the decision making process architectural representations constitute the principal support of
communication between architects and stakeholders. People’s understanding and assessment of design
proposals are evaluated throughout the visual representations (Bates-Brkljac, 2008). This visual
communication can take various shapes and each of these form convey different informations.
To convey information about an artifact from a designer to a viewer is the fundamental objective for a
representation (Sheppard & Meitner, 2005). Representations are never really complete, they rather convey
critical aspects of the reality following a purpose (Appleyard, 1977). In representations, reality is substituted
by symbolism (Summers & Shah, 2004). For example, the objectives of sketches is to simplify the reality in
order to illustrate the subjacent intent, by doing a form of selection of the information to represent
(Leclercq, 2005). The producer of a representation is therefore strongly relying on the ability of the viewers’
ability to read the symbolized representation and to picture the potential result in reality (Wergles & Muhar,
2009). Architects’ expectations to convey a message is depending on the form of the representation they
are using. The following section aims of defining representation in its functions and its forms, this way
further defining the scope of the present study.
Function
Architects use different types of representation according to the architectural project life cycle, going from
the creation to the final presentation, including the technical description. During this process,
representations are not all produced with the same purpose.
During the design process, the architect goes through multiple phases and very often concurrently.
Several representations are used during this process. It is important to notice that the design process is
not linear but a succession of loops, going from one phase to another, and from one representation to
another. Summarizing research in design representations, four main functions that representations play in
architecture has been identified: [1] as ideation tool, [2] as collaboration media, [3] as mean of illustration,
and [4] as technical representation (Leclercq & Elsen, 2007; Pei et al., 2011).
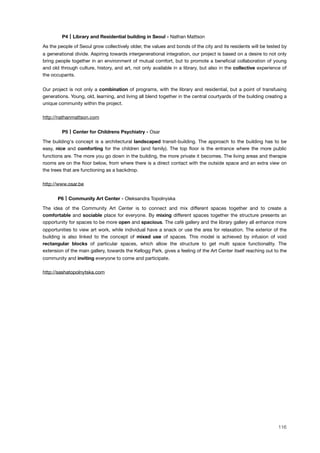
[1] During the ideation phase, representations are used as an reflection tool
supporting the creative process of an architectural project. Architects need to
develop ideas on a support and inspect them. As they are inspecting their own
ideas they find ways to refine and revise the concepts (Suwa & Tversky, 1997). It is like
having a conversation with one's self, similarly to the process «see-transform-see»
as defined by Schön (1983).
[2] Some representations are used in a collaborative context, in order to communicate
and refine ideas and design proposal collaboratively (Detienne et al., 2007).
12](https://image.slidesharecdn.com/d5b3bf46-9a4a-4b77-a3e4-87f2841022d2-150813144529-lva1-app6892/85/TFE_MCunin-12-320.jpg)
![[3] Further, architects use illustrative representations to show how a building will look
like to potential stakeholders. Representations convey these stakeholders with
information that will enable them to appreciate the qualities of the design
proposed by the architect (Bates-Brkljac, 2008).
[4] The architect has to define how precisely the proposal should be built, what it is
made of, etc. Technical representations serve the practice of the construction
industry (Bates-Brkljac, 2012).
Representations that play different functions constitute a junction layer between different groups of
people. On one side, the first and the third category are mostly joining professionals. Representations in
the ideation process is a mean of communication either between several architects or an architect with
one’s self, while technical representations join architects with other construction professionals. On the
other side, representations in the second group act as a communication tool between architects and
stakeholders during the decision making process.
The present study is focusing on representations as an interface between architects and clients, and more
precisely on means of communication adopted by the designer to convey an idea around the negotiation
table.
Form
Over the years, architects have developed an extensive and various range of representations used for
communication, collaboration and decision-making, such as and sketches, drawings, computer
simulations, renderings, photographs and physical models.
Developed over the time, traditional form of architectural representations, such as cross-sections and
elevations, are abstract and symbolically encoded. They require specific knowledge from the viewer to be
interpreted and, for this reason, they don’t communicate design proposals effectively to the non-expert
public (Pietsch, 2000). During their education process, design community members acquire the specific
knowledge to translate encoded representations, which enable them to extract information and picture the
potentiality of the design proposition (Healey, 1985).
While, conventional representation methods, such as hand-drawings and sketches, are still common use,
recent times, more particularly, have seen significant changes in architectural representation methods. The
fast development of computer technology and visualization softwares lead very quickly to the widespread
use of computer generated representations (Mahdjoubi & Wiltshire, 2001). The evolutions in the architecture
practice brought by the introduction of computer in the design process has been explored. (Estevez, 2001)
According to Sheppard (2001), the nowadays widespread use of photorealistic representation is due to its
effectiveness to communicate design proposals (Sheppard, 2001).
Obviously, to enable the participation of lay-people in the decision-making process, the comprehension of
the visual representation used by the architect is a prerequisite (Sheppard & Meitner, 2005). By sharing the
understanding of the representation brought by computer visualization, non-experts are enabled to assess
the visual and spatial impact of development proposals (Hall, 1992, p.1). The new technology was promising
a potential increasing involvement of clients and users in the design process. In the end, it could
13](https://image.slidesharecdn.com/d5b3bf46-9a4a-4b77-a3e4-87f2841022d2-150813144529-lva1-app6892/85/TFE_MCunin-13-320.jpg)
![potentially extend the scope of good design by proposing an architecture more attuned to clients’ or
users’ needs (Groak, 1998). Since then, researches suggest computer simulation as a better mean of
expression to communicate with the lay-people in a commonly understood language (Pietsch, 2001).
Nevertheless, the choice of one or another method to represent a proposal is not taken without
consequences on people’s expectations. Indeed, hand-drawings are known by everyone as an abstract
representation. People know that end product will be different than represented. Whereas the built artifact
is expected to match the information shown on photorealistic images, seen similarly to genuine
photographs (Harrilchak, 1993). Some researchers claim that the digital techniques must be a
complementary to the traditional tools (Day, 2002). One of the argument is the that free-hand sketches leave
doors open to further refinements, as the design doesn’t seem to be over, while renderings seem to
crystallize states, as the user see a proposal closer to reality.
As a witness of common use back in 2011, a large scale survey including 629 Belgian architects shows
that two and three dimensional CAD softwares are used by a majority of architecture practice actors.
Moreover, it seemed that «CAD softwares and sketches are roughly of equal importance for both modeling
and presentation of the design, and have a secondary role as communication design support
tool.» (Verdonck et al., 2011, p.774)
In the nowadays common practice, we summarized previous literature by identifying three main
categories of representations used during the decision making process in order to convey an intent to the
client :
[-] hand-drawn representations, such as hand-drawings and sketches,
[-] low quality computer simulations, as directly produced from CAD softwares, and
[-] high quality computer simulations, such as photorenderings and photomontages.
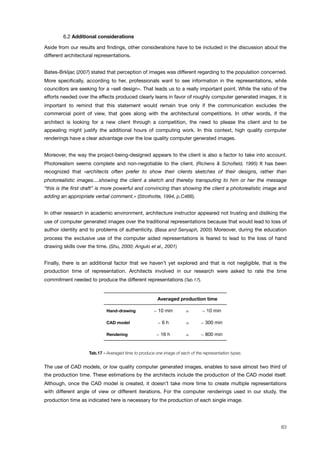
It is important to notice that one of the main criteria to distinguish the last two categories is the time of
production required for each image. The low quality computer simulations are the representations with
no, or very little, post-production process after the image has been taken from the CAD softwares. The
architect has then very little to communicate the design proposal from the software to the client. The high
quality computer simulations are including more heavy post-process such as photo-realistic simulations
and photo-collages.
Interestingly, video records of architects at work appeared on the web in 2012 (see Ref.1), showing how
four famous architects present their proposal to clients in the context of an architectural design
competition. As a witness of the nowadays common practice, the videos show the architects doing a
fundamental part of the practice of the architecture practice, the communication of the proposal. Using
several means of representation they communicate their intents to the clients. It has to be noticed that the
representations used by the architects includes all the three categories previously enumerated. Although,
they also include a fourth group, physical models, even if they don’t constitute the core of the
presentations.
Physical model is a very particular mean of communication of a design proposal. It is not part of every
sets of representations used by the architects during the communication phase of the project, for instance
during certain architectural competitions. As a physical object, it cannot be contained on a sheet of paper
14](https://image.slidesharecdn.com/d5b3bf46-9a4a-4b77-a3e4-87f2841022d2-150813144529-lva1-app6892/85/TFE_MCunin-14-320.jpg)
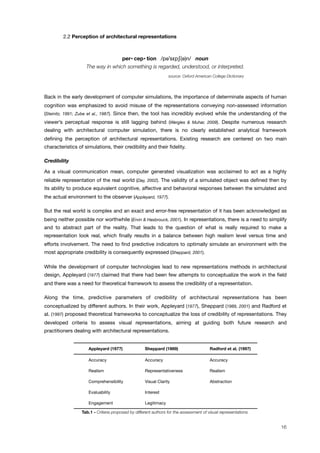
![As a critique of the contemporary practice, Appleyard (1989) defined criteria for assessing simulation quality
[-] Realism and accuracy - as the reflection of how the project is experienced,
[-] Comprehensibility and evaluability - as the ease of access to the lay-people to
understand the content of the simulation and evaluate it for their own purposes, the
main content assed mostly being technical informations such as the length of a
sidewalk, and
[-] Engagement - as the ability to keep the viewers focused on the message conveyed
by the simulation, which can be reword as the ability to please the viewer and not
discourage to be read.
Based on this theoretical framework, Sheppard (1989) proposed refined criteria for improved
comprehension, credibility and bias-free visual simulations :
[-] Representativeness - as the degree to which it represents typical views of the project,
the ability of the image to represent the project as a whole,
[-] Accuracy - as the similarity between the simulated and the actual scene,
[-] Visual clarity - as the degree to which content can be easily understood by the viewer,
which is interesting to assess if we want to study the ability of a representation to
convey an architectural intent,
[-] Interest - as the degree to which simulations hold the interest of the audience, and
[-] Legitimacy - as the degree of correctness of the simulation.
Later, Radford et al. (1997) refined the criteria and conceptualized a theoretical model to assess computer
visualization. He identified three distinct qualities to evaluate computer visualization :
[-] Abstraction - as the amount of detail included within the model,
[-] Accuracy - as the the level of dimensional accuracy achieved, and
[-] Realism - as the overall realism of the visualization, such as colors and details.
According to Radford’s theory, observers’ perceptual responses is influenced by the collective effect of
the abstraction, the accuracy and the realism of the representation (Bates-Brkljac, 2008). Each visualization is
represented by a balance of these three criteria. Depending on the purpose followed by the visualization,
the most appropriate balance between the three criteria has to be defined by the producer of the
representations (Day, 2002).
Bates-Brkljac (2008) assessed the credibility of architectural representations from the lay-people
perspective. The theoretical framework used was based on Radford’s definition of credibility, based on the
three qualities abstraction, accuracy and realism. Six bipolar adjectives were determined internally to
assess each of these criteria. Note that the question raised of the choice of theses particular adjectives in
order to assess a meta-characteristics. By comparing responses collected from computer and hand-
drawn representations, it seems that computer generated representations appear as a more credible
architectural representation than traditional hand-drawn perspectives.
17](https://image.slidesharecdn.com/d5b3bf46-9a4a-4b77-a3e4-87f2841022d2-150813144529-lva1-app6892/85/TFE_MCunin-17-320.jpg)
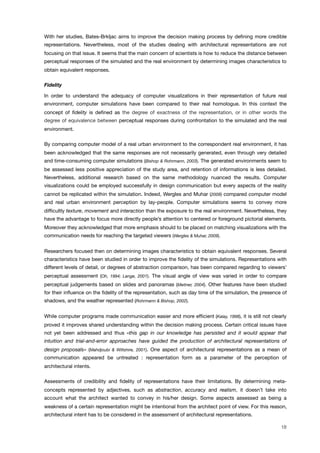
![3. RESEARCH GAP
Following up existing literature, we understand that a gap of knowledge exists when it comes to
architectural representations and the way architectural intents are conveyed. While credibility and fidelity
of representations have been extensively studied, there is still a need of comprehensive analysis on the
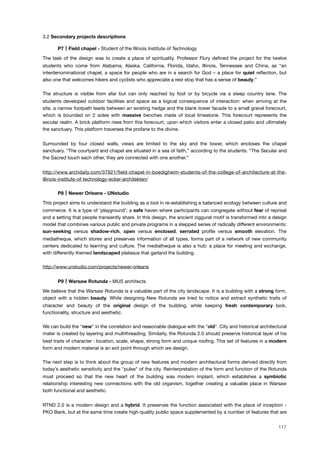
influence of the representation choice over the perception of architectural intents. The present study aims
to advance the discussion about architectural representations as a visual mean of communication to
convey an intent from the architect to lay-people through different mean of visual communication (Fig.1).
Fig.1 - Different perceptions of an architect’s intent
through different modes of representation.
It is important to remind that design proposals are evaluated throughout the visual representations during
the decision making process. It is then crucial to determine whether the representations convey faithfully
the architectural intents. But there is a clear lack of comprehensive study dealing with both architects’
intentions conveyed through different representations and viewer perceptions of the proposals also as a
parameter of the representation.
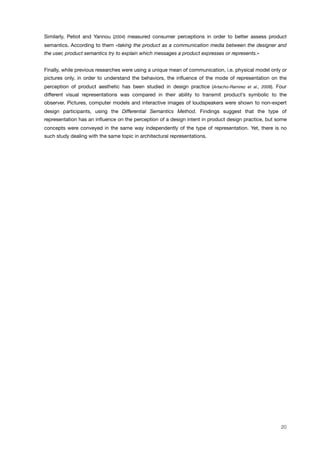
Methodologically speaking, we base our approach on similar research in product design. The present
study will be focusing on three main type of representations : [1] hand-drawings, [2] CAD models, and [3]
photororendings and photomontages, given their widespread use in architectural practice as well as the
methodological issues described previously. (see 2.1 Representing architecture)
Below are the three main research questions this study will investigate :
[-] Is there an influence of the style of representation over lay-people’s
perceptions of an architectural intent?
[-] Is the style of representation influencing participants’ agreement about
the perception of an architectural intent?
[-] Are representation styles conveying equally successfully the
architectural intents?
Reviews
Portofolios
Descriptions
Websites
REFERENCE
STUDY
INITIAL SPACES REDUCED SPACES
REFERENCE
STUDY
SEMANTIC
FITLER
FINAL SPACE
+ +REPRESENTATIONS
SEMANTIC
DIFFERENTIAL
SCALE [-2 ; +2]
SURVEY
COEXISTENCE
TEST
FINAL
Laypeople
Architect
ARCHITECTURAL
PROJECT
Architect
? Perception 1
Laypeople
Perception 2
Perception 3
?
?
1
2
3
REPRESENTATIONS
INTENT
22](https://image.slidesharecdn.com/d5b3bf46-9a4a-4b77-a3e4-87f2841022d2-150813144529-lva1-app6892/85/TFE_MCunin-22-320.jpg)
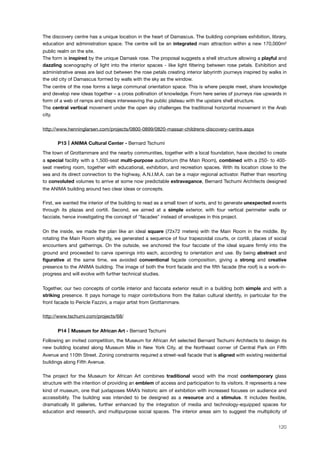
![! 4.2 Selection of projects
The first step our methodology is to find the visual material. The objective we follow is to get insights from
both students and professionals, and not to limit our research on academic assignments. We justify this
decision with two main reasons. First, it brings validity and representativeness of the representations
used, by leaning the research closer to the professional community than the students in their learning
process. And second, we ensure a reproducibility of the study, by avoiding particular pedagogical styles in
terms of representations.
Dozens of architects and students have been reached to provide projects representations that follow our
criteria, along with a short description of the architectural intents. An email campaign has been conducted
mostly targeting professionals, while few dozens of posters (see Appendix 1) have been placed in
universities, at the University of Liège (Belgium) and at the MIT (United States).
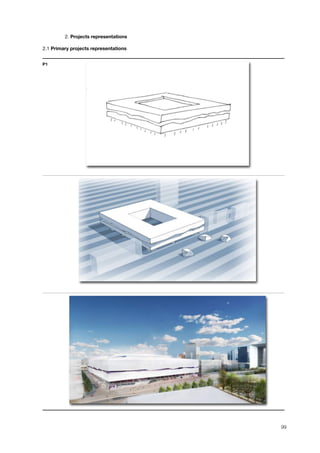
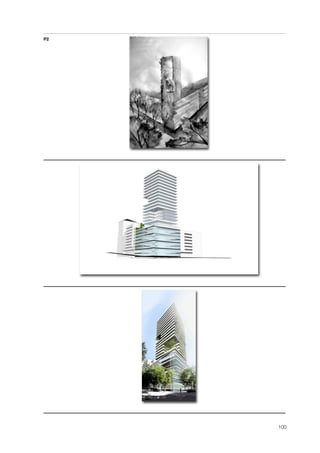
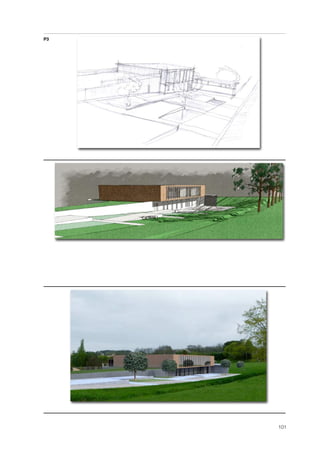
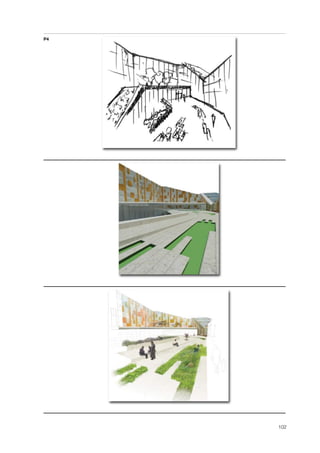
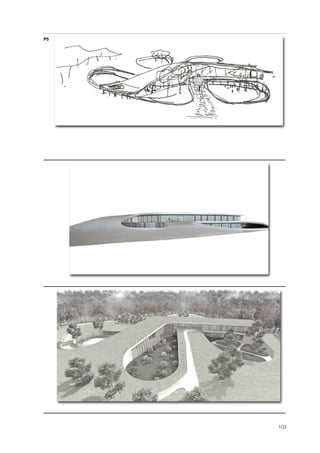
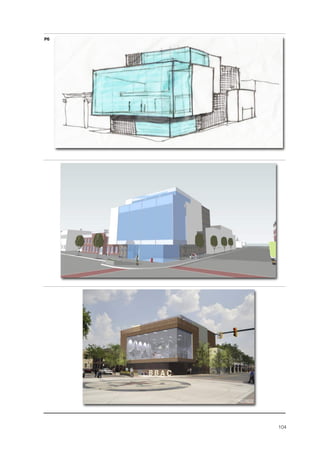
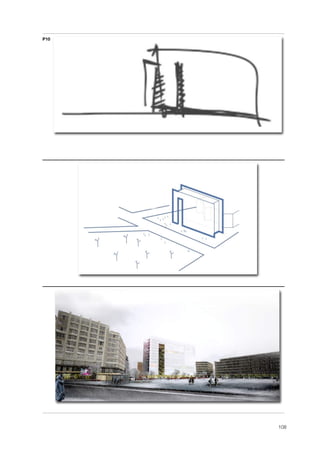
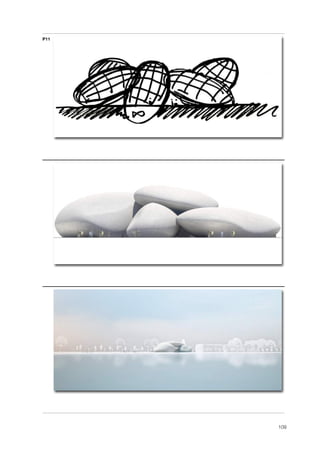
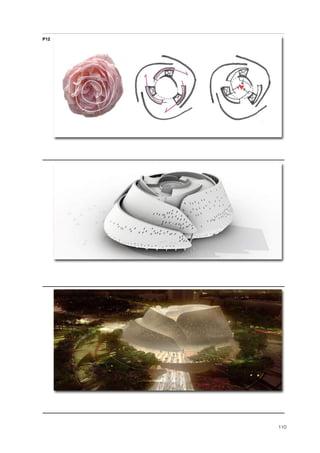
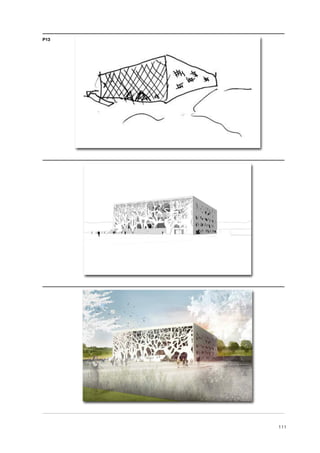
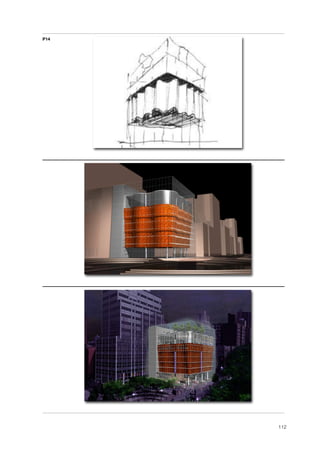
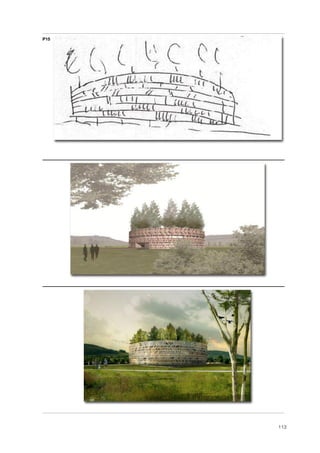
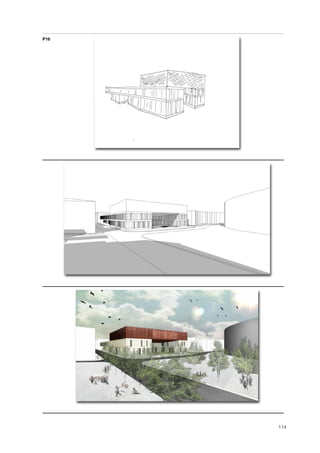
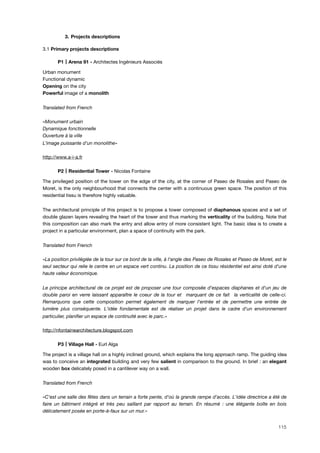
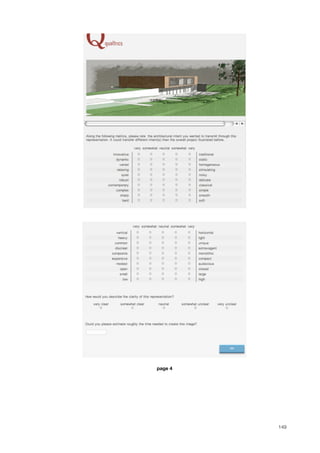
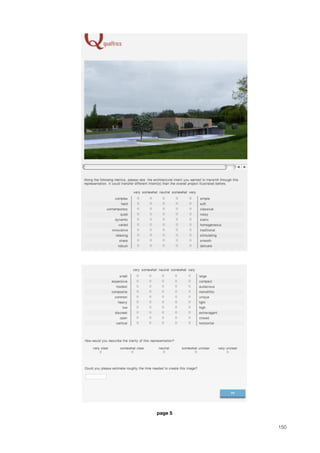
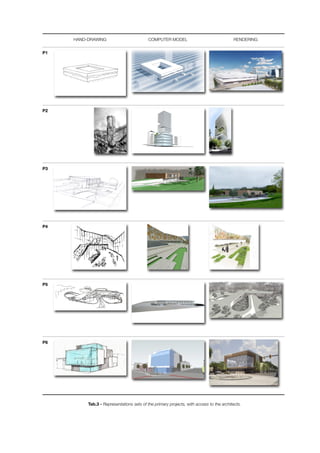
As our study is focusing on three main types of representations, each project provided must be illustrated
by each of them: (e.g. in Tab.3)
[-] one sketch or hand-drawing,
[-] one basic computer model (e.g. Sketchup model), and
[-] one computer rendering (e.g. Photoshop image).
Moreover, while each of these representations must represent a unique architectural project, they have to
show the artifact with the same point of view. This precaution is taken as we know that the angle of view
has an impact on people‘s perception of an object (Meitner, 2004). (see 2.2 Perception of architectural
representations)
The original set of representations included 11 projects from 8 architects and students, that is a total of 33
distinct representations. This number has been reduced to 6 projects from 6 architects and students for
two main reasons. First, some representations weren’t even approximatively depicting the same point of
view from one representation to another. Second, from one project to another we noticed very various
images within a type of representation. So, in order to maintain a relative consistency within a type of
representation, it has been decided not to include all the projects received. The 6 projects for which we
have direct and personal access to the architect constitute the primary projects data set. An overview of
the representations is showed below (Tab.3).
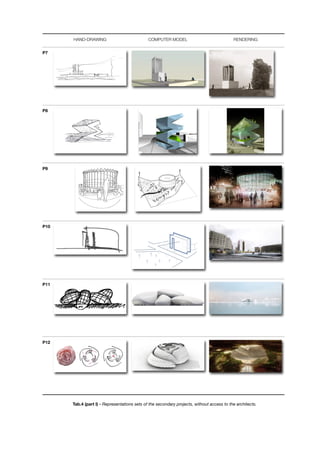
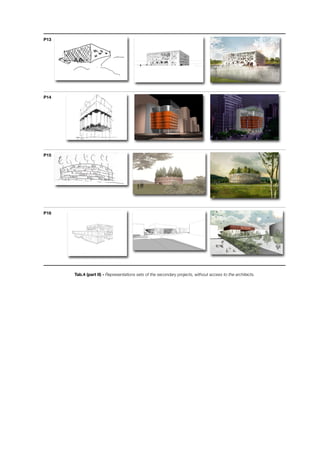
Nevertheless, with only 6 items collected for each type of representation, we had to raise the question of
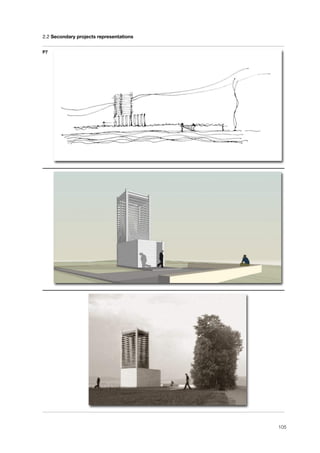
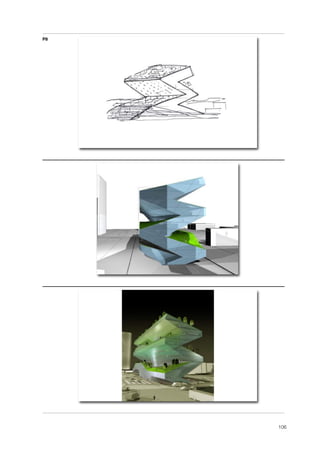
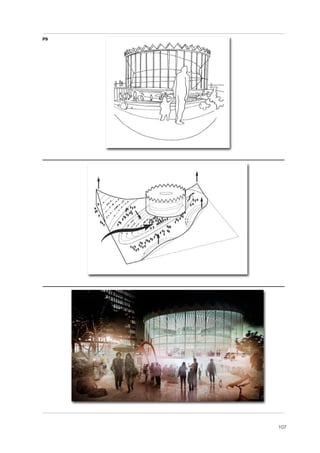
their representativeness. It was then necessary to look at a larger set of representations. On-line portfolios
and professionals’ websites were reviewed in order to find complementary representations. A secondary
projects data set complete the previous primary set.
While the conditions of the unique point of view and the relative consistency within a type of
representation had still to be met, other criteria were considered. For reasons explained further, there is a
need to have access to a descriptive text of the project and the intentions of the architects. Moreover,
diverse typologies and sizes of projects were researched, in order to form a diversified representations
set. The secondary projects data finally counted 11 additional sets of representations from 9 architects or
groups of architects. An overview of the representations is also showed below (Tab.4).
24](https://image.slidesharecdn.com/d5b3bf46-9a4a-4b77-a3e4-87f2841022d2-150813144529-lva1-app6892/85/TFE_MCunin-24-320.jpg)

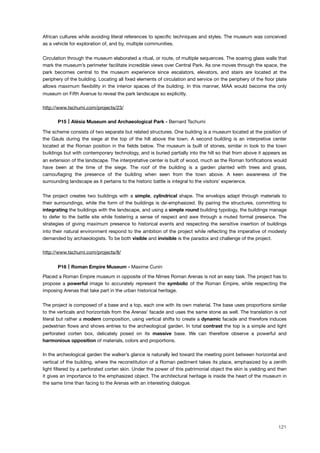
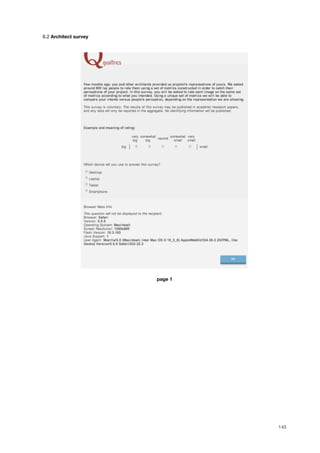
![! 4.3 Adjectives data base
Now than we have the necessary visual material for the study, we need to build the framework to catch
architects’ intents and people’s perception of these representations. Descriptions accompanying the
projects, either obtained directly from the architect or from their website and portfolios, constitute the
primary base to describe the architectural intent of each project (see Appendix 3).
A quick scan of the descriptions accompanying the projects reveals that intentions extensively rely on
adjectives, such as “verticality”, “enclosed” or “elegant”. Architects describe their intents using adjectives,
so it becomes logical to research lay-people’s perception using similar semantics, in order to be able to
compare responses from the two different populations.
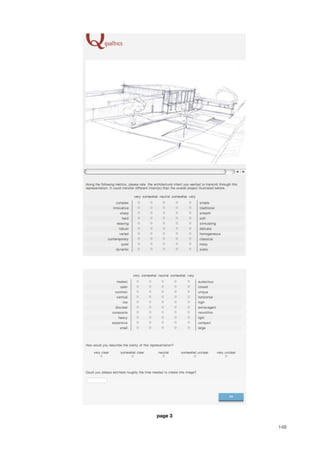
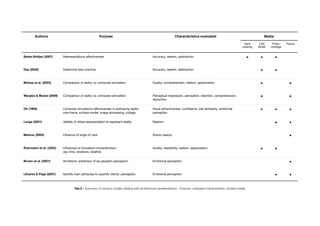
We then considered the Semantic Differential Method and Scale (Osgood et al.,1957) in order to assess
architects’ intents and people’s perception. This method consist to rate a set of attributes on a scale of
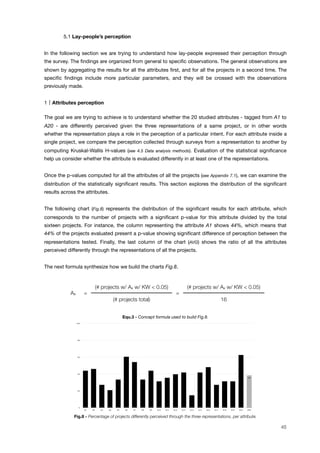
two bipolar adjectives, as showed below (Fig.3). As explained earlier (see 2.3 Depicting intents), several studies
employed this method in order to assess several attributes adapted to their specific purpose. In our case
the attributes relate to the architectural intent and its perception.
SEMANTIC DIFFERENTIAL SCALE
! very somewhat neutral somewhat very
‘A’ side" x x x x x ‘B’ side
Fig.3 - Semantic differential scale.
It has to be noticed that another method had been considered. Instead of asking people to rate a pair of
adjectives, we could also ask them to rate with which degree they agree or disagree with a single
statement, for instance «this building is vertical» (Alcantara et al., 2005). Nevertheless, with this method the
results would be very sensible to the understanding of the wording. For instance, light could be
understood as the opposite of dark, bright and heavy, which are very different intents. Moreover, the fact
that you clearly disagree with a statement does not necessarily mean that you clearly agree with the
opposite statement. For these reasons, we chose the Semantic Differential Method as defined by Osgood.
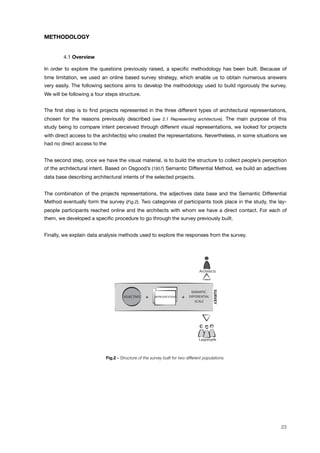
Then, we need to determine the semantic scales for the evaluation of the projects. The protocol we
developed is inspired by the method defined by Artacho-Ramirez (2008) and following the guidelines given
by Alcantara et al. (2005). The protocol is composed of four main steps to determine the attributes to be
rated (Fig.4) : [1] formation of the Initial Semantic Spaces, [2] passage to the Reduced Semantic Spaces,
[3] determination of the Final Semantic Space, and finally [4] choice of the bipolar adjectives to form the
Survey Semantic Space.
29](https://image.slidesharecdn.com/d5b3bf46-9a4a-4b77-a3e4-87f2841022d2-150813144529-lva1-app6892/85/TFE_MCunin-29-320.jpg)
![SEMANTIC
FITLER
COEXISTENCE
TEST
EXPERTS
FEEDBACK
REFERENCE REFERENCE
STUDY STUDY
FINAL SURVEY
INITIAL SPACES REDUCED SPACES FINAL SPACE SURVEY SPACE
Reviews
Portofolios
descriptions
Verbal/Written
Laypeople
SEMANTIC
DIFFERENTIAL
SCALE
REPRESENTATIONS+ +
Laypeople
Architects
SURVEY
SURVEY
SURVEY SPACE
SEMANTIC
FITLER
COEXISTENCE
TEST
EXPERTS
FEEDBACK
REFERENCE REFERENCE
STUDY STUDY
FINAL SURVEY
INITIAL SPACES REDUCED SPACES FINAL SPACE SURVEY SPACE
SEMANTIC
DIFFERENTIAL
SCALE
REPRESENTATIONS+ +
Laypeople
Architects
SURVEY
SURVEY
Fig.4 - Steps to determinate the Survey Semantic Space.
! [1] Initial Semantic Spaces
The first step is to analyse the descriptions of the 16 architectural projects - 6 primary and 10 secondary
projects - collected either from architects’ websites and portfolios or from the descriptions collected (see
Appendix 3.1 and 3.2). Note that some of them had to be translated from French or Spanish into English, with
the help from translator interns. For the 6 students’ projects and 10 professionals’ projects, adjectives
used in the descriptions are gathered to form the Initial Study Space, which includes 90 adjectives (Tab.6).
The question of representativeness of these adjectives is naturally raised. Those adjectives might not
reflect the only way to express intents in the practice. Consequently there is a need for more projects,
even without personal contact with the architects. Magazines and available portfolios provided us with
421 students’ and 39 professionals’ additional reference projects (see Appendix 3.3), totalizing 287
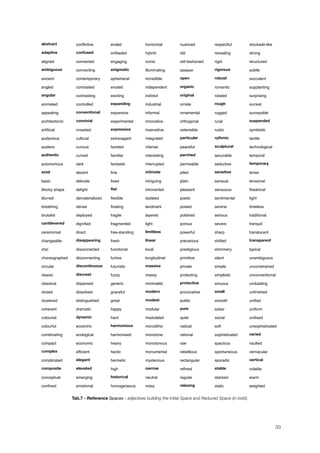
adjectives into the Initial Reference Space (Tab.7).
Interestingly, during this research we noticed that, in their descriptions, professionals used much more
diversified adjectives and flourished language than students did. It might be explained by the fact that
students have less space available to describe their projects. More importantly, it proves that
professionals become more and more confident with describing architectural projects, and develop more
complex language with growing expertise. That may lead to a certain mystification of the architecture
practice by using very abstract and complex language that lay-people don’t understand. This preliminary
observation underlines the importance of analysing descriptions of both students’ and professionals’
proposals.
30](https://image.slidesharecdn.com/d5b3bf46-9a4a-4b77-a3e4-87f2841022d2-150813144529-lva1-app6892/85/TFE_MCunin-30-320.jpg)
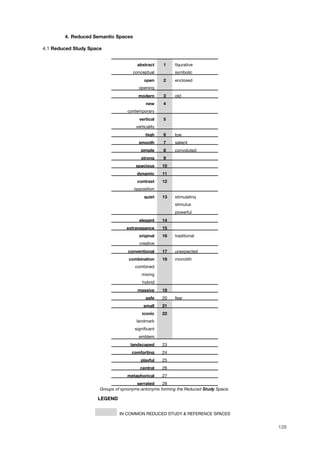
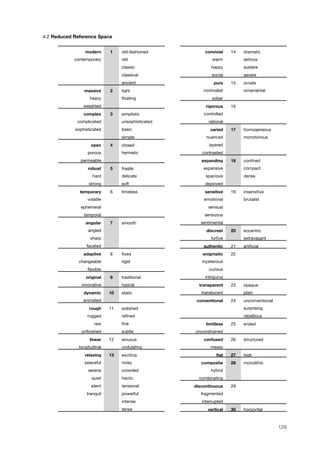
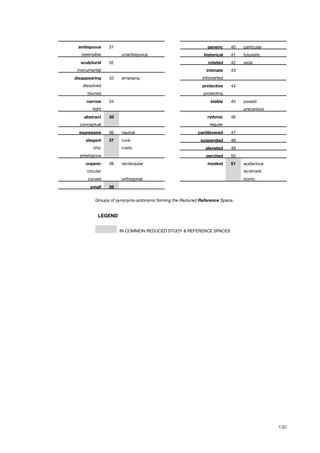
![! [2] Reduced Semantic Spaces
All the adjectives gathered so far are not relevant to our study. We need to avoid loss of reliability due to
subjects tiredness by using a too large number of attributes. Therefore, we used a Semantic Filter on the
previously built Initial Study Space and Initial Reference Space, to obtain Reduced Semantic Spaces, as
showed on the previous figure (Fig.4).
We considered several criteria to classify and to refine the choice of adjectives to finally introduce in our
survey. Some are inspired from other similar studies. The reduction criteria of synonyms and antonyms
elimination (Kuller, 1975), but also «adjectives related to materials, specialized terms and adjectives and
expressions indicating a purpose or a aim» (Jindo et al, 1995) are for instance considered here for inspiration.
Here under is the custom-made semantic filter following the proper purpose of our study :
[-] Synonyms - adjectives conveying similar architectural intents are grouped,
[-] Antonyms - redundant antonyms are grouped with their pair but conserved,
[-] Specific - specific language related to the abstract sphere (e.g. breathing), or specific
features of a project (e.g. vaulted) are filtered,
[-] Judgement of valor - irrelevant value judgments to the architectural intent are neglected,
[-] Other dimension - description of qualities that are visually absent of available
representations are also identified.
Adjectives meeting each of our filtering criteria are presented on its own layer in the following pages. This
semantic filter reduces the list to 28 groups of synonyms-antonyms for the Study Space, and to 51 for the
Reference Space, represented in bold on the tables Tab.6 and Tab.7. The situation is summarized by the
next table (Tab.5).
Study Reference
Number of projects studied
- students!
- professionals!
6
10
421
39
Number of adjectives
- Initial Semantic Space
- Reduced Semantic Space
90
28
287
51
Purpose Catch architect!s intent and lay-
people!s perception
Validate the Final Semantic
Space for intern assessment of
representativeness
Tab.5 - Characteristics of the Comparison and the Final Semantic Spaces.
31](https://image.slidesharecdn.com/d5b3bf46-9a4a-4b77-a3e4-87f2841022d2-150813144529-lva1-app6892/85/TFE_MCunin-31-320.jpg)
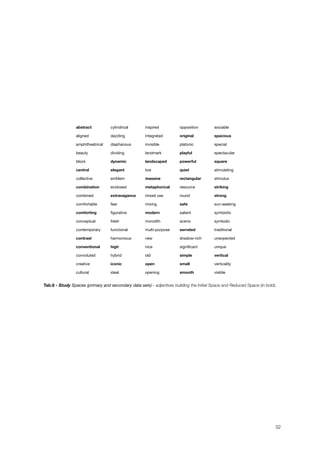
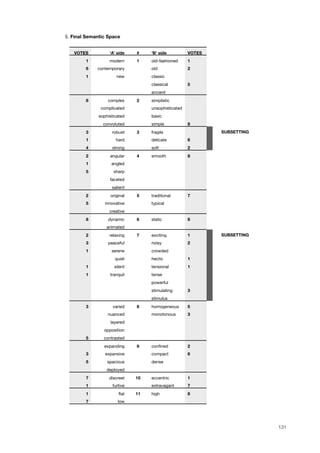
![! [3] Final Semantic Space
The Reduced Study Space sums up 28 groups of synonyms-antonyms (see Appendix 4.1), and while the
Reduced Reference Space 51 groups (see Appendix 4.2). Then we apply a simple co-existence test, each
adjective of the Reduced Study Space that also exists inside the Reduced Reference Space is considered
as sufficiently representative of a shared architectural vocabulary and goes directly into the Final Space.
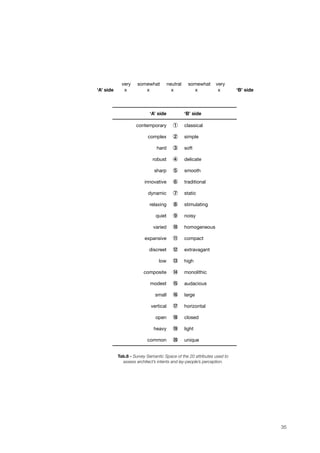
The Final Space (see Appendix 5) is a list of adjectives with synonyms and antonyms. The bipolar list forms
20 groups representing different semantic axis, or attributes, as it will be called for the rest of the study.
! [4] Survey Semantic Space
As previously said, each of the 20 attributes are represented by multiple bipolar adjectives. It is then
necessary to proceed to a choice of a unique pair of bipolar adjectives for each attributes, in order to form
our survey. In order to proceed to this choice, experts were called independently to chose a unique pair of
bipolar adjectives to represent each attributes.
This Final Space list has been send to 8 experts in order to choose one pair of bipolar adjectives for each
of the 20 attributes. The experts are either Mechanical Engineers specialized in the product design
practice, or Architectural Engineers specialized in the study of the design process. Results of their votes
can be consulted in appendix (see Appendix 5).
Additionally to the choice of adjectives pairs, they provided us with comments and feedback regarding to
the attributes themselves. This step is used as a validation step before building the final survey. It is
explained in longer details in appendix (see Appendix 5), but here are the main changes brought by experts’
feedback.
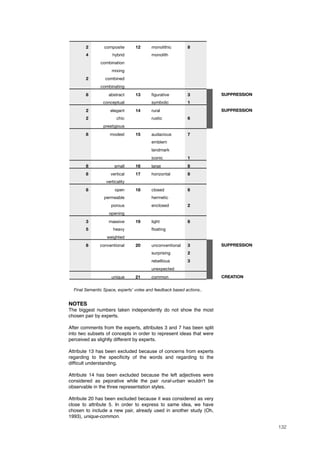
Among their comments, it has been acknowledge that the adjectives within some of the attributes were
representing slightly different intents. For the two concerned attributes (see Appendix 5), the decision of
splitting the attributes in two independent sets was then taken. Similarly, two different attributes have
been excluded because of concerns expressed by the experts about the potential difficult understanding
of the adjectives and about adjectives judged as pejorative. Finally, another attribute have been excluded
because it was considered to express the same intent than another attribute. This last attribute was then
replaced by another one expressing more clearly the subjacent intent.
It leads us to a list of 20 attributes composed of bipolar pairs, the Survey Semantic Space, used in the
study along with the Semantic Differential Scale (Tab.8). From now, we will call the attribute by its number
and a list is accessible from the back cover of the present work, in order to link the number with the
specific adjectives.
SEMANTIC
FITLER
COEXISTENCE
TEST
EXPERTS
FEEDBACK
REFERENCE REFERENCE
STUDY STUDY
FINAL SURVEY
INITIAL SPACES REDUCED SPACES FINAL SPACE SURVEY SPACE
Reviews
Portofolios
descriptions
Verbal/Written
SEMANTIC
DIFFERENTIAL
SCALE
ADJECTIVES REPRESENTATIONS+ +
Laypeople
Architects
SURVEY
Architects
SEMANTIC
FITLER
COEXISTENCE
TEST
EXPERTS
FEEDBACK
REFERENCE REFERENCE
STUDY STUDY
FINAL SURVEY
INITIAL SPACES REDUCED SPACES FINAL SPACE SURVEY SPACE
SEMANTIC
DIFFERENTIAL
SCALE
REPRESENTATIONS+ +
Laypeople
Architects
SURVEY
SURVEY
Fig.5 - Steps followed in order to build the survey.
34](https://image.slidesharecdn.com/d5b3bf46-9a4a-4b77-a3e4-87f2841022d2-150813144529-lva1-app6892/85/TFE_MCunin-34-320.jpg)
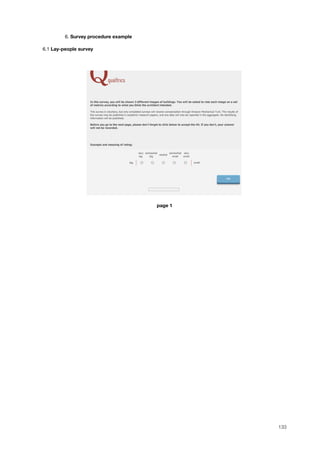
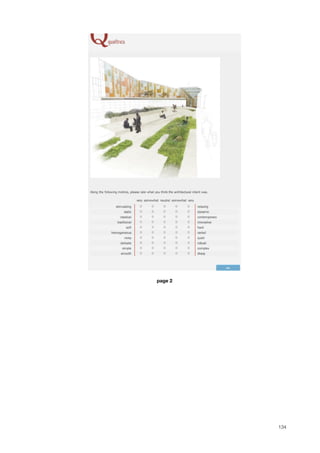
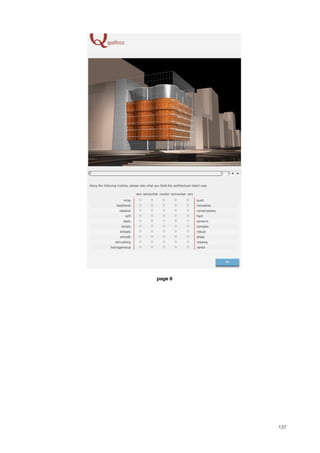
![! 4.4 Survey procedure
Now that we have the visual material and the framework to assess them, the survey can be built. Multiple
pilot surveys were conducted to gather feedback to improve the survey. The structure of the survey has
been revised, more precisely the moment to continue to the next page of the survey and the number of
attributes and images to be shown per page.
In order to evaluate the 48 images gathered, we used Amazon's online service, Mechanical Turk. After a
brief description about the tool itself, we describe the procedure followed by the two categories of
participants, lay-people and architects (Fig.6).
SEMANTIC
DIFFERENTIAL
SCALE
REPRESENTATIONS+ +
Laypeople
Architects
SURVEY
SURVEY
SURVEY SPACE
SEMANTIC
FITLER
COEXISTENCE
TEST
EXPERTS
FEEDBACK
REFERENCE REFERENCE
STUDY STUDY
FINAL SURVEY
INITIAL SPACES REDUCED SPACES FINAL SPACE SURVEY SPACE
SEMANTIC
DIFFERENTIAL
SCALE
REPRESENTATIONS+ +
Laypeople
Architects
SURVEY
SURVEY
Fig.6 - Components of the survey built to reach two categories of participants.
Mechanical Turk
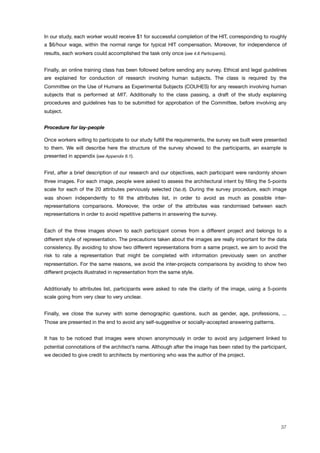
Mechanical Turk is a web-based crowdsourcing marketplace. Requesters post Human Intelligence Tasks
(HITs) and workers complete them, receiving financial compensation for their time and attention.
This is a powerful tool for collecting data from large populations quickly and easily. In the interest of
earning money with minimal efforts, we have to acknowledge the fact that some participants are not
putting much efforts to accomplished the task, resulting in poor quality answers, useless for the study.
Quality of responses has then to be verified in order to hopefully eliminate most of the dishonest
responses.
To answer to that issue, Mechanical Turk allows requesters to specify certain restrictions on workers who
would be interested in completing a HIT, such as their location or their approval rating. By setting a high
requirement on the HIT approval rating for workers, it has be proven that it can improve quality of
responses received (Mason and Suri, 2012).
Willing to gather quality answers, the following requirements were set. Mechanical Turk workers must
present a profile with :
[-] HIT Approval Rate for all Requesters’ HITs greater than or equal to 95%,
[-] Number of HITs Approved greater than or equal to 100,
[-] Location in United States.
36](https://image.slidesharecdn.com/d5b3bf46-9a4a-4b77-a3e4-87f2841022d2-150813144529-lva1-app6892/85/TFE_MCunin-36-320.jpg)
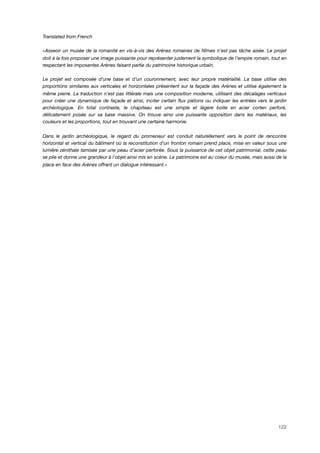
![! 4.5 Data analysis methods
Most usually, results gathered from a similar scale than used in the present study, are analyzed using two
main statistical tests, the ANOVA and the Student tests (e.g. Brown & Gifford, 2001; Imamoglu, 2000; Akalin et al.,
2009) .Although, to correctly apply this pair of tests the populations require to fulfill some assumptions, and
among others the populations tested must be normally distributed (Bluman, 2009, pp.448, 629). However we
are not able to affirm that the data follows a normal distribution for different reasons.
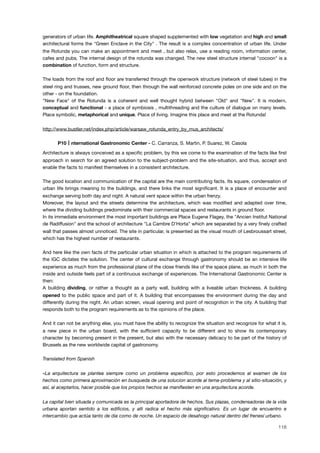
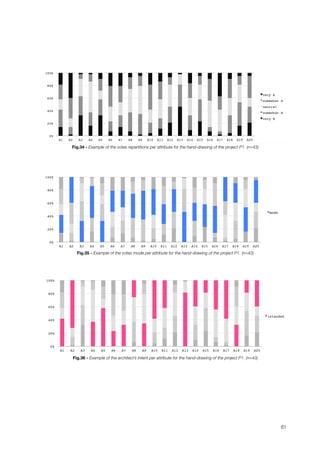
We are gathering the data on a 5-points scale as a ordinal variable. Below (Fig.7) stands one example of
the frequency distribution obtained from the survey, given one representation participants were asked to
rate each of the twenty attributes, being rated on a 5-points ordinal scale.
ATTRIBUTE EVALUATION
0
5
10
15
20
25
!"#$%&
very somewhat neutral somewhat very
‘A’ side x x x x x ‘B’ side
Fig.7 - Example of the frequency distribution extracted from the survey data.
It is obvious that the distribution is not symmetrically dispersed around the mean value, and not bell-
shaped. Yet, symmetry and bell-shaped distribution are part of the assumptions for any normal
distribution (Bluman, 2009, p.303). Since basic assumptions of normally distributed populations are not met,
we need to use a different pair of statistical tests.
The ANOVA and Student tests are called parametric tests because there are making assumptions on the
probability distribution. The Kruskal-Wallis and Mann-Whitney tests are considered the non-parametric
alternatives to the one-way ANOVA and the Student tests, respectively (Ref.2). The big difference of the
non-parametric alternatives is that they are not making any assumption on the distribution, and therefore
may be a better fit to our set of data.
Few assumptions are required in order to properly apply the Kruskal-Wallis and the Mann-Whitney tests
(Ref.2).
[-] the dependent variable must be in the order of the ordinal or continuous
level,
[-] the independent variable must be constituted of independent groups,
[-] the observations must be independent within each group or between the groups
themselves.
The data we are gathering actually fulfills these assumptions for the following reasons. Firstly, we use a 5-
points scale to collect the data which is the definition of an ordinal variable.
39](https://image.slidesharecdn.com/d5b3bf46-9a4a-4b77-a3e4-87f2841022d2-150813144529-lva1-app6892/85/TFE_MCunin-39-320.jpg)
![The Kruskal-Wallis test is working with the following hypotheses :
[H0] ! There is no difference of perception of that specific attribute between the
three different representations.
[H1] ! There is a difference of perception of that specific attribute between the
three different representations.
The larger the H-value is, the more likely the samples come from different populations. Moreover, if the H-
value is large enough, the null hypothesis H0 will be rejected. On the opposite, the smaller the H-value is,
the less likely the samples come from different populations. Therefore, the hypothesis H1 will not be
rejected.
From this H-values, we can calculate the probability of rejecting the null hypothesis H0 when that
hypothesis was true, which is called the p-values. In other words, the larger the p-value is, the more we
can mistakingly affirm that there are significant differences of perception between the three different
representations. Meaning, the p-value is the probability to make a wrong decision.
We define a significance level, called alpha. Under this alpha level, p-values can reasonably be considered
small enough not to mistakenly lead to the rejection of the null hypothesis H0 while it was true. In human
behavioral studies, it is common to use an alpha level of 0.05 as statistical significance, which will be
similarly applied in our study.
Hence each sample sizes count more than five individuals, the distribution of the responses can be
approximated by the chi-square distribution. This is a statistical artifact to facilitate the numerical
computation of the p-values with the H-values correspondent, by allowing us to use chi-square values
automatically computed by specialized softwares, such as Matlab.
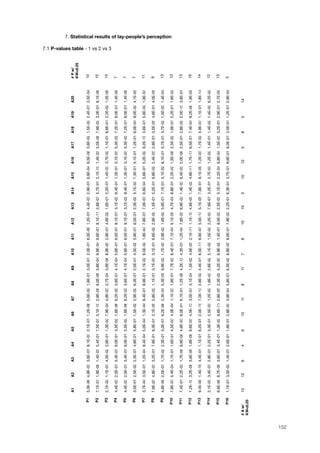
The p-values are computed for each of the 20 attributes from all the 16 projects. A table showing all the
numerical results is presented for reference in the appendix (see Appendix 7.1).
41](https://image.slidesharecdn.com/d5b3bf46-9a4a-4b77-a3e4-87f2841022d2-150813144529-lva1-app6892/85/TFE_MCunin-41-320.jpg)
![Mann-Whitney test
The Mann-Whitney test is the non-parametric alternative to the independent Student t-test. Here again it
is used to determine whether there are statistically significant differences of perception between the three
representations picturing a single project. It constitutes an extension of the Kruskal-Wallis test by
comparing pairs of representations to determine which ones are different from the others (Ref.3).
In order to apply the Mann-Whitney test we follow the same process as previously and compute the
Mann-Whitney U-values with the following formula (Levine et al., 2008, p. 490) :
U1 = n1 n2 +
n1 (n1+1)
! R1U1 = n1 n2 +
2
! R1
U2 = n1 n2 +
n2 (n2+1)
! R2U2 = n1 n2 +
2
! R2
Equ.2 - Equation of Mann-Whitney U-value.
where Rk = sum of ranks of sample k
nk = size of sample k = number total of votes per representation
The Mann-Whitney test is working with the same hypotheses as previously stated :
[H0] ! There is no difference of perception of that specific attribute between the
two different representations.
[H1] ! There is a difference of perception of that specific attribute between the
two different representations.
The interpretations of the values obtain are similar to the precedent test. If the U value is large enough the
null hypothesis will be rejected, which means that there are statistically significant differences between the
representations. Note that here again we are using an alpha level of 0.05 for statistical significance.
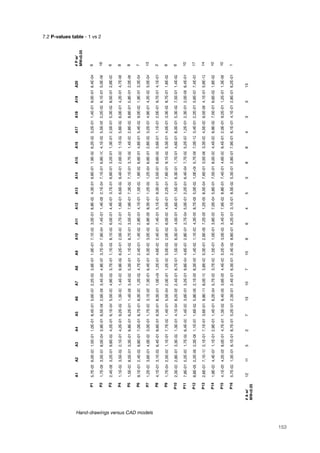
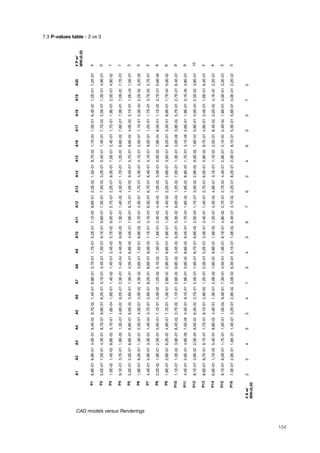
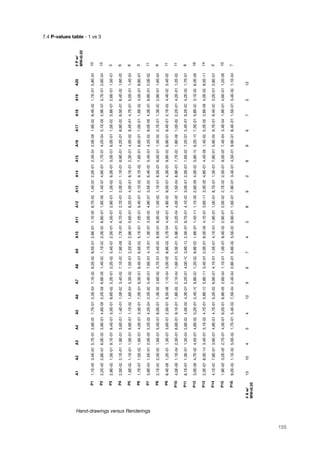
The p-values are computed for each pairs of representations for the twenty attributes from all the sixteen
projects. The numerical values are enlisted in appendix (see Appendix from 7.2 to 7.4).
42](https://image.slidesharecdn.com/d5b3bf46-9a4a-4b77-a3e4-87f2841022d2-150813144529-lva1-app6892/85/TFE_MCunin-42-320.jpg)
![! 4.6 Participants
Lay-people
We send 880 surveys through Amazon Mechanical Turk. After having completed the batch, we realized
that all the answers did not have the same quality and some answers were clearly unusable. We then
undertook a cleanup of the data.
In order to get rid of useless data, we defined some clear guidelines to clean the data. If a survey fulfilled
one of the next criteria, it was considered unusable and therefore it was not be included in the next steps
of our research:
[1] The survey has been completed far too quickly to having been taken seriously :
after the first iterations of the survey we considered the boundary of 3 minutes
under which was too fast - 90 surveys excluded.
[2] All the answers from the survey are identical : in order to click as fast as
possible the participant only click on the left or right side of the checkboxes -
17 surveys excluded.
[3] Several surveys were completed by the same IP address and so probably by
the same person, which goes against one of our precautions to gather
independent answers - 87 surveys excluded.
After the cleaning of the data, 686 surveys were remaining, representing close to 78% of the total number
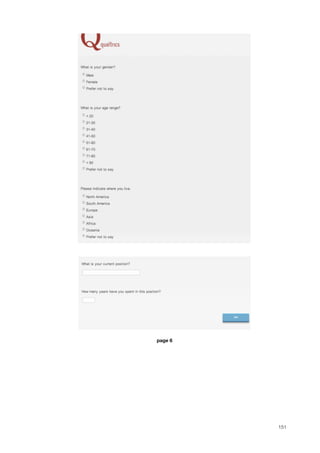
of surveys sent. In the remaining surveys the parity male-female is close to be respected with 57.8% of
the surveys answered by men, and 41.7% by women. The median age of the participants is the range
31-40 years old and they are North American almost exclusively, which is a consequence of the way we
designed the survey (see 4.4 Survey procedure). The average time needed to complete the survey was 7
minutes and 1 second.
Architects
As already said (see 4.4 Survey procedure), the architects answering the survey are the persons who provided
us with representations for our study. Amongst the 16 projects included in this study, we had access to 6
persons performing in the architecture practice, 3 professionals and 3 students. They are between 21 and
60 years old and the gender split is 4 men for 2 women. Amongst them, 2 practice in Belgium, 2 in France
and 2 in the US. They took the survey in an average time of 8 minutes and 49 seconds.
Again, it is important to notice that the architects we surveyed were asked to answer only on the
representations of their own projects. In this way we can have access to their intentions without implying a
comparison with others’ work or any sense of competition.
43](https://image.slidesharecdn.com/d5b3bf46-9a4a-4b77-a3e4-87f2841022d2-150813144529-lva1-app6892/85/TFE_MCunin-43-320.jpg)

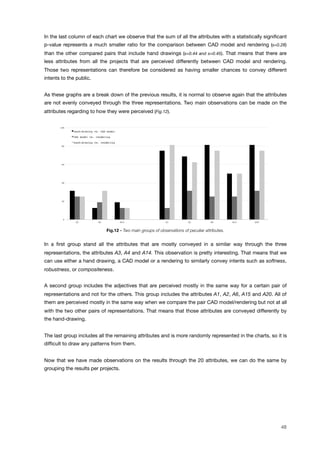
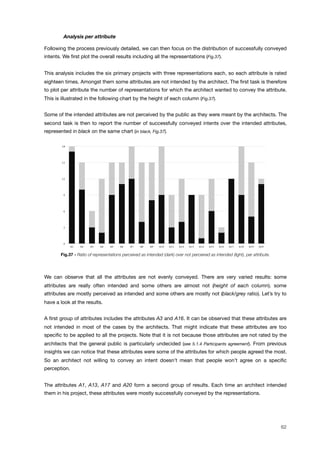

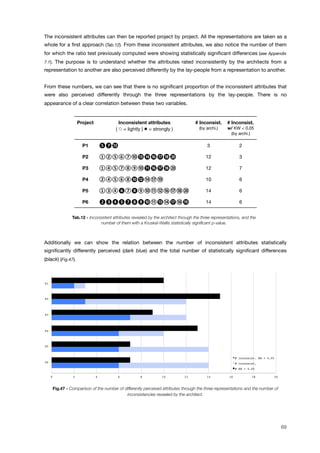
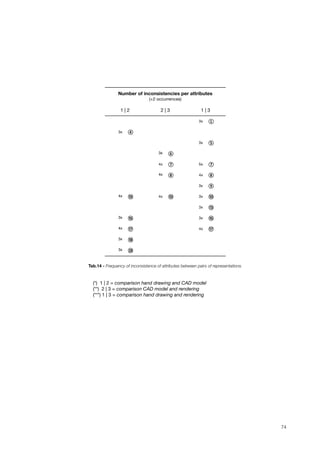
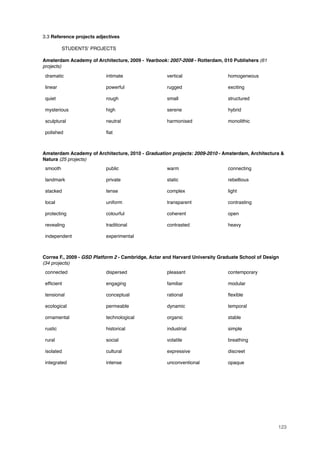
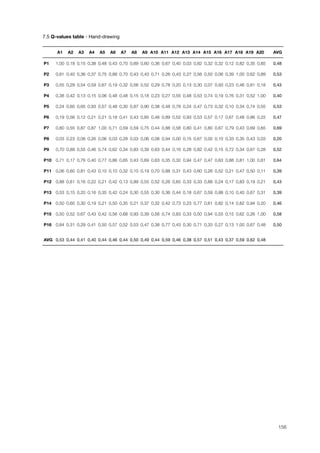
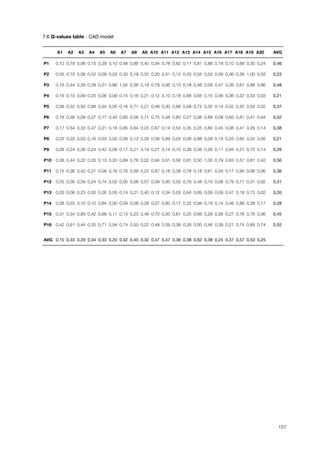
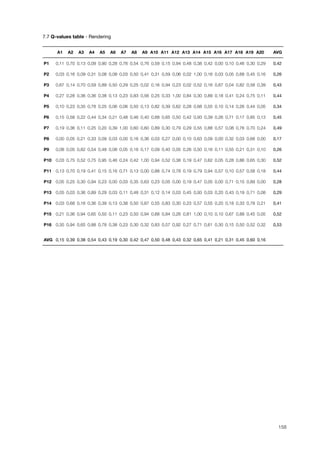
![[1] We can notice that the attributes A4 (robust-delicate) and A14 (composite-
monolithic) are mostly perceived in the same way by the lay-people through
the three representations, but not as intended by the architect. That means
that the representations convey evenly this intention but mostly not as
initially aimed by the architect. Note that the attribute A14 is presenting a
low level of agreement among lay-people’s votes, which indicates that the
perception is the same through the three representations while being highly
undecided.
[2] Next, we observe that the attribute A7 (dynamic-static), being often intended
by the architects, is highly differently perceived by the lay-people while it is
highly inconsistently rated by the architects. Then, despite the frequent use
of this attribute by the architects, they assessed this attribute as it would
convey differently in the representations. This shows that despite they intend
extensively the degree of movement of a design proposal, they have the
perception that it would be conveyed differently through the representations,
which is verified by the high degree of differences of lay-people’s
perception.
[3] It is also interesting to observe that the attribute A17 (vertical-horizontal) is
highly inconsistently rated by the architects from a representation to another,
and in the same time the same attribute is highly successfully conveyed to
the lay-people through the representations. This paradox shows that,
despite architects’ acknowledgment that the representations are conveying
different intents, they succeed to convey through the representations the
degree of verticalness of an architectural proposal.
[4] And finally, there is another paradox. For the attribute A20 (common-unique),
we observe that the representations are mostly perceived as different by the
lay-people, but in the same time, they seem to convey mostly faithfully the
architect’s intent regarding to the degree of uniqueness of the proposal. It
might be explained by the design of our metrics. On one hand, the success
of conveyance of the attribute is explained by the fact that the bigger
number of lay-people’s votes is most of the time matching with the
architect’s intent. On the other hand, very diversified distributions of the
other remaining votes are explaining the differences of perception of the
representations.
76](https://image.slidesharecdn.com/d5b3bf46-9a4a-4b77-a3e4-87f2841022d2-150813144529-lva1-app6892/85/TFE_MCunin-76-320.jpg)


![Sheppard, S.R.J., 1989. Visual Simulation: A User's Guide for Architects, Engineers, and Planners. Van
Nostrand Reinhold (Publisher), New York, USA.
Sheppard, S.R.J., 2001. Guidance for crystal ball gazers: developing a code of ethics for landscape
visualization. Landscape and Urban Planning, 54(1), pp.183-199.
Sheppard, S.R.J., Meitner, M.J., 2005. Using multi-criteria analysis and visualization for sustainable forest
management planning with stakeholder groups. Forest Ecology and Management, 207(2), pp.171-187.
Shu, E., 2000. Touch versus tech: hand-drawn or computer-rendered techniques. Architectural Record, 188(12),
pp.170-173.
Steinitz, C., 1991. Some words of caution. Landscape Urban Planning, 21(4), pp.273-274.
Strothotte, T., 1994. How to render frames and influence people. Eurographics, 13(3), pp.C455–C486.
Summers, J., Shah, J., 2004. Representation in engineering design: a framework for classification. In :
Proceedings of ASME 2005 international design engineering technical conferences and computers and
information in engineering conference, Salt Lake City, USA, Paper No. DTM DETC-2004-57514.
Suwa, M., Tversky, B., 1997. What do architects and students perceive in their design sketches? A protocol
analysis. Design Studies, 18(4), pp.385-403.
Tversky, B., Morrison, J. B., Betrancourt, M., 2002. Animation: can it facilitate? International Journal of
Human-Computer Studies, 57(4), pp.247-262.
Van Leeuwen, T., Jewitt, C., 2001. Handbook of visual analysis. Sage Publications, London, UK.
Verdonck, E., Weytjens, L., Verbeeck, G., Froyen, H., 2011. Design support tools in practice: The architects'
perspective. In: Leclercq, P., Heylighen, A., Geneviève, M. (eds), CAAD Futures 2011 Proceedings of the 14th
International Conference on Computer-Aided Architectural Design, Liège, BE, pp.769-784.
Wergles, N., Muhar, A., 2009. The role of computer visualization in the communication of urban design—A
comparison of viewer responses to visualizations versus on-site visits. Landscape and Urban Planning, 91(4),
pp.171–182.
Zube, E. H., Simcox, D. E., Law, C. S., 1987. Perceptual landscape simulations: history and prospect.
Landscape Journal, 6(1), pp.62-80.
! WEB REFERENCES
(Ref.1) Basulto, D., 2012. The architect at work: 425 Park Ave. In: ArchDaily, 5th December 2012.
<http://www.archdaily.com/?p=302247> [Visited 12.10.2014]
(Ref.2) Kruskal-Wallis H Test using SPSS Statistics. In: Statistics Laerd.
<https://statistics.laerd.com/spss-tutorials/kruskal-wallis-h-test-using-spss-statistics.php> [Visited 03.21.2014]
(Ref.3) Mann-Whitney U Test using SPSS. In: Statistics Laerd.
<https://statistics.laerd.com/spss-tutorials/mann-whitney-u-test-using-spss-statistics.php> [Visited 03.21.2014]
! DICTIONARY REFERENCE
«representation», «perception», «intend». In: The Oxford American college dictionary, 2002. Oxford University
Press (Ed.), G.P. Putnam's Sons (Publisher), New York, USA.
90](https://image.slidesharecdn.com/d5b3bf46-9a4a-4b77-a3e4-87f2841022d2-150813144529-lva1-app6892/85/TFE_MCunin-90-320.jpg)