Download to read offline


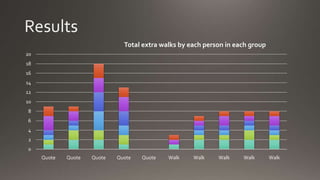


This graph shows the total number of extra daily walks taken by different groups as the number of extra daily walks per person increases from 0 to 5. The "Walk Only" group sees a linear increase in total extra walks as each additional person walks more each day. The "Quote" groups, which include both walkers and non-walkers, see a slower sub-linear increase as not all members of the group increase their daily walks.


