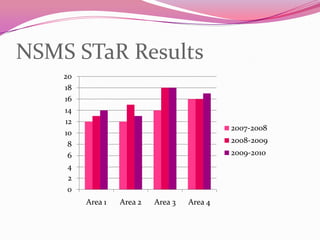
The STaR Chart is used in Texas to assess schools' progress in achieving technology goals across four key areas: Teaching and Learning, Educator Preparation and Development, Administration and Instructional Support, and Infrastructure for Technology. The document discusses each area and shows that North Shore Middle School is currently at Developing or Advanced levels of progress but aims to reach the Target level in all areas by working together over the 2010-2011 school year.
Pretende-se com esta apresentação que sejam relembradas as razões trigonométricas, sendo indicados alguns problemas que podem ser resolvidos através da utilização das mesmas. Será apresentado se possível também um vídeo sobre o assunto (video da Khan Academy)
Apresentação feita por: Helena Correia.
Strategies To Navigate Through A Financial Stormwegnercpas
A financial storm comes when factors beyond our control, create a crisis that we must respond to in order to preserve and protect our agency or program. Understand what types of financial storms might occur, identify financial risks and how to minimize them, how to develop contingency plans to respond to the potential for them, the role of reserves and how to determine what is necessary, understand the difference between cash flow management and cash flow forecasting.
If you want to improve your chances of winning a DMA Award this year you should not miss this fun and engaging event. Our awards experts will talk with you in small groups and will cover everything from presenting your creative work to the categories you should be entering.
Agile Transitions and Facilitation - The harder you push, the harder the syst...Stefano Lucantoni
Which are the tools that more than others a "change agent" should master?
What could help us to reduce resistance to change and at the same time limit the dependency from the coaches that risk to become the authorities delegated lead the change?
This presentation is about a key aspect of agile transitions: “facilitation”; and how it can start a real and sustainable change expecially when it is expressed in its more open and inclusive forms.
1. Texas STaR Chart Created and Presented by: Jennifer Lawrence 7th grade Math Teacher North Shore Middle School Galena Park ISD
2. What is the Star Chart? More importantly… What does it mean to us??
3. What is the Star Chart? STaR : School Technology and Readiness The STaR Chart is used by campuses to assess progress being made towards goals set by the Texas Long Range Plan for Technology.
4. What is the STaR Chart? Developed around four key areas: Teaching and Learning, Educator Preparation and Development, Administration and Instructional Support, and Infrastructure for Technology. Site- http://starchart.esc12.net
5. Teaching and Learning Patterns of classroom use Content area connections Frequency and design of Instructional Strategies TEKS Implementation Student Mastery of Technology Applications Online Learning
6. Educator Preparation and Development Professional Development Experiences Models of Professional Development Capabilities of Educators Access to Professional Development Levels of Understanding and Patterns of Use Professional Development for Online Learning
7. Administration and Instructional Support Leadership and Vision Planning Instructional Support Communication and Collaboration Budget Leadership and Support for Online Learning
8. Infrastructure for Technology Students per Computers Internet Access Connectivity Speed Other Classroom Technology Technical Support Local Area Network Wide Area Network Distance Learning Capacity
12. We can have even better results in 2010-2011 ! If we all work together, North Shore Middle School can reach our Target goal in each of the four areas. By 2020, every school a crossed the nation should achieve technology excellence. Maybe our school can be one of the first!