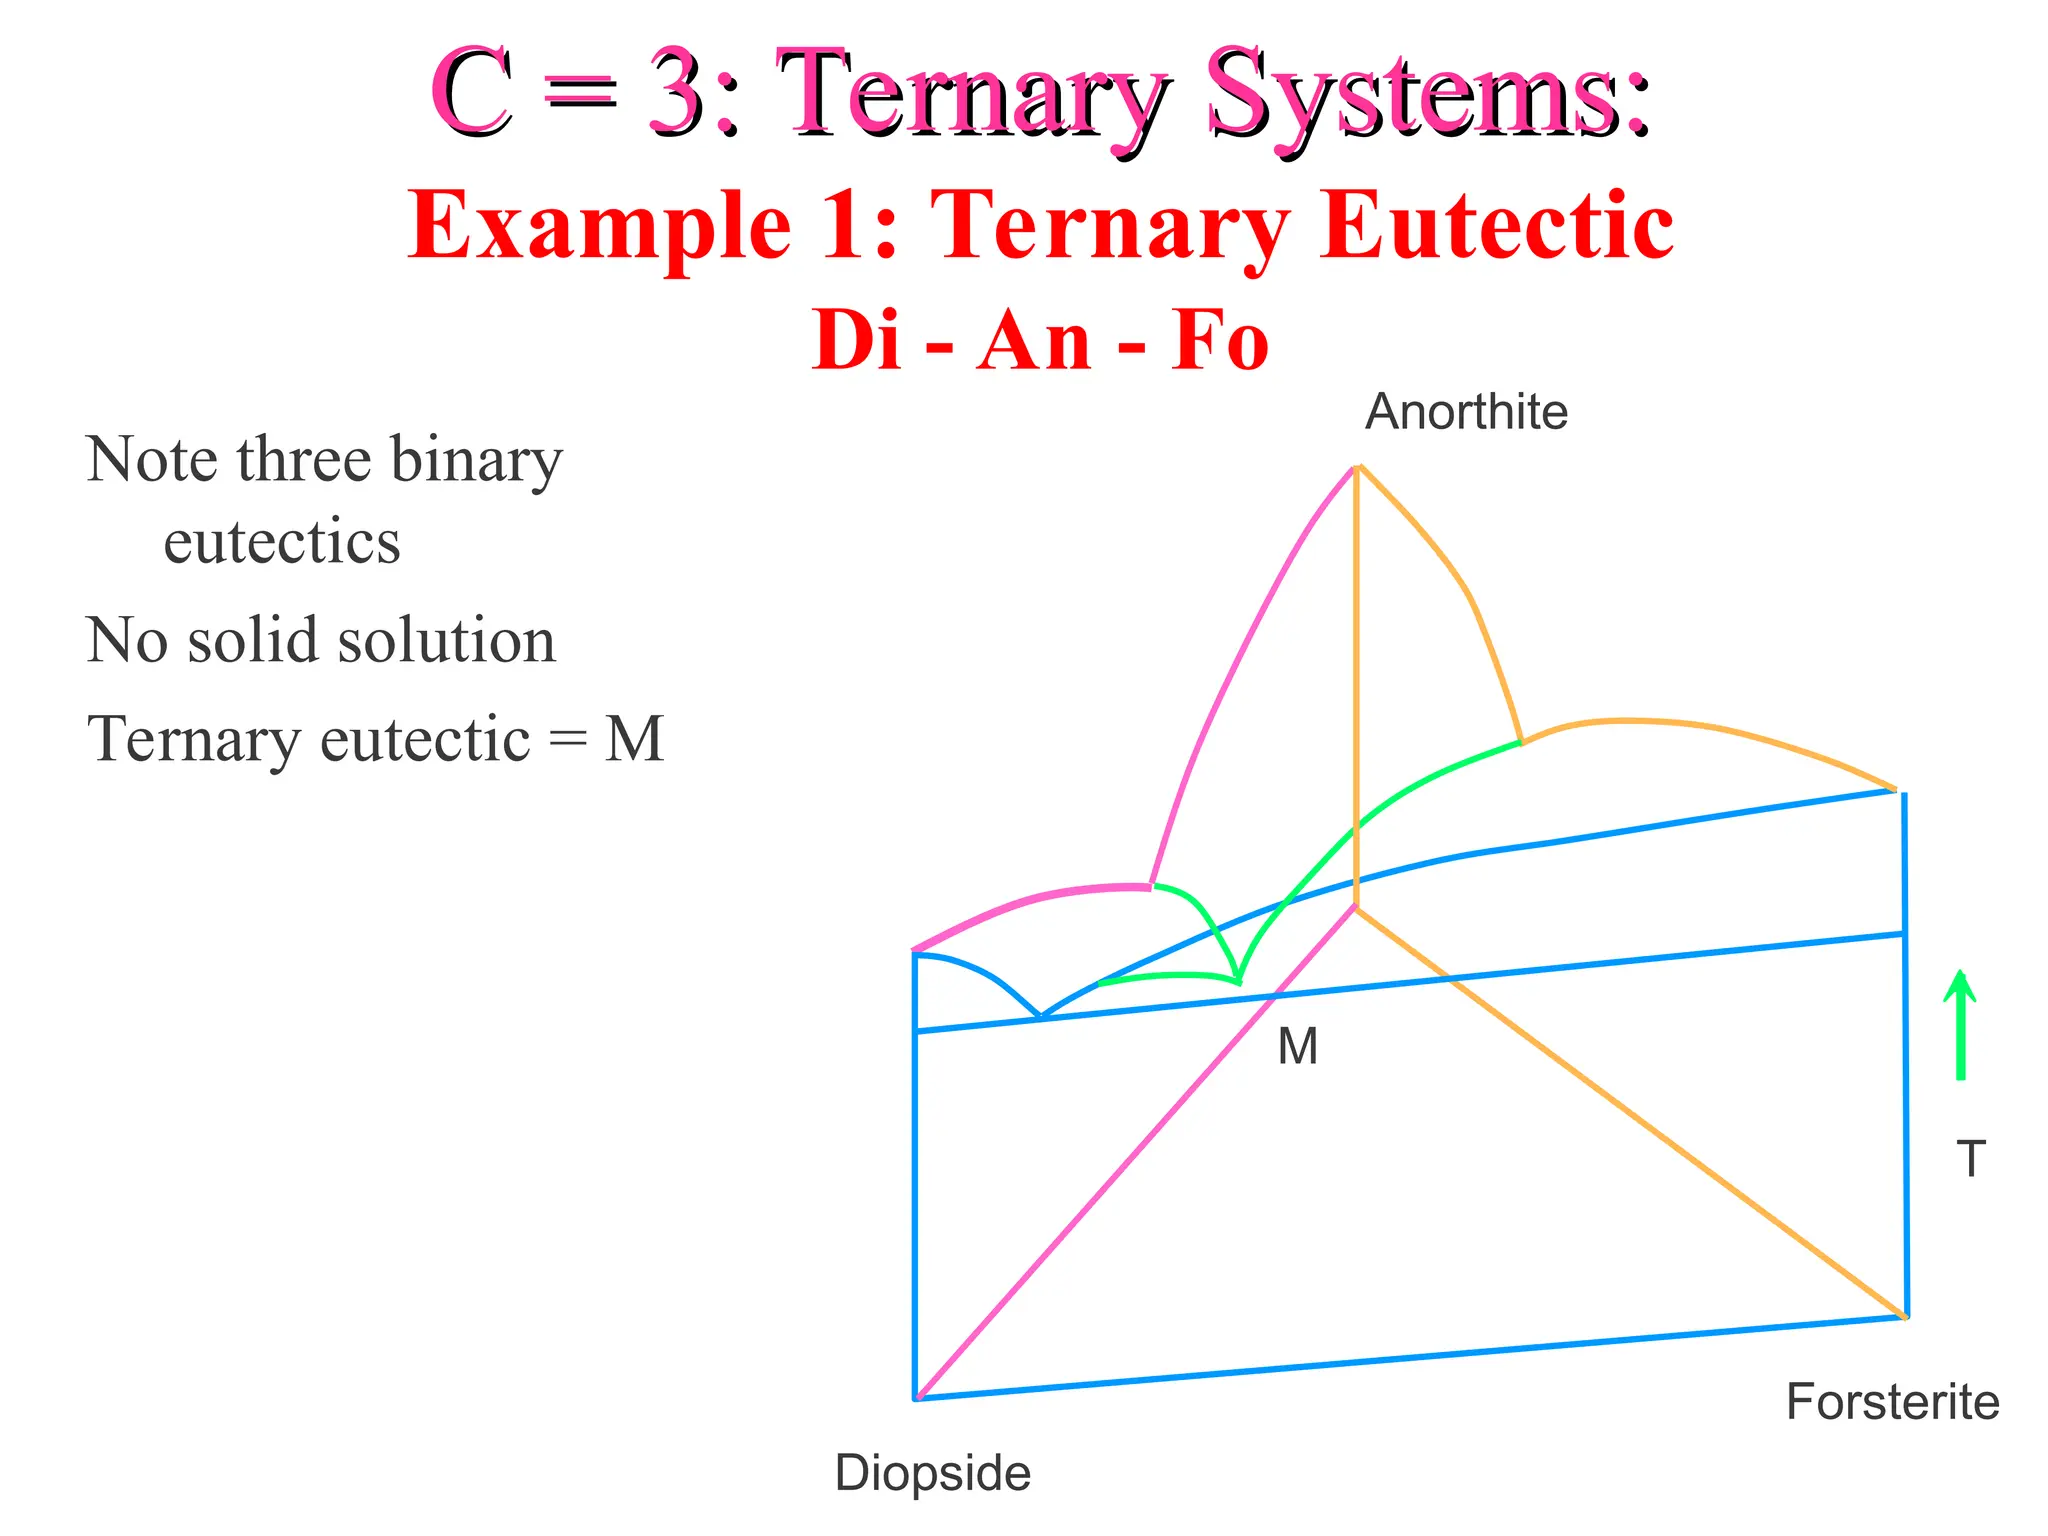
C = 3: Ternary Systems:
Example 1: Ternary Eutectic
Di - An - Fo
T
M
Anorthite
Forsterite
Diopside
Note three binary
eutectics
No solid solution
Ternary eutectic = M
T - X Projection of Di - An - Fo
Figure 7.2. Isobaric
diagram illustrating
the liquidus
temperatures in the
Di-An-Fo system at
atmospheric pressure
(0.1 MPa). After
Bowen (1915), A. J.
Sci., and Morse
(1994), Basalts and
Phase Diagrams.
Krieger Publishers.
Crystallization Relationships
An + Liq
Liquid
Di + Liq
Di + An
a
An
Pure Fo forms
Just as in binary
 = ?
F = ?
  = 2 (Fo + Liq)
 F = 3 - 2 + 1 = 2
If on liquidus, need to specify
only 2 intensive variables
to determine the system
 T and or
 and
X of pure Fo is fixed
XAn
liq
XAn
liq
XFo
liq
Lever principle  relative proportions of liquid & Fo
 At 1500o
C
 Liq x + Fo = bulk a
 x/Fo = a-Fo/x-a
 New continuous reaction as liquid follows cotectic:
LiqA
 LiqB + Fo + Di
 Bulk solid extract
 Di/Fo in bulk solid extract using lever principle
1400
1300
1500
1274
1270
1392
Diopside
D
i
+
L
i
q
M
b
c
Fo + Liq
1387
 At 1300o
C liquid = X
 Imagine triangular plane X - Di - Fo balanced on bulk a
Liq/total solids = a-m/Liq-a
total Di/Fo = m-Fo/Di-m
a
Di
Liq x
Fo
m
Partial Melting (remove melt):
Ternary Peritectic Systems:
(at 0.1 MPa)
Figure 7.4. Isobaric
diagram illustrating
the cotectic and
peritectic curves in
the system forsterite-
anorthite-silica at 0.1
MPa. After Anderson
(1915) A. J. Sci., and
Irvine (1975) CIW
Yearb. 74.
3 binary systems:
Fo-An eutectic
An-SiO2 eutectic
Fo-SiO2 peritectic
1890
Fo En
Forsterite + Liq
E
n
s
t
a
t
i
t
e
+
L
i
q
a
b
y
y
x
Works the same way as the Fo - En - SiO
Works the same way as the Fo - En - SiO2
2 binary
binary
i
k
Fo En
1557
Fo En
Forsterite + Liq
E
n
s
t
a
t
i
t
e
+
L
i
q
e b
f
Diopside-Albite-Anorthite
Di - An eutectic
Di - Ab eutectic
Ab - An solid solution
Figure 7.5. Isobaric
diagram illustrating the
liquidus temperatures
in the system diopside-
anorthite-albite at
atmospheric pressure
(0.1 MPa). After Morse
(1994), Basalts and
Phase Diagrams.
Krieger Publushers
Isobaric
Isobaric
polythermal
polythermal
projection
projection
Figure 7.5. Isobaric
diagram illustrating the
liquidus temperatures in
the system diopside-
anorthite-albite at
atmospheric pressure
(0.1 MPa). After Morse
(1994), Basalts and
Phase Diagrams. Krieger
Publishers.
Note:
Note:
Binary character is usually maintained
when a new component is added
 Eutectic behavior remains eutectic
 Peritectic behavior remains peritectic
 Solid solutions remain so as well
Oblique
View
Isothermal
Section
Figure 7.8. Oblique view illustrating an isothermal section through the diopside-albite-anorthite
system. Figure 7.9. Isothermal section at 1250o
C (and 0.1 MPa) in the system Di-An-Ab. Both from
Morse (1994), Basalts and Phase Diagrams. Krieger Publishers.
Ternary Feldspars
Ternary Feldspars
1118
Ab 20 40 60 80 An
1100
1200
1300
1400
1500
1557
T C
o
Plagioclase
Liquid
Liquid
plus
Liquidus
Solidu
s
Weight % An
Plagioclase
Or
Ab
Ab-rich feldspar
+ liquid
liquid
single feldspar
two feldspars
1200
1000
800
Temperature
o
C
Wt.%
a
c
b
d
e
f
g h
i
j
k
solvus
s
oidus
liquidus
Or-rich feldspar
+ liquid
Figure 7-10. After Carmichael et al.
(1974), Igneous Petrology. McGraw Hill.
Ternary Feldspars
Ternary Feldspars
Trace of solvus
at three
temperature
intervals
Triangle shows coexisting
feldspars and liquid at
900o
C
Figure 7.11. Winter (2010) An
Introduction to Igneous and
Metamorphic Petrology. Prentice
Hall.
4 - Component Diagrams
y
An
Figure 7.12. The system
diopside-anorthite-
albite-forsterite. After
Yoder and Tilley (1962).
J. Petrol.
> 4 Components
> 4 Components
Figure 7.13. Pressure-temperature
phase diagram for the melting of a
Snake River (Idaho, USA) tholeiitic
basalt under anhydrous conditions.
After Thompson (1972). Carnegie
Inst. Wash Yb. 71
olivine Calcic plagioclase
Mg pyroxene
Mg-Ca pyroxene
amphibole
biotite
(Spinel)
Tempe
rature
potash feldspar
muscovite
quartz
alkalic plagioclase
Calci-alkalic plagioclase
alkali-calcic plagioclase
Bowen’s Reaction Series
Discontinuous
Series
Continuous
Series
The Effect of Pressure
Liquid
Pressur
e
Temperature
Solid
P1
P2
T1
T2
Eutectic system
Figure 7.16. Effect of lithostatic pressure on the liquidus and eutectic composition in the diopside-
anorthite system. 1 GPa data from Presnall et al. (1978). Contr. Min. Pet., 66, 203-220.
The Effect of Water on Melting
Dry melting: solid  liquid
Add water- water enters the melt
Reaction becomes:
solid + water = liq(aq)
Figure 7.19. The effect of H2
O
saturation on the melting of albite,
from the experiments by Burnham
and Davis (1974). A J Sci 274, 902-
940. The “dry” melting curve is
from Boyd and England (1963).
JGR 68, 311-323.
Figure 7.20. Experimentally determined melting intervals of gabbro under H2
O-free (“dry”), and
H O-saturated conditions. After Lambert and Wyllie (1972). J. Geol., 80, 693-708.
Dry and water-saturated solidi for some common rock types
The more mafic the rock
the higher the melting
point
All solidi are greatly
lowered by water
Figure 7-21. H2
O-saturated (solid) and
H2
O-free (dashed) solidi (beginning of
melting) for granodiorite (Robertson
and Wyllie, 1971), gabbro (Lambert
and Wyllie, 1972) and peridotite (H2
O-
saturated: Kushiro et al., 1968; dry:
Hirschman, 2000).
We know the behavior of water-free and water-saturated
melting by experiments, which are easy to control by
performing them in dry and wet sealed vessels
What about real rocks?
Some may be dry, some saturated, but most are more
likely to be in between these extremes
• a fixed water content < saturation levels
• a fixed water activity
The Albite-Water
System
Red curves = melting for
a fixed mol % water in
the melt (Xw)
Blue curves tell the water
content of a water-
saturated melt
m
Figure 7.22. From Burnham and Davis
(1974). A J Sci., 274, 902-940.
Raise a melt with a ratio
of albite:water = 1:1
(Xwater = 0.5)
from point a at 925o
C and
1 GPa pressure, toward the
Earth’s surface under
isothermal conditions.
melt
Figure 7.22. From Burnham and Davis
(1974). A J Sci., 274, 902-940.
Conclusions:
Conclusions:
A rising magma with
a fixed % water will
progressively melt
At shallower levels it
will become saturated,
and expel water into
its surroundings
It should completely
solidify before reaching
the surface
Figure 7.22. From Burnham and Davis
(1974). A J Sci., 274, 902-940.
Another example: isobaric
heating of albite with
10 mol % water at 0.6 GPa.
Figure 7.22. From Burnham and Davis
(1974). A J Sci., 274, 902-940.
Conclusion:
Conclusion:
Although the addition of
water can drastically reduce
the melting point of rocks,
the amount of melt produced
at the lower temperature may
be quite limited, depending
on the amount of water
available
15% 20% 50% 100%
15% 20% 50% 100%
Figure 7.22. From Burnham and Davis
(1974). A J Sci., 274, 902-940.
Melting of Albite with
a fixed activity of H2O
Fluid may be a CO2-H2O
mixture with Pf = PTotal
Figure 7.23. From Burnham and Davis
(1974). A J Sci., 274, 902-940.
Melting of Albite with
a fixed activity of H2O
Fluid may be a CO2-H2O
mixture with Pf = PTotal
Figure 7.26. From Millhollen et al. (1974). J. Geol., 82, 575-587.
The solubility of water in a melt depends on the structure of
the melt (which reflects the structure of the mineralogical
equivalent)
Figure 7.25. The effect of H2
O on the
diopside-anorthite liquidus. Dry and 1
atm from Figure 7-16, PH2O
= Ptotal
curve
for 1 GPa from Yoder (1965). CIW Yb 64.
Ne
Fo En
Ab
SiO2
Oversaturated
(quartz-bearing)
tholeiitic basalts
Highly undesaturated
(nepheline-bearing)
alkali olivine
basalts
Undersaturated
tholeiitic basalts
3GPa
2GPa
1GPa
1atm
Volatile-free
Ne
Fo En
Ab
SiO2
Oversaturated
(quartz-bearing)
tholeiitic basalts
Highly undesaturated
(nepheline-bearing)
alkali olivine
basalts
Undersaturated
tholeiitic basalts
CO2
H2O
dry
P = 2 GPa
Effect of Pressure, Water, and CO
Effect of Pressure, Water, and CO2
2 on the position
on the position
of the eutectic in the basalt system
Increased pressure moves the
ternary eutectic (first melt) from
silica-saturated to highly undersat.
alkaline basalts
Water moves the (2 GPa) eutectic
toward higher silica, while CO2
moves it to more alkaline types

Ternary Phases paras la petrología ignea

  • 1.
    C = 3:Ternary Systems: C = 3: Ternary Systems: Example 1: Ternary Eutectic Di - An - Fo T M Anorthite Forsterite Diopside Note three binary eutectics No solid solution Ternary eutectic = M
  • 2.
    T - XProjection of Di - An - Fo T - X Projection of Di - An - Fo Figure 7.2. Isobaric diagram illustrating the liquidus temperatures in the Di-An-Fo system at atmospheric pressure (0.1 MPa). After Bowen (1915), A. J. Sci., and Morse (1994), Basalts and Phase Diagrams. Krieger Publishers.
  • 3.
  • 4.
    An + Liq Liquid Di+ Liq Di + An a An Pure Fo forms Just as in binary  = ? F = ?
  • 5.
      =2 (Fo + Liq)  F = 3 - 2 + 1 = 2 If on liquidus, need to specify only 2 intensive variables to determine the system  T and or  and X of pure Fo is fixed XAn liq XAn liq XFo liq
  • 7.
    Lever principle relative proportions of liquid & Fo  At 1500o C  Liq x + Fo = bulk a  x/Fo = a-Fo/x-a
  • 9.
     New continuousreaction as liquid follows cotectic: LiqA  LiqB + Fo + Di  Bulk solid extract  Di/Fo in bulk solid extract using lever principle 1400 1300 1500 1274 1270 1392 Diopside D i + L i q M b c Fo + Liq 1387
  • 10.
     At 1300o Cliquid = X  Imagine triangular plane X - Di - Fo balanced on bulk a Liq/total solids = a-m/Liq-a total Di/Fo = m-Fo/Di-m a Di Liq x Fo m
  • 12.
  • 13.
    Ternary Peritectic Systems: TernaryPeritectic Systems: (at 0.1 MPa) Figure 7.4. Isobaric diagram illustrating the cotectic and peritectic curves in the system forsterite- anorthite-silica at 0.1 MPa. After Anderson (1915) A. J. Sci., and Irvine (1975) CIW Yearb. 74. 3 binary systems: Fo-An eutectic An-SiO2 eutectic Fo-SiO2 peritectic
  • 15.
    1890 Fo En Forsterite +Liq E n s t a t i t e + L i q a b y y x
  • 17.
    Works the sameway as the Fo - En - SiO Works the same way as the Fo - En - SiO2 2 binary binary i k Fo En 1557
  • 19.
    Fo En Forsterite +Liq E n s t a t i t e + L i q e b f
  • 22.
    Diopside-Albite-Anorthite Diopside-Albite-Anorthite Di - Aneutectic Di - Ab eutectic Ab - An solid solution Figure 7.5. Isobaric diagram illustrating the liquidus temperatures in the system diopside- anorthite-albite at atmospheric pressure (0.1 MPa). After Morse (1994), Basalts and Phase Diagrams. Krieger Publushers
  • 23.
    Isobaric Isobaric polythermal polythermal projection projection Figure 7.5. Isobaric diagramillustrating the liquidus temperatures in the system diopside- anorthite-albite at atmospheric pressure (0.1 MPa). After Morse (1994), Basalts and Phase Diagrams. Krieger Publishers.
  • 30.
    Note: Note: Binary character isusually maintained when a new component is added  Eutectic behavior remains eutectic  Peritectic behavior remains peritectic  Solid solutions remain so as well
  • 31.
    Oblique View Isothermal Section Figure 7.8. Obliqueview illustrating an isothermal section through the diopside-albite-anorthite system. Figure 7.9. Isothermal section at 1250o C (and 0.1 MPa) in the system Di-An-Ab. Both from Morse (1994), Basalts and Phase Diagrams. Krieger Publishers.
  • 32.
    Ternary Feldspars Ternary Feldspars 1118 Ab20 40 60 80 An 1100 1200 1300 1400 1500 1557 T C o Plagioclase Liquid Liquid plus Liquidus Solidu s Weight % An Plagioclase Or Ab Ab-rich feldspar + liquid liquid single feldspar two feldspars 1200 1000 800 Temperature o C Wt.% a c b d e f g h i j k solvus s oidus liquidus Or-rich feldspar + liquid Figure 7-10. After Carmichael et al. (1974), Igneous Petrology. McGraw Hill.
  • 33.
    Ternary Feldspars Ternary Feldspars Traceof solvus at three temperature intervals Triangle shows coexisting feldspars and liquid at 900o C Figure 7.11. Winter (2010) An Introduction to Igneous and Metamorphic Petrology. Prentice Hall.
  • 34.
    4 - ComponentDiagrams 4 - Component Diagrams y An Figure 7.12. The system diopside-anorthite- albite-forsterite. After Yoder and Tilley (1962). J. Petrol.
  • 35.
    > 4 Components >4 Components Figure 7.13. Pressure-temperature phase diagram for the melting of a Snake River (Idaho, USA) tholeiitic basalt under anhydrous conditions. After Thompson (1972). Carnegie Inst. Wash Yb. 71
  • 36.
    olivine Calcic plagioclase Mgpyroxene Mg-Ca pyroxene amphibole biotite (Spinel) Tempe rature potash feldspar muscovite quartz alkalic plagioclase Calci-alkalic plagioclase alkali-calcic plagioclase Bowen’s Reaction Series Bowen’s Reaction Series Discontinuous Series Continuous Series
  • 37.
    The Effect ofPressure The Effect of Pressure Liquid Pressur e Temperature Solid P1 P2 T1 T2
  • 38.
    Eutectic system Figure 7.16.Effect of lithostatic pressure on the liquidus and eutectic composition in the diopside- anorthite system. 1 GPa data from Presnall et al. (1978). Contr. Min. Pet., 66, 203-220.
  • 39.
    The Effect ofWater on Melting The Effect of Water on Melting Dry melting: solid  liquid Add water- water enters the melt Reaction becomes: solid + water = liq(aq) Figure 7.19. The effect of H2 O saturation on the melting of albite, from the experiments by Burnham and Davis (1974). A J Sci 274, 902- 940. The “dry” melting curve is from Boyd and England (1963). JGR 68, 311-323.
  • 40.
    Figure 7.20. Experimentallydetermined melting intervals of gabbro under H2 O-free (“dry”), and H O-saturated conditions. After Lambert and Wyllie (1972). J. Geol., 80, 693-708.
  • 41.
    Dry and water-saturatedsolidi for some common rock types The more mafic the rock the higher the melting point All solidi are greatly lowered by water Figure 7-21. H2 O-saturated (solid) and H2 O-free (dashed) solidi (beginning of melting) for granodiorite (Robertson and Wyllie, 1971), gabbro (Lambert and Wyllie, 1972) and peridotite (H2 O- saturated: Kushiro et al., 1968; dry: Hirschman, 2000).
  • 42.
    We know thebehavior of water-free and water-saturated melting by experiments, which are easy to control by performing them in dry and wet sealed vessels What about real rocks? Some may be dry, some saturated, but most are more likely to be in between these extremes • a fixed water content < saturation levels • a fixed water activity
  • 43.
    The Albite-Water System Red curves= melting for a fixed mol % water in the melt (Xw) Blue curves tell the water content of a water- saturated melt m Figure 7.22. From Burnham and Davis (1974). A J Sci., 274, 902-940.
  • 44.
    Raise a meltwith a ratio of albite:water = 1:1 (Xwater = 0.5) from point a at 925o C and 1 GPa pressure, toward the Earth’s surface under isothermal conditions. melt Figure 7.22. From Burnham and Davis (1974). A J Sci., 274, 902-940.
  • 45.
    Conclusions: Conclusions: A rising magmawith a fixed % water will progressively melt At shallower levels it will become saturated, and expel water into its surroundings It should completely solidify before reaching the surface Figure 7.22. From Burnham and Davis (1974). A J Sci., 274, 902-940.
  • 46.
    Another example: isobaric heatingof albite with 10 mol % water at 0.6 GPa. Figure 7.22. From Burnham and Davis (1974). A J Sci., 274, 902-940.
  • 47.
    Conclusion: Conclusion: Although the additionof water can drastically reduce the melting point of rocks, the amount of melt produced at the lower temperature may be quite limited, depending on the amount of water available 15% 20% 50% 100% 15% 20% 50% 100% Figure 7.22. From Burnham and Davis (1974). A J Sci., 274, 902-940.
  • 48.
    Melting of Albitewith a fixed activity of H2O Fluid may be a CO2-H2O mixture with Pf = PTotal Figure 7.23. From Burnham and Davis (1974). A J Sci., 274, 902-940.
  • 49.
    Melting of Albitewith a fixed activity of H2O Fluid may be a CO2-H2O mixture with Pf = PTotal Figure 7.26. From Millhollen et al. (1974). J. Geol., 82, 575-587.
  • 50.
    The solubility ofwater in a melt depends on the structure of the melt (which reflects the structure of the mineralogical equivalent) Figure 7.25. The effect of H2 O on the diopside-anorthite liquidus. Dry and 1 atm from Figure 7-16, PH2O = Ptotal curve for 1 GPa from Yoder (1965). CIW Yb 64.
  • 51.
    Ne Fo En Ab SiO2 Oversaturated (quartz-bearing) tholeiitic basalts Highlyundesaturated (nepheline-bearing) alkali olivine basalts Undersaturated tholeiitic basalts 3GPa 2GPa 1GPa 1atm Volatile-free Ne Fo En Ab SiO2 Oversaturated (quartz-bearing) tholeiitic basalts Highly undesaturated (nepheline-bearing) alkali olivine basalts Undersaturated tholeiitic basalts CO2 H2O dry P = 2 GPa Effect of Pressure, Water, and CO Effect of Pressure, Water, and CO2 2 on the position on the position of the eutectic in the basalt system of the eutectic in the basalt system Increased pressure moves the ternary eutectic (first melt) from silica-saturated to highly undersat. alkaline basalts Water moves the (2 GPa) eutectic toward higher silica, while CO2 moves it to more alkaline types

Editor's Notes

  • #1 As add components, becomes increasingly difficult to dipict. 1-C: P - T diagrams easy 2-C: isobaric T-X, isothermal P-X… 3-C: ?? Still need T or P variable Project? Hard to use as shown
  • #2 X-X diagram with T contours (P constant) Liquidus surface works like topographic map Red lines are ternary cotectic troughs Run from binary eutectics down T to ternary eutectic M Separate fields labeled for liquidus phase in that field
  • #3 Cool composition a from 2000oC At 2000oC:  = ? (1 (liquid) F = ? F = C -  + 1 = 3 - 1 + 1 = 3 = T, X(An)Liq, X(Di)Liq, and X(Fo)Liq only 2 of 3 X’s are independent Next cool to 1700oC Intersect liquidus surface What happens??
  • #6 Continue to cool; Fo crystallizes and liquid loses Fo component Xliq moves directly away from Fo corner “Liquid line of descent” is a -> b Along this line liquid cools from 1700oC to about 1350oC with a continuous reaction: LiqA -> LiqB + Fo
  • #7 At any point can use the lever principle to determine the relative proportions of liquid and Fo
  • #8 What happens next at 1350oC ? Pure diopside joins olivine + liquid  = 3 F = 3 - 3 + 1 = 1 (univariant at constant P) Xliq = F(T) only Liquid line of descent follows cotectic -> M
  • #9 Bulk solid extract crystallizing from the liquid at any point (T): draw tangent back to the Di-Fo join At 1350oC that is point c Use c and the lever principle to get the Di-Fo ratio crystallizing at that instant (not the total solid mass crystallized)
  • #10 Total amounts of three phases at any T can be determined by a modified lever principle:
  • #11 At 1270oC reach M the ternary eutectic anorthite joins liquid + forsterite + diopside = 4 F = 3 - 4 + 1 = 0 (invariant) discontinuous reaction: Liq = Di + An + Fo stay at 1270oC until consume liq Below 1270oC have all solid Fo + Di + An  = 3 F = 3 - 3 + 1 = 1
  • #12 Try bulk = a First melt at M (1270oC) Stay at M until consume one phase (An) Why An? Only Di and Fo left Jump to Di-Fo binary No further melt until N at 1387oC Stay at N until consume one phase (Di) Only Fo left No further melt until 1890oC
  • #13 Shown without liquidus contours to reduce clutter Binary peritectic behavior extends into the ternary system c = ternary peritectic d = ternary eutectic Liquid immiscibility extends slightly into ternary, then becomes miscible Final mineral assemblage determined by sub-triangle (Fo-En-An) or (En-An-Qtz)
  • #14 Begin with composition a Fo crystallizes first phi = 2 F = 3 - 2 + 1 = 2 Xliq  b as cool En now forms and F = 1 Xliq then follows peritectic curve toward c
  • #15 As Xliq follows peritectic can get bulk solid extract at any T by tangent method example at point x the tangent -> y as bulk solid We know Fo, En, and Liq are the three phases since y = solids, it must be comprised of Fo and En but y falls outside the Fo-En join y = En + (-Fo) the reaction must be: Liq + Fo En which is a peritectic continuous reaction If y fell between En and Fo it would be L = En + Fo
  • #16 Continue cooling with continuous reaction until Xliq reaches c at 1270oC Now get An + En + Fo + Liq  = 4 F = 3 - 4 + 1 = 0 stay here with discontinuous reaction: Liq + Fo = En + An until Liquid used up Since a plots in the Fo - En - An triangle these must be the final phases
  • #17 If the bulk X is between Fo and En the liquid disappears first at the peritectic temperature and Fo + En remain as the final solids If, on the other hand, the bulk X lies to the right of En, then Fo is consumed first and the liduid continues to evolve toward the eutectic
  • #18 As a variation on this sequence: begin with e Fo is first phase to crystallize. As it does so, Xliq -> b where En also forms As before get continuous reaction Liq + Fo = En But, when Xliq reaches f the Xbulk (e) lies directly between En and Xliq
  • #19 Whenever Xbulk lies directly between two phases, these two phases alone add to comprise the system: En + f = e Thus En and liquid are all it takes, so the olivine must be consumed by the reaction at this point phi = 2 and F = 3 - 2 + 1 = 2 Xliq then leaves the peritectic curve -> En + Liq field (directly away from En)
  • #20 Xliq ->g where An joins En + Liq As before get continuous reaction Liq = An + En Xliq d where Tridymite also forms Again stay at d with discontinuous reaction: Liq = An + En + S until last liq gone Since e lies in the triangle En - An - SiO2, that is the final mineral assemblage
  • #21 Other areas are relatively simple Liq h Fo first and Xliq  i An joins and Xliq  c F = 0 and stay at c until liquid consumed never leave c You pick others?
  • #22 Oblique View Cotectic trough slopes down continuously from Di - An (1274oC) to Di - Ab (1133oC)
  • #23 Isothermal contours on the liquidus only. None on the solidus (so Xplag indefinite). Cotectic in red. Some tie-lines connecting plagioclase compositions with cotectic liquids shown in green Let’s begin by cooling composition a
  • #24 Above 1300oC phi= 1 so F = C - phi + 1 = 3 - 1 + 1 = 3 At 1300oC diopside forms at the liquidus temperature F = 3 - 2 + 1 = 2 (liquid is restricted to the liquidus surface) As cool further get continuous reaction liqA Di + liqB and Xliq moves directly away from Di
  • #25 At 1230oC plagioclase joins diopside and liquid b F = 3 - 3 + 1 = 1 So Xliq now restricted to the cotectic curve Xplag can now be found from tie-lines (since they apply to cotectic liquids) Xplag = An80
  • #26 Xliq follows cotectic as continuous reaction: liqA Di + Plag + liqB proceeds At any point the bulk composition a must be within the triangle Di - Plag - Liq which comprise it When Xliq reaches c Xplag reaches An50 Now Di-a-Plag are colinear Thus c is the last drop of liquid
  • #27 Now we cool a liquid of composition d First solid to form will be plagioclase BUT, we cannot tell what composition it will be Plag forms at about 1420oC Xplag is about An87 Must be higher than An75 Why?
  • #28 Now follow continuous reaction of type: liqA + plagB liqC + plagD Plagioclase follows path at base Liquid follows curved path (since moves away from a moving plagioclase comp.) At 1230oC liquid reaches e and diopside forms along with cotectic liquid and plag An75 (tie-line works now)
  • #29 Continuous reaction: liqA + plagB Di liqC + plagD As liquid moves e f and plag moves An65 When Xplag -> An65 then Di - d - plag are colinear Thus the last liquid = f
  • #32 Figure 7-10. Schematic oblique view of the ternary feldspar system vs. temperature The ternary liquidus and solvus surfaces have the hatch pattern The solidus is shaded Purple line e-c is the cotectic minimum The yellow curve from a to b is the trace of solids that coexist with the cotectic liquids x-y-z = coexisting plag-Afs-liq at constant T
  • #33 Solvus gets larger as T lowered
  • #34 Add Fo to Ab - An - Di Plag - Diopside cotectic curve becomes a surface As do Di - An - Fo cotectics Surfaces meet in 4-C univariant curves, which meet in 4-C invariant points. Cannot visualize depth in diagram (is point y in the Di-An-Fo face, the Di-Ab-Fo face, or between?) Reaching the point where lose the advantage of model systems
  • #35 May as well melt real rocks On right is a P-T diagram for the melting of a Snake River basalt. Each curve represents the loss of a phase as heat system. - Compare to simpler systems Note pressure effects Ol - Plag - Cpx at low P Garnet at high P (eclogite)
  • #37 ~All solid - liquid (melting) reactions have a positive slope Increasing pressure (P1  P2) thus raises the melting point (T1  T2) of a solid
  • #38 In a eutectic system increasing pressure will raise the melting point (as predicted) The magnitude of the effect will vary for different minerals Anorthite compresses less than Diopside Thus the elevation of the m. p. is less for An than Di The eutectic thus shifts toward An
  • #39 Dry melt reaction: solid  liquid Add water- water enters the melt So the reaction becomes: solid + water = liq(aq) Thus adding water drives the reaction to the right. Liquid is stabilized at the expense of the solid. The result is to lower the melting point. Pressure is required to hold the water in the melt, so increased pressure allows more water to enter the melt and this increases the melting point depression
  • #40 Note the difference in the dry melting temperature and the melting interval of a basalt as compared to the water- saturated equivalents The melting point depression is quite dramatic Especially at low to intermediate pressures
  • #41 Granite is only a crustal rock (not found deeper than 1 GPa)
  • #43 Return to a simpler system that we know Green curves = “dry” and water-saturated melting Red curves = melting for a fixed mol % water in the melt (Xw) Blue curves tell the water content of a water-saturated melt Note that any curve for a fixed % water and a curve that is saturated with that same % intersect at the green saturated curve
  • #44 At a it is above the water-sat. solidus, so it is at least partially melted. If it had 0.52% water it would be completely molten (red curves). With only 50% water it is nearly molten, but not entirely so. When the melt rises to b it does become completely molten (liquidus for 50% water) From b to c the melt becomes progressively more superheated At c the melt reaches the point where it is now saturated with 50% water (blue curve) so free water phase released From c to d the melt is saturated with progressively less water Between c and d the water content of the saturated melt will be reduced from 50% to 30% (nearly halved) At d the melt should solidify- won’t reach the surface!
  • #46 At e it is solid albite. At f it would all melt if it had enough water (65%), but it has only 10% water Thus only 10/65 or 15% will melt. At g it would be completely molten if it were 50% water, but with 10% it will be 10/50 or 20% molten. At h it will be 10/20 or 50% molten and at i it will finally be 100% molten. Melting starts out very slowly, and accelerates near the appropriate liquidus curve (see blue % at top)
  • #50 The solubility of water in a melt depends on the structure of the melt (which reflects the structure of the mineralogical equivalent) Water dissolves more in polymerized melts (An > Di) Thus the melting point depression effect is greater for An than Di The eutectic moves toward An
  • #51 Left: Effect of pressure on the ternary eutectic (minimum melt composition) in the system Fo-Ne-SiO2 (base of the “basalt tetrahedron”). From Kushiro (1968). JGR 73, 619-634. Right: Figure 7-27. Effect of volatiles on the ternary eutectic (minimum melt composition) in the system Fo-Ne-SiO2 (base of the “basalt tetrahedron”) at 2 GPa. Volatile-free from Kushiro (1968) JGR 73, 619-634, H2O-saturated curve from Kushiro (1972), J. Petrol., 13, 311-334, CO2–saturated curve from Eggler (1974) CIW Yb 74.