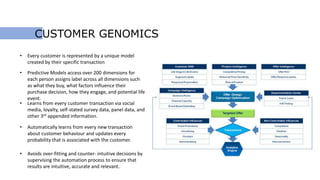
This document discusses using social media data and text analysis techniques to gain business insights. It covers extracting data from social media, preprocessing the text, performing sentiment analysis and classification using Naive Bayes and other algorithms, analyzing word frequencies and associations through word clouds and clustering, and segmenting customers for cross-sell/upsell opportunities based on spending and sentiment. Potential applications discussed include customer churn prediction, sarcasm detection, and building unique models of customer behavior over time.


![TEXT STEMMING AND CLEANING
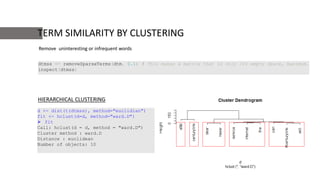
# remove at people
mydata$Content = gsub("@w+", "", mydata$Content)
# remove punctuation
mydata$Content = gsub("[[:punct:]]", "",mydata$Content) >
# remove numbers
mydata$Content = gsub("[[:digit:]]", "", mydata$Content)
# remove html links
mydata$Content = gsub("httpw+", "", mydata$Content)
# remove unnecessary spaces
mydata$Content = gsub("[ t]{2,}", "", mydata$Content)
mydata$Content = gsub("^s+|s+$", "", mydata$Content)](https://image.slidesharecdn.com/newpptdm-161006014357/85/Telecom-Data-Analysis-Using-Social-Media-Feeds-5-320.jpg)
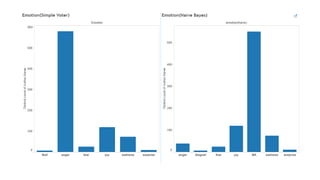
![# classify emotion
class_emo = classify_emotion(mydata$Content, algorithm="bayes", prior=1.0)
# get emotion best fit
> emotion = class_emo[,7]
# classify emotion
class_emo = classify_emotion(mydata$Content, algorithm=“voter", prior=1.0)
# get emotion best fit
> emotion = class_emo[,7]
# classify polarity
> class_pol = classify_polarity(mydata$Content, algorithm="bayes")
get polarity best fit
> polarity = class_pol[,4]
# classify polarity
> class_pol = classify_polarity(mydata$Content, algorithm=“voter")
get polarity best fit
> polarity = class_pol[,4]](https://image.slidesharecdn.com/newpptdm-161006014357/85/Telecom-Data-Analysis-Using-Social-Media-Feeds-7-320.jpg)