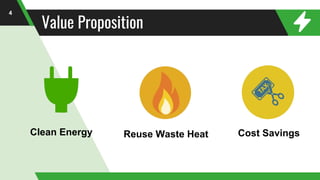
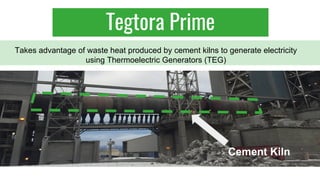
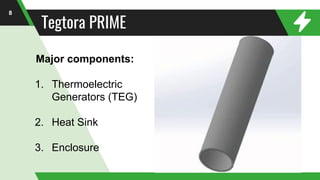
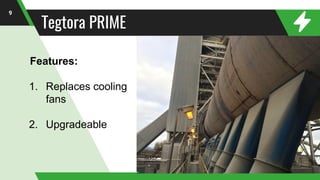
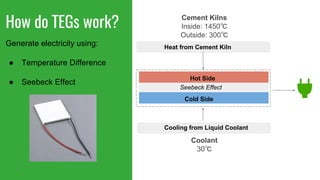
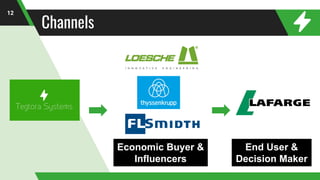
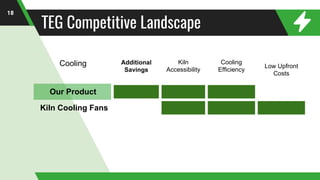
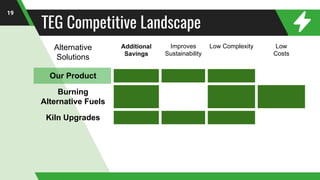
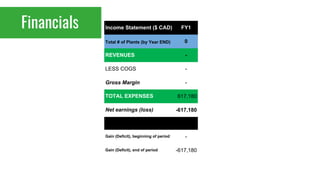
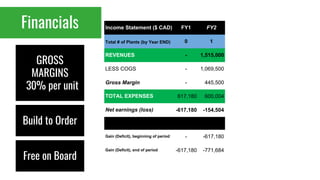
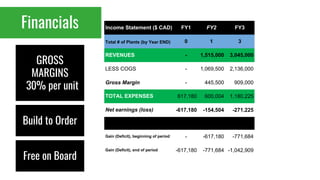
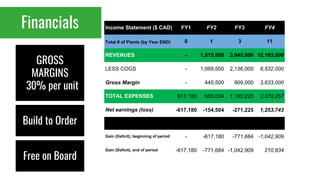
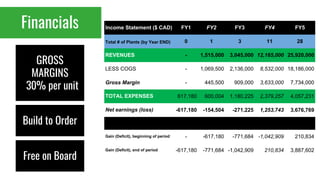
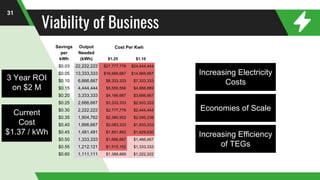
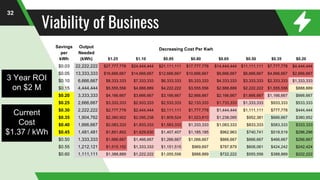
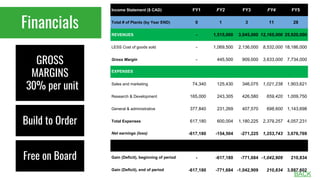
Tegtora Systems provides thermoelectric generator solutions for cement manufacturers to cut costs and implement more sustainable practices. Their product, Tegtora Prime, uses waste heat from cement kilns to generate electricity via thermoelectric generators, replacing cooling fans. It offers savings of $0.20 to $0.45 per kWh and a 3-year return on investment. The company projects installing their technology in 1 plant in year 1, 3 plants by year 3, and 28 plants by year 5, achieving $26 million in annual revenues at a 30% gross margin by then.
'CEO Dashboard'. Present monthly business performance to your CEO in a world-class, dynamic, and flexible dashboard. Ready dashboard, just plug your data. More: https://www.bizinfograph.com/dashboard-templates/50
'Cash Flow Dashboard'. Keep focusing on the indicators that matter to your cash flow management. Dynamic and flexible dashboard, just plug your data. More:https://www.bizinfograph.com/dashboard-templates/53
One of the most important asset, literally every American creates taking advantage of the tax laws, is an IRA or a qualified retirement plan. We specialize on how to tax efficiently deal with this asset, provide lifetime income for the plan owner, the spouse if applicable and then stretch that asset in a tax advantaged way for the lifetime of the heirs, preserving the wealth in the family. Complimentary illustrations are available.
Current Years Estimation PowerPoint Presentation SlidesSlideTeam
This complete deck is oriented to make sure you do not lag in your presentations. Our creatively crafted slides come with apt research and planning. This exclusive deck with thirtynine slides is here to help you to strategize, plan, analyse, or segment the topic with clear understanding and apprehension. Utilize ready to use presentation slides on Current Years Estimation Power Point Presentation Slides with all sorts of editable templates, charts and graphs, overviews, analysis templates. It is usable for marking important decisions and covering critical issues. Display and present all possible kinds of underlying nuances, progress factors for an all inclusive presentation for the teams. This presentation deck can be used by all professionals, managers, individuals, internal external teams involved in any company organization.
Fixed Capital Analysis PowerPoint Presentation SlidesSlideTeam
Presenting this set of slides with name - Fixed Capital Analysis Powerpoint Presentation Slides. This deck consists of total of fourty slides. It has PPT slides highlighting important topics of Fixed Capital Analysis Powerpoint Presentation Slides. This deck comprises of amazing visuals with thoroughly researched content. Each template is well crafted and designed by our PowerPoint experts. Our designers have included all the necessary PowerPoint layouts in this deck. From icons to graphs, this PPT deck has it all. The best part is that these templates are easily customizable. Just click the DOWNLOAD button shown below. Edit the colour, text, font size, add or delete the content as per the requirement. Download this deck now and engage your audience with this ready made presentation.
Presenting this set of slides with name - Revenue Projection Powerpoint Presentation Slides. This deck consists of total of twenty slides. It has PPT slides highlighting important topics of Revenue Projection Powerpoint Presentation Slides. This deck comprises of amazing visuals with thoroughly researched content. Each template is well crafted and designed by our PowerPoint experts. Our designers have included all the necessary PowerPoint layouts in this deck. From icons to graphs, this PPT deck has it all. The best part is that these templates are easily customizable. Just click the DOWNLOAD button shown below. Edit the colour, text, font size, add or delete the content as per the requirement. Download this deck now and engage your audience with this ready made presentation.
FSAE-A Business Presentation - Redback Racing 2017Albert Chau
Formula SAE (F-SAE) is a student competition where students design and build a race car. Part of that competition is pitching the race car as part of a wider business to potential investors. I presented this at F-SAE Australasia 2017 for UNSW Redback Racing. Despite only having 2 weeks to prepare a presentation where other teams have an entire year, Redback Racing placed 4th in the presentation event, which is the best result Redback has had in 6 years.
Ratios Analysis, Pro Forma Statements, Projected Cash flows of Proposed Project, Net Present Value, Internal Rate of Return, Payback Period, Discounted Payback Period, Break Even Analysis, Scenario Analysis, As-if Analysis
Michael Reese - Electric and Thermal Energy Strategies for Minnesota Swine FarmsJohn Blue
Businesses Decision on Electric and Thermal Energy Strategies for Minnesota Swine Farms - Michael Reese, University of Minnesota, from the 2017 Minnesota Pork Congress, January 17 - 18, 2017, Minneapolis, MN, USA.
More presentations at http://www.swinecast.com/2017-minnesota-pork-congress
The economics of reducing the cost of energy by 13% revenuesSentient Science
At what “speed” is your digitalization effort? There is no dispute, digitalization will play a key role in improving the sustainability of renewable energy sources through efficiency. The question remains – Where are you? While the industry has embraced the importance, water cooler conversations continue - How to monetize the true value of the data from digitalization?
The webinar outlines:
• How digitalization is applied across all corporate business units: asset management, operations management, risk management and supply chain management to reduce the cost of energy by up to 13%
• An industry operator case study on monetizing your digitalization efforts and understand the true ROI
• A digitalization value statement to enable operations management can provide a short-term watch list from 0-12 months enabling early detection prior to consequential damage beyond an operator's current capabilities – attributes to 2-3% of cost avoidance or cost savings.
This deck consists of total of ninteen slides. It has PPT slides highlighting important topics of Financial Projection Power Point Presentation Slides. This deck comprises of amazing visuals with thoroughly researched content. Each template is well crafted and designed by our PowerPoint experts. Our designers have included all the necessary PowerPoint layouts in this deck. From icons to graphs, this PPT deck has it all. The best part is that these templates are easily customizable. Just click the DOWNLOAD button shown below. Edit the colour, text, font size, add or delete the content as per the requirement. Download this deck now and engage your audience with this ready made presentation.
Income Projection PowerPoint Presentation SlidesSlideTeam
Analyse performance of the company using content-ready Income Projection PowerPoint Presentation Slides. Prepare financial statements, income projection statement, profit loss statements, etc with the help of ready-made income projection PPT presentation templates. Figure out how much money the company will generate in future, company budget, projection statement, records, etc. Add ready-made income projection PowerPoint presentation slideshow to assess monthly, quarterly and yearly profit. This deck comprises of templates covering revenue projection of various businesses. Such templates are retail store revenue projection, revenue forecast model, three-year revenue projection, monthly revenue projection, income statement projection, revenue projection per store, emerging sales forecast product wise, revenue projection by active users, revenue projection historical and forecast, etc. These templates are editable. Customize templates as per your requirement. Edit color, text, icon and font size as per your need. Get access to the income projection PPT templates for investors to analyse whether the projections are accurate or not. Attract greater attendance with our Income Projection Powerpoint Presentation Slides. Draw in the crowds at any conclave.
Income Forecast PowerPoint Presentation SlidesSlideTeam
Enhance your audiences knowledge with this well researched complete deck. Showcase all the important features of the deck with perfect visuals. This deck comprises of total of ninteen slides with each slide explained in detail. Each template comprises of professional diagrams and layouts. Our professional PowerPoint experts have also included icons, graphs and charts for your convenience. All you have to do is DOWNLOAD the deck. Make changes as per the requirement. Yes, these PPT slides are completely customizable. Edit the colour, text and font size. Add or delete the content from the slide. And leave your audience awestruck with the professionally designed Income Forecast Power Point Presentation Slides complete deck.
This comprehensive program covers essential aspects of performance marketing, growth strategies, and tactics, such as search engine optimization (SEO), pay-per-click (PPC) advertising, content marketing, social media marketing, and more
New Explore Careers and College Majors 2024.pdfDr. Mary Askew
Explore Careers and College Majors is a new online, interactive, self-guided career, major and college planning system.
The career system works on all devices!
For more Information, go to https://bit.ly/3SW5w8W
Want to move your career forward? Looking to build your leadership skills while helping others learn, grow, and improve their skills? Seeking someone who can guide you in achieving these goals?
You can accomplish this through a mentoring partnership. Learn more about the PMISSC Mentoring Program, where you’ll discover the incredible benefits of becoming a mentor or mentee. This program is designed to foster professional growth, enhance skills, and build a strong network within the project management community. Whether you're looking to share your expertise or seeking guidance to advance your career, the PMI Mentoring Program offers valuable opportunities for personal and professional development.
Watch this to learn:
* Overview of the PMISSC Mentoring Program: Mission, vision, and objectives.
* Benefits for Volunteer Mentors: Professional development, networking, personal satisfaction, and recognition.
* Advantages for Mentees: Career advancement, skill development, networking, and confidence building.
* Program Structure and Expectations: Mentor-mentee matching process, program phases, and time commitment.
* Success Stories and Testimonials: Inspiring examples from past participants.
* How to Get Involved: Steps to participate and resources available for support throughout the program.
Learn how you can make a difference in the project management community and take the next step in your professional journey.
About Hector Del Castillo
Hector is VP of Professional Development at the PMI Silver Spring Chapter, and CEO of Bold PM. He's a mid-market growth product executive and changemaker. He works with mid-market product-driven software executives to solve their biggest growth problems. He scales product growth, optimizes ops and builds loyal customers. He has reduced customer churn 33%, and boosted sales 47% for clients. He makes a significant impact by building and launching world-changing AI-powered products. If you're looking for an engaging and inspiring speaker to spark creativity and innovation within your organization, set up an appointment to discuss your specific needs and identify a suitable topic to inspire your audience at your next corporate conference, symposium, executive summit, or planning retreat.
About PMI Silver Spring Chapter
We are a branch of the Project Management Institute. We offer a platform for project management professionals in Silver Spring, MD, and the DC/Baltimore metro area. Monthly meetings facilitate networking, knowledge sharing, and professional development. For event details, visit pmissc.org.
10. Cement Kilns
Inside: 1450℃
Outside: 300℃
How do TEGs work?
Generate electricity using:
● Temperature Difference
● Seebeck Effect
Hot Side
Cold Side
Seebeck Effect
Heat from Cement Kiln
Cooling from Liquid Coolant
Coolant
30℃
11. How Does it Work?
11
Hot Side
Cold Side
Seebeck Effect
13. Key Partnership: FLSmidth
13
Offer Premium High
Tech Solutions
One of the Largest
Cement Plant Suppliers
Monthly Touchpoints with
Cement Plants
Global Reach
14. Meeting with FLSmidth
14
Steven Miller
Regional Product Manager,
Pyroprocessing Technology
Global Industry is looking
for Cost Savings
Vendors Status Process
takes approx. 1 year
Expect 10-30% Margin
15. What Special About Tegtora
15
PatentableEngineering
Design
Preferred Vendor
Status with
23. Financials Income Statement ($ CAD) FY1
Total # of Plants (by Year END) 0
REVENUES -
LESS COGS -
Gross Margin -
TOTAL EXPENSES 617,180
Net earnings (loss) -617,180
Gain (Deficit), beginning of period -
Gain (Deficit), end of period -617,180
24. Financials
GROSS
MARGINS
30% per unit
Build to Order
Free on Board
Income Statement ($ CAD) FY1 FY2
Total # of Plants (by Year END) 0 1
REVENUES - 1,515,000
LESS COGS - 1,069,500
Gross Margin - 445,500
TOTAL EXPENSES 617,180 600,004
Net earnings (loss) -617,180 -154,504
Gain (Deficit), beginning of period - -617,180
Gain (Deficit), end of period -617,180 -771,684
25. Financials
GROSS
MARGINS
30% per unit
Build to Order
Free on Board
Income Statement ($ CAD) FY1 FY2 FY3
Total # of Plants (by Year END) 0 1 3
REVENUES - 1,515,000 3,045,000
LESS COGS - 1,069,500 2,136,000
Gross Margin - 445,500 909,000
TOTAL EXPENSES 617,180 600,004 1,180,225
Net earnings (loss) -617,180 -154,504 -271,225
Gain (Deficit), beginning of period - -617,180 -771,684
Gain (Deficit), end of period -617,180 -771,684 -1,042,909
26. Financials
GROSS
MARGINS
30% per unit
Build to Order
Free on Board
Income Statement ($ CAD) FY1 FY2 FY3 FY4
Total # of Plants (by Year END) 0 1 3 11
REVENUES - 1,515,000 3,045,000 12,165,000
LESS COGS - 1,069,500 2,136,000 8,532,000
Gross Margin - 445,500 909,000 3,633,000
TOTAL EXPENSES 617,180 600,004 1,180,225 2,379,257
Net earnings (loss) -617,180 -154,504 -271,225 1,253,743
Gain (Deficit), beginning of period - -617,180 -771,684 -1,042,909
Gain (Deficit), end of period -617,180 -771,684 -1,042,909 210,834
27. Income Statement ($ CAD) FY1 FY2 FY3 FY4 FY5
Total # of Plants (by Year END) 0 1 3 11 28
REVENUES - 1,515,000 3,045,000 12,165,000 25,920,000
LESS COGS - 1,069,500 2,136,000 8,532,000 18,186,000
Gross Margin - 445,500 909,000 3,633,000 7,734,000
TOTAL EXPENSES 617,180 600,004 1,180,225 2,379,257 4,057,231
Net earnings (loss) -617,180 -154,504 -271,225 1,253,743 3,676,769
Gain (Deficit), beginning of period - -617,180 -771,684 -1,042,909 210,834
Gain (Deficit), end of period -617,180 -771,684 -1,042,909 210,834 3,887,602
Financials
GROSS
MARGINS
30% per unit
Build to Order
Free on Board
28. Net Cash Flow
28
CF +:
Y4 Q3
Supplier
Status Y4 Q1
Evaluation & Trial Period
with FLSmidth
Beta
Prototype Y2
Manufacturing
First Unit Y2 Q2
38. Business Model Canvas
38
Key Partners Key Activities
Key Resources
Value Proposition Customer Relationships
Channels
Customer Segments
Revenue StreamsCost Structure
BACK
Industry:
Matt Dalkie
(Lafarge),
Steven Miller
(FLSmidth)
Christopher Sielmann
(Expert in TEGs)
43. Income Statement ($ CAD) FY1 FY2 FY3 FY4 FY5
Total # of Plants (by Year END) 0 1 3 11 28
REVENUES - 1,515,000 3,045,000 12,165,000 25,920,000
LESS Cost of goods sold - 1,069,500 2,136,000 8,532,000 18,186,000
Gross Margin - 445,500 909,000 3,633,000 7,734,000
EXPENSES
Sales and marketing 74,340 125,430 346,075 1,021,238 1,903,621
Research & Development 165,000 243,305 426,580 659,420 1,009,750
General & administrative 377,840 231,269 407,570 698,600 1,143,698
Total Expenses 617,180 600,004 1,180,225 2,379,257 4,057,231
Net earnings (loss) -617,180 -154,504 -271,225 1,253,743 3,676,769
Gain (Deficit), beginning of period - -617,180 -771,684 -1,042,909 210,834
Gain (Deficit), end of period -617,180 -771,684 -1,042,909 210,834 3,887,602
Financials
GROSS
MARGINS
30% per unit
Build to Order
Free on Board
BACK
44. Patentability
Existing Patents:
1. TEG technology
Alphabet Energy:
1. TEG Assembly
2. Waste Heat Recovery
3. 18 other patents
Tegtora’s Patents:
1. Application on Kiln
a. Installation
b. Assembly
2. Heat Sink on Kiln
BACK