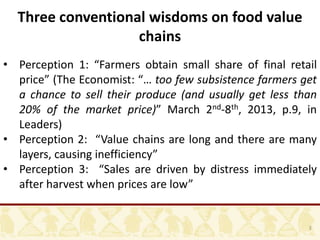
1) The study examines the teff value chain from major production areas in Ethiopia to Addis Ababa to test common perceptions about inefficiencies and farmers receiving a small share of prices.
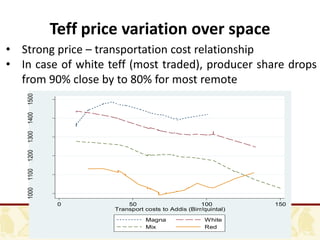
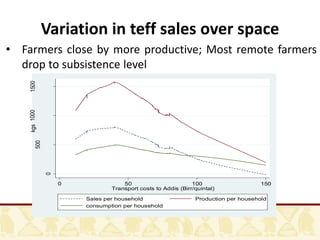
2) The study finds that the typical teff value chain involves three intermediaries and that farmers receive around 80% of the final retail price.
3) Distress sales, where farmers would accept a lower price, make up 19% of transactions, occurring most in months immediately after harvest.