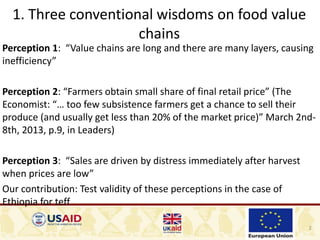
1. The study tests three common perceptions about food value chains using data on the teff supply chain in Ethiopia.
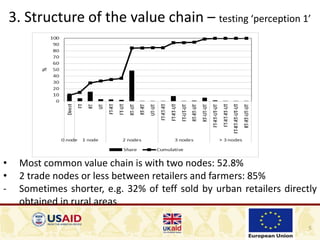
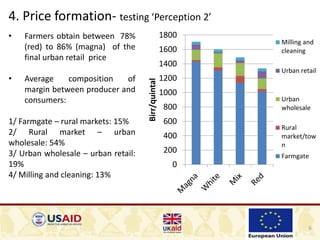
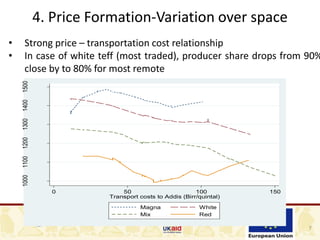
2. The study finds that the teff supply chain is relatively short, with on average three intermediaries between farmers and consumers. Farmers obtain around 80% of the final retail price.
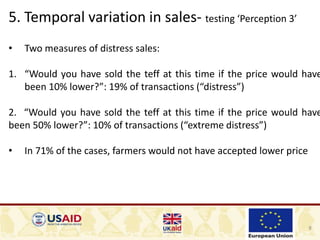
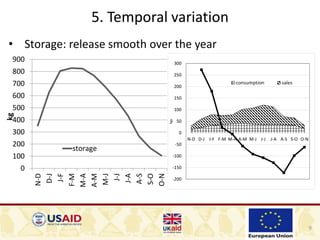
3. Distress sales, where farmers would accept a lower price, make up 19% of transactions, and extreme distress sales 10% of transactions. Farmers store teff and release it smoothly over the year. These findings contradict the common perceptions of inefficient, exploitative supply chains driven mostly by distress sales.