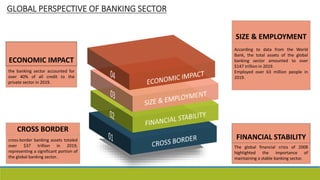
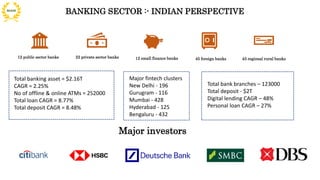
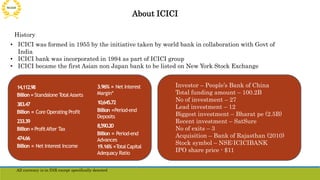
C.C.S NATIONAL INSTITUTE OF AGRICULTURAL MARKETING
( A Government of India Autonomous Organization Under Ministry of Agriculture and Farmers Welfare )
Submitted by: Group-3
Name Roll No.
Pavan Kumar Dangi 1332
Pradeep 1335
Rituraj Singh 1344
Saurabh Singh 1347
Shivam Kumar Singh 1353
Soham Bhattacharyya 1355
Course Title- BUSINESS ANALYSIS & EVALUATION
Submitted to: Dr. Shweta Sharma
GLOBAL PERSPECTIVE OF BANKING SECTOR
According to data from the World
Bank, the total assets of the global
banking sector amounted to over
$147 trillion in 2019.
Employed over 63 million people in
2019.
SIZE & EMPLOYMENT
cross-border banking assets totaled
over $37 trillion in 2019,
representing a significant portion of
the global banking sector..
CROSS BORDER
the banking sector accounted for
over 40% of all credit to the
private sector in 2019.
ECONOMIC IMPACT
The global financial crisis of 2008
highlighted the importance of
maintaining a stable banking sector.
FINANCIAL STABILITY
BANKING SECTOR :- INDIAN PERSPECTIVE
12 public sector banks 22 private sector banks 12 small finance banks 45 foreign banks 43 regional rural banks
Total banking asset = $2.16T
CAGR = 2.25%
No of offline & online ATMs = 252000
Total loan CAGR = 8.77%
Total deposit CAGR = 8.48%
Major investors
Major fintech clusters
New Delhi - 196
Gurugram - 116
Mumbai - 428
Hyderabad - 125
Bengaluru - 432
Total bank branches – 123000
Total deposit - $2T
Digital lending CAGR – 48%
Personal loan CAGR – 27%
About ICICI
• ICICI was formed in 1955 by the initiative taken by world bank in collaboration with Govt of
India
• ICICI bank was incorporated in 1994 as part of ICICI group
• ICICI became the first Asian non Japan bank to be listed on New York Stock Exchange
History
14,112.98
Billion=Standalone T
otalAssets
383.47
Billion = Core Operating Profit
233.39
Billion=ProfitAfter Tax
474.66
Billion = Net Interest Income
3.96% = Net Interest
Margin*
10,645.72
Billion =Period-end
Deposits
8,590.20
Billion = Period-end
Advances
19.16% =T
otalCapital
Adequacy Ratio
Investor – People’s Bank of China
Total funding amount – 100.2B
No of investment – 27
Lead investment – 12
Biggest investment – Bharat pe (2.5B)
Recent investment – SatSure
No of exits – 3
Acquisition – Bank of Rajasthan (2010)
Stock symbol – NSE:ICICIBANK
IPO share price - $11
All currency is in INR except specifically denoted
Rural outreach- 51% of the Bank’s branches are in rural and semi-urban areas with 649 branches in
villages that were previously unbanked.
UPI transactions was 2.3 times-The value of UPI person-to-merchant transactions in fiscal 2022 was
2.3 times as compared to fiscal 2021.
Working towards inclusion-ICICI Bank has provided loans to over nine million women beneficiaries
through more than 692,000 Self-Help Groups (SHGs) till March 31, 2022. Of these, 3.8 million were
first-time borrowers.
Over 750,000 individuals trained--ICICI Foundation for Inclusive Growth, CSR arm of ICICI Group, has
trained over 750,000 less privileged individuals in the country since inception.
Market leader in FASTag-ICICI Bank continues to be the leading bank in electronic toll collections
through FASTag with a market share of close to 33%. Our electronic toll collections through FASTag
increased by 51.9% year-on-year in fiscal 2022
ICICI BANK AT A GLANCE
Mobile Pay – built for all,built for scale-6.3 million activations of iMobile Pay by non-ICICI Bank
account holders till March 31, 2022.
Mobile Pay – built for all,built for scale-6.3 million activations of iMobile Pay by non-ICICI Bank
account holders till March 31, 2022.
m
n
Provide credit to
support
consumption and
economic activity
Enable financial
inclusion
Facilitate
payments and
transactions
Enable wealth
creation and
management
Provide
savings
products
c
a
BUSINESS MODEL
Capitals of ICICI
• Financial capital
• Human capital
• Intellectual capital
• Manufactured capital
• Social & Relationship
capital
• Nature capital
VISION
To be the trusted financial
services provider of choice
for our customers, thereby
creating sustainable value
for ourstakeholders
MISSION
To grow ourrisk-calibrated
core operating profit by:
•Delivering products and
services that create valuefor
customers
•Bringing together all our
capabilities to seamlessly
meet customerneeds
•Conducting our business
within well-defined risk
tolerance levels
BUSINESS
STRATEGY
360
customer
centric
approach
One stop for
meeting all
banking
needs
required by
customer
with focus
on risk and
reward
Focus on
ecosystem
Serving
customers
and their
ecosystem
Focus on
micromarket
Building a
localised
understandi
ng of market
requirement
through
analytics
and efficient
distribution
strategy
International
cross
functional
collaboratio
n and
external
partnerships
Process
decongestio
n and
operational
flexibility
Decongestio
n of
processes to
improve
customer
experience
Leveraging
technology
and digital
across
businesses
Digital
platform for
seamless
performance
for all
segment of
customers
Omni channel experience
Product – Agnostic
Adopting a solution oriented
approach
Micromarket focused
Aligned to the texture of the
catchment
Segment – Agnostic
Right solution for customer
not dependent on segment
Client – centric
Building a distribution model
with client at core
Add product
to customer
& customer
to bank
Analytics to
identify
opportunity
Leverage
interlinkage
Design
product and
solution
Understand
customer
journey
Identify all
stakeholder
14.72%
15.09%
15.92%
1.06% 0.81%
18.35%
2.50%
18.42%
1.80%
16.89%
1.39%
16.11%
19.12%
19.16%
CAPITAL ADEQUACY
18.06%
14.43%
13.63%
13.39%
17.60%
16.80%
Tier I Common Equity Tier 1
220.72
189.39
268.08
313.51
383.47
FY2018 FY2019 FY2020 FY2021 FY2022
CORE OPERATING PROFIT
Core Operating Profit (` in billion)
FY2018 FY2019 FY2020 FY2021 FY2022
67.77
33.63
79.31
161.93
233.39
FY2018 FY2019 FY2020 FY2021 FY2022
STANDALONE NET PROFIT
Standalone Net Profit (` in billion)
5
FINANCIAL PAST
PERFORMANCE
LOAN &
ADVANCES-
8590.20billi
on
PROFIT
AFTER TAX-
233.39
billion
CORE
OPERATING
PROFIT-
383.47
billion
FINANCIAL PAST
PERFORMANCE
TOTAL ADVANCES
5,609.75
6,529.20
7,709.69
9,325.22
10,645.72
889.58
2,710.50
962.70
3,289.79
2,009.67
1,022.27
4,231.51
2,455.91
2,276.71
1,361.70
5,008.99
2,954.53
1,584.80
5,461.35
3,599.57
TOTAL DEPOSITS
Current Account (` in billion) Term Deposit (` in billion)
5,123.95
8,590.20
7,337.29
12.5%
4.8%
5.1%
6,452.90
8.4%
5,866.47
10.7%
30.9%
27.2%
28.2%
28.4%
29.2% 5.1%
45.5%
52.9%
51.8%
8.4%
2.7%
6.2%
8.9%
9.8%
4.1%
3.2% 8.8%
8.5% 50.3%
48.4%
Retail Business Banking Overseas
March March March March March Marc
h
March March March March
2018 2019 2020 2021 2022 201
8
2019 2020 2021 2022
Savings Account (` in billion) Total (` in billion) Rural Loans Domestic Corporate & SME Total (` in billion)
NET WORTH
1,051.60
1,083.68
1,165.04
1,475.09
Net Worth (Equity Share Capital, Reserves and Surplus)
1,705.12
March March March March March
2018 2019 2020 2021 2022
ADVANCES IN
BANKING- CASH
CREDIT, BANK
OVERDRAFT, LOAN
NET WORTH- TOTAL
ASSET VALUE-
TOTAL LIABILITIES
TOTAL
DEPOSITS=DEPOSI
TS+ALL CERTIFIED
DEPOSITS
Retail banking
• Savings accout
• Current account
• Loans
• Credit and Debit cards
• Digital Banking Services
Corporate banking
• Working Capital Finance
• Trade Services
• Cash management Services
• Project Finance
• Corporate advisory services
International banking
• Foreign currency account
• Foreign currency loans
• Trade finance services
Rural & Agricultural
banking
• Crop loans
• Tractor loans
• Agri business loans
Wealth management
• Investment advisory
• Portfolio management
• Estate planning services
Insurance
• Health insurance
• Travel insurance
• Car insurance
Investment banking
• Mergers & Acquisitions
• Debt & equity capital
markets
• Project finance
• Structured finance
LINE OF
ACTIVITIES
SWOT Analysis
WEAKNESSES
THREATS
STRENGTHS
OPPORTUNITIES
T
W
O
S • Strong Market
Position
• Widespread
Network
• Diverse Product
• Service Portfolio
• Digital Initiatives
• Digital Banking
• Rural & Agricultural
Banking
• Asset Quality
• Dependence on Wholesale
Funding
• Competition
• Regulatory
Environment
THREAT
• Increased market share of HDFC ABNK
and other fintech companies
• Complex regulatory system is threat for
company
STRENGTH
• Bank's market share in terms of deposits
was 6.8% and in terms of advances was
7.3%
• 5,300 branches 15,000 ATMs
• 24.9 million mobile banking customers
• 8.2 million internet banking customers
WEAKNESS
• Gross non-performing assets (NPAs) ratio
was 4.96%
• Share of retail deposits in total deposits
was 68%, which was lower than some of its
peers
OPPORTUNITY
• The shift towards digital banking presents
a significant opportunity in rural area
Positioning
At forefront of innovation in
Indian banking sector by
revolutionizing itself through
time .
SWOT DATA SUPPORT & POSITIONING
CAPM BETA
 Beta = 1 indicates that the stock's price moves in line with the
market; same level of risk
 Beta > 1 indicates higher volatility than the market; higher
level of risk
 Beta < 1 indicates lower volatility than the market; less risky
BETA Indication
 BETA is a measure of a stock's volatility in relation to
the overall market.
 Systematic Risks are those risks that affect the overall
stock markets.’
 “BETA” is used to evaluate systematic risks.
BETA Analysis – ICICI Bank
 To calculate ICICI Bank's beta, analyzed 5 years of the stock's historical
returns and compared them to the returns of the overall market ( Nifty
50).
 Based on our analysis, we calculated ICICI Bank's beta to be 1.354
ICIC1 Bank's stock is slightly more volatile than the overall market.
 Example:
ICICI Bank; its CAPM Beta is 1.354.
This implies if the stock market moves up by 5%, then HDFC Bank
stock will move up by 5 x 1.354 = 6.77%.
CAPM (Capital Asset Pricing Model)
Expected Rate of Return E(R)
E(R) = Rf + βs(Rm - Rf)
Rf = Risk free Return (Avg. of 5 years Treasury Yield)
= 2.09%
βs = 1.354
Rm = Expected Market Return = 25%
E(R) = 25.50%
Therefore as per CAPM, Expected Rate of Return is 33.02%.
Calculation of
Beta Value
& Conclusion
A beta value of 1.35434438 indicates that the
stock is slightly more volatile than the market.
This means that if the market were to move up or
down by 1%, ICICI Bank's stock price would be
expected to move up or down by 1.35%.
Investors use beta values to help assess the risk of
investing in a particular stock. A higher beta value
indicates higher risk and potentially higher
returns, while a lower beta value indicates lower
risk and potentially lower returns.
However, it's important to note that beta values
are not the only factor to consider when making
investment decisions, and investors should also
consider other factors such as company
fundamentals, industry trends, and overall market
conditions.
Beta Value
Thank You

TEAM 3_BA&V.pptx

  • 1.
    C.C.S NATIONAL INSTITUTEOF AGRICULTURAL MARKETING ( A Government of India Autonomous Organization Under Ministry of Agriculture and Farmers Welfare ) Submitted by: Group-3 Name Roll No. Pavan Kumar Dangi 1332 Pradeep 1335 Rituraj Singh 1344 Saurabh Singh 1347 Shivam Kumar Singh 1353 Soham Bhattacharyya 1355 Course Title- BUSINESS ANALYSIS & EVALUATION Submitted to: Dr. Shweta Sharma
  • 2.
    GLOBAL PERSPECTIVE OFBANKING SECTOR According to data from the World Bank, the total assets of the global banking sector amounted to over $147 trillion in 2019. Employed over 63 million people in 2019. SIZE & EMPLOYMENT cross-border banking assets totaled over $37 trillion in 2019, representing a significant portion of the global banking sector.. CROSS BORDER the banking sector accounted for over 40% of all credit to the private sector in 2019. ECONOMIC IMPACT The global financial crisis of 2008 highlighted the importance of maintaining a stable banking sector. FINANCIAL STABILITY
  • 3.
    BANKING SECTOR :-INDIAN PERSPECTIVE 12 public sector banks 22 private sector banks 12 small finance banks 45 foreign banks 43 regional rural banks Total banking asset = $2.16T CAGR = 2.25% No of offline & online ATMs = 252000 Total loan CAGR = 8.77% Total deposit CAGR = 8.48% Major investors Major fintech clusters New Delhi - 196 Gurugram - 116 Mumbai - 428 Hyderabad - 125 Bengaluru - 432 Total bank branches – 123000 Total deposit - $2T Digital lending CAGR – 48% Personal loan CAGR – 27%
  • 4.
    About ICICI • ICICIwas formed in 1955 by the initiative taken by world bank in collaboration with Govt of India • ICICI bank was incorporated in 1994 as part of ICICI group • ICICI became the first Asian non Japan bank to be listed on New York Stock Exchange History 14,112.98 Billion=Standalone T otalAssets 383.47 Billion = Core Operating Profit 233.39 Billion=ProfitAfter Tax 474.66 Billion = Net Interest Income 3.96% = Net Interest Margin* 10,645.72 Billion =Period-end Deposits 8,590.20 Billion = Period-end Advances 19.16% =T otalCapital Adequacy Ratio Investor – People’s Bank of China Total funding amount – 100.2B No of investment – 27 Lead investment – 12 Biggest investment – Bharat pe (2.5B) Recent investment – SatSure No of exits – 3 Acquisition – Bank of Rajasthan (2010) Stock symbol – NSE:ICICIBANK IPO share price - $11 All currency is in INR except specifically denoted
  • 5.
    Rural outreach- 51%of the Bank’s branches are in rural and semi-urban areas with 649 branches in villages that were previously unbanked. UPI transactions was 2.3 times-The value of UPI person-to-merchant transactions in fiscal 2022 was 2.3 times as compared to fiscal 2021. Working towards inclusion-ICICI Bank has provided loans to over nine million women beneficiaries through more than 692,000 Self-Help Groups (SHGs) till March 31, 2022. Of these, 3.8 million were first-time borrowers. Over 750,000 individuals trained--ICICI Foundation for Inclusive Growth, CSR arm of ICICI Group, has trained over 750,000 less privileged individuals in the country since inception. Market leader in FASTag-ICICI Bank continues to be the leading bank in electronic toll collections through FASTag with a market share of close to 33%. Our electronic toll collections through FASTag increased by 51.9% year-on-year in fiscal 2022 ICICI BANK AT A GLANCE Mobile Pay – built for all,built for scale-6.3 million activations of iMobile Pay by non-ICICI Bank account holders till March 31, 2022. Mobile Pay – built for all,built for scale-6.3 million activations of iMobile Pay by non-ICICI Bank account holders till March 31, 2022.
  • 6.
    m n Provide credit to support consumptionand economic activity Enable financial inclusion Facilitate payments and transactions Enable wealth creation and management Provide savings products c a BUSINESS MODEL Capitals of ICICI • Financial capital • Human capital • Intellectual capital • Manufactured capital • Social & Relationship capital • Nature capital VISION To be the trusted financial services provider of choice for our customers, thereby creating sustainable value for ourstakeholders MISSION To grow ourrisk-calibrated core operating profit by: •Delivering products and services that create valuefor customers •Bringing together all our capabilities to seamlessly meet customerneeds •Conducting our business within well-defined risk tolerance levels
  • 7.
    BUSINESS STRATEGY 360 customer centric approach One stop for meetingall banking needs required by customer with focus on risk and reward Focus on ecosystem Serving customers and their ecosystem Focus on micromarket Building a localised understandi ng of market requirement through analytics and efficient distribution strategy International cross functional collaboratio n and external partnerships Process decongestio n and operational flexibility Decongestio n of processes to improve customer experience Leveraging technology and digital across businesses Digital platform for seamless performance for all segment of customers Omni channel experience Product – Agnostic Adopting a solution oriented approach Micromarket focused Aligned to the texture of the catchment Segment – Agnostic Right solution for customer not dependent on segment Client – centric Building a distribution model with client at core Add product to customer & customer to bank Analytics to identify opportunity Leverage interlinkage Design product and solution Understand customer journey Identify all stakeholder
  • 8.
    14.72% 15.09% 15.92% 1.06% 0.81% 18.35% 2.50% 18.42% 1.80% 16.89% 1.39% 16.11% 19.12% 19.16% CAPITAL ADEQUACY 18.06% 14.43% 13.63% 13.39% 17.60% 16.80% TierI Common Equity Tier 1 220.72 189.39 268.08 313.51 383.47 FY2018 FY2019 FY2020 FY2021 FY2022 CORE OPERATING PROFIT Core Operating Profit (` in billion) FY2018 FY2019 FY2020 FY2021 FY2022 67.77 33.63 79.31 161.93 233.39 FY2018 FY2019 FY2020 FY2021 FY2022 STANDALONE NET PROFIT Standalone Net Profit (` in billion) 5 FINANCIAL PAST PERFORMANCE LOAN & ADVANCES- 8590.20billi on PROFIT AFTER TAX- 233.39 billion CORE OPERATING PROFIT- 383.47 billion
  • 9.
    FINANCIAL PAST PERFORMANCE TOTAL ADVANCES 5,609.75 6,529.20 7,709.69 9,325.22 10,645.72 889.58 2,710.50 962.70 3,289.79 2,009.67 1,022.27 4,231.51 2,455.91 2,276.71 1,361.70 5,008.99 2,954.53 1,584.80 5,461.35 3,599.57 TOTALDEPOSITS Current Account (` in billion) Term Deposit (` in billion) 5,123.95 8,590.20 7,337.29 12.5% 4.8% 5.1% 6,452.90 8.4% 5,866.47 10.7% 30.9% 27.2% 28.2% 28.4% 29.2% 5.1% 45.5% 52.9% 51.8% 8.4% 2.7% 6.2% 8.9% 9.8% 4.1% 3.2% 8.8% 8.5% 50.3% 48.4% Retail Business Banking Overseas March March March March March Marc h March March March March 2018 2019 2020 2021 2022 201 8 2019 2020 2021 2022 Savings Account (` in billion) Total (` in billion) Rural Loans Domestic Corporate & SME Total (` in billion) NET WORTH 1,051.60 1,083.68 1,165.04 1,475.09 Net Worth (Equity Share Capital, Reserves and Surplus) 1,705.12 March March March March March 2018 2019 2020 2021 2022 ADVANCES IN BANKING- CASH CREDIT, BANK OVERDRAFT, LOAN NET WORTH- TOTAL ASSET VALUE- TOTAL LIABILITIES TOTAL DEPOSITS=DEPOSI TS+ALL CERTIFIED DEPOSITS
  • 10.
    Retail banking • Savingsaccout • Current account • Loans • Credit and Debit cards • Digital Banking Services Corporate banking • Working Capital Finance • Trade Services • Cash management Services • Project Finance • Corporate advisory services International banking • Foreign currency account • Foreign currency loans • Trade finance services Rural & Agricultural banking • Crop loans • Tractor loans • Agri business loans Wealth management • Investment advisory • Portfolio management • Estate planning services Insurance • Health insurance • Travel insurance • Car insurance Investment banking • Mergers & Acquisitions • Debt & equity capital markets • Project finance • Structured finance LINE OF ACTIVITIES
  • 11.
    SWOT Analysis WEAKNESSES THREATS STRENGTHS OPPORTUNITIES T W O S •Strong Market Position • Widespread Network • Diverse Product • Service Portfolio • Digital Initiatives • Digital Banking • Rural & Agricultural Banking • Asset Quality • Dependence on Wholesale Funding • Competition • Regulatory Environment
  • 12.
    THREAT • Increased marketshare of HDFC ABNK and other fintech companies • Complex regulatory system is threat for company STRENGTH • Bank's market share in terms of deposits was 6.8% and in terms of advances was 7.3% • 5,300 branches 15,000 ATMs • 24.9 million mobile banking customers • 8.2 million internet banking customers WEAKNESS • Gross non-performing assets (NPAs) ratio was 4.96% • Share of retail deposits in total deposits was 68%, which was lower than some of its peers OPPORTUNITY • The shift towards digital banking presents a significant opportunity in rural area Positioning At forefront of innovation in Indian banking sector by revolutionizing itself through time . SWOT DATA SUPPORT & POSITIONING
  • 13.
    CAPM BETA  Beta= 1 indicates that the stock's price moves in line with the market; same level of risk  Beta > 1 indicates higher volatility than the market; higher level of risk  Beta < 1 indicates lower volatility than the market; less risky BETA Indication  BETA is a measure of a stock's volatility in relation to the overall market.  Systematic Risks are those risks that affect the overall stock markets.’  “BETA” is used to evaluate systematic risks.
  • 14.
    BETA Analysis –ICICI Bank  To calculate ICICI Bank's beta, analyzed 5 years of the stock's historical returns and compared them to the returns of the overall market ( Nifty 50).  Based on our analysis, we calculated ICICI Bank's beta to be 1.354 ICIC1 Bank's stock is slightly more volatile than the overall market.  Example: ICICI Bank; its CAPM Beta is 1.354. This implies if the stock market moves up by 5%, then HDFC Bank stock will move up by 5 x 1.354 = 6.77%.
  • 15.
    CAPM (Capital AssetPricing Model) Expected Rate of Return E(R) Expected Rate of Return E(R) E(R) = Rf + βs(Rm - Rf) Rf = Risk free Return (Avg. of 5 years Treasury Yield) = 2.09% βs = 1.354 Rm = Expected Market Return = 25% E(R) = 25.50% Therefore as per CAPM, Expected Rate of Return is 33.02%.
  • 16.
    Calculation of Beta Value &Conclusion A beta value of 1.35434438 indicates that the stock is slightly more volatile than the market. This means that if the market were to move up or down by 1%, ICICI Bank's stock price would be expected to move up or down by 1.35%. Investors use beta values to help assess the risk of investing in a particular stock. A higher beta value indicates higher risk and potentially higher returns, while a lower beta value indicates lower risk and potentially lower returns. However, it's important to note that beta values are not the only factor to consider when making investment decisions, and investors should also consider other factors such as company fundamentals, industry trends, and overall market conditions. Beta Value
  • 17.

Editor's Notes

  • #11 Š Copyright PresentationGO.com – The free PowerPoint and Google Slides template library
  • #13 Š Copyright PresentationGO.com – The free PowerPoint and Google Slides template library