Download as PDF, PPTX


![Autumn Leaves: Curing the Window Plague in IDEs
D. Roethlisberger, O. Nierstrasz, S. Ducasse
WCRE 2009, 237–246
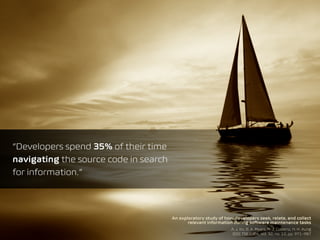
“Developers are forced to open views on
numerous source artifacts […], leading to a
crowded workspace.”](https://image.slidesharecdn.com/roby-icpc2016-160516221749/85/Taming-the-IDE-with-Fine-Grained-Interaction-Data-8-320.jpg)


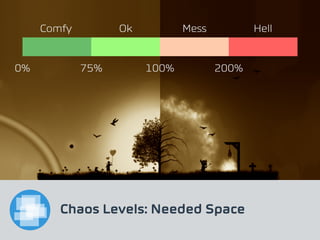


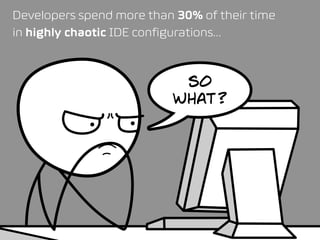


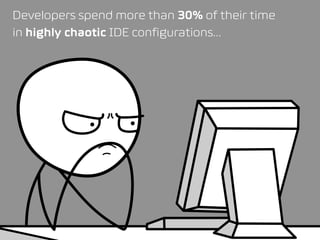


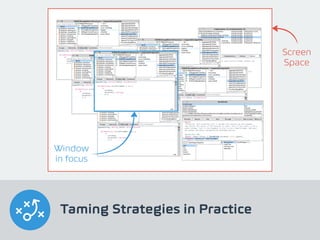


The document analyzes how developers utilize Integrated Development Environments (IDEs) and highlights the chaotic nature of their user interfaces. It reports that developers spend over 30% of their time in highly disorganized IDE configurations, which impacts their productivity and understanding. The study suggests strategies such as elision and layout modifications to mitigate this chaos and improve user interaction with IDEs.


![SAMOA – A Visual Software Analytics Platform for Mobile Applications [ICSM2013]](https://cdn.slidesharecdn.com/ss_thumbnails/minelli-samoa-icsm-td-130928051707-phpapp01-thumbnail.jpg?width=640&height=640&fit=bounds)
![Visual Storytelling of Development Sessions [ICSME2014]](https://cdn.slidesharecdn.com/ss_thumbnails/roby-icsme2014-era-150420105021-conversion-gate01-thumbnail.jpg?width=640&height=640&fit=bounds)

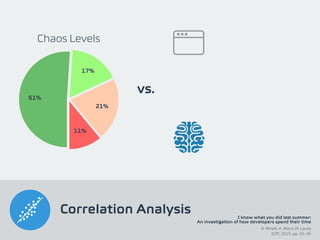
![I Know What You Did Last Summer [ICPC 2025 MIP Award]](https://cdn.slidesharecdn.com/ss_thumbnails/icpc2015-mip-talk-250516095029-b79a4ccf-thumbnail.jpg?width=640&height=640&fit=bounds)


![Visualizing the Workflow of Developers [VISSOFT2013]](https://cdn.slidesharecdn.com/ss_thumbnails/dflow-vissoft-2013-130928052045-phpapp02-thumbnail.jpg?width=640&height=640&fit=bounds)
![Towards Self-Adaptive IDEs [ICSME2014]](https://cdn.slidesharecdn.com/ss_thumbnails/roby-icsme2014-doctoral-150420104711-conversion-gate01-thumbnail.jpg?width=640&height=640&fit=bounds)

![Visualizing Developer Interactions [VISSOFT2014]](https://cdn.slidesharecdn.com/ss_thumbnails/roby-vissoft2014-150420105259-conversion-gate01-thumbnail.jpg?width=640&height=640&fit=bounds)


![Free Hugs — Praising developers for their actions [ICSE2015]](https://cdn.slidesharecdn.com/ss_thumbnails/roby-icse2015-nier-150520114654-lva1-app6891-thumbnail.jpg?width=640&height=640&fit=bounds)


![Quantifying Program Comprehension with Interaction Data [QSIC2014]](https://cdn.slidesharecdn.com/ss_thumbnails/roby-qsic2014-150420105439-conversion-gate02-thumbnail.jpg?width=640&height=640&fit=bounds)
![SYN: Ultra-Scale
Software Evolution Comprehension [ICPC 2023]](https://cdn.slidesharecdn.com/ss_thumbnails/gianlo-icpc2023-td-230601075503-1be84b82-thumbnail.jpg?width=640&height=640&fit=bounds)


