
Recommended
More Related Content
Similar to Tamil Nadu Engineering Colleges Rating or Ranking 2016
Similar to Tamil Nadu Engineering Colleges Rating or Ranking 2016 (20)
Recently uploaded
Recently uploaded (20)
Tamil Nadu Engineering Colleges Rating or Ranking 2016
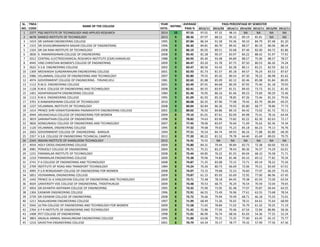
- 1. 2015/11 2015/05 2014/11 2014/05 2013/11 2013/05 2012/11 1 2377 PSG INSTITUTE OF TECHNOLOGY AND APPLIED RESEARCH 2014 10 97.55 97.01 97.32 98.33 NA NA NA NA 2 4678 RAMCO INSTITUTE OF TECHNOLOGY 2013 9 88.36 87.97 88.52 90.32 89.19 85.81 NA NA 3 1419 SRI SAIRAM ENGINEERING COLLEGE 1995 9 87.84 86.34 91.58 93.36 90.10 84.79 87.48 81.20 4 1315 SRI SIVASUBRAMANIYA NADAR COLLEGE OF ENGINEERING 1996 9 86.30 84.81 86.70 89.42 88.57 80.19 86.06 88.34 5 1324 SRI SAI RAM INSTITUTE OF TECHNOLOGY 2008 9 86.19 85.05 89.51 92.68 87.49 82.00 84.72 81.86 6 3830 K. RAMAKRISHNAN COLLEGE OF ENGINEERING 2008 9 85.45 81.28 90.37 83.97 84.22 88.42 91.97 77.91 7 5012 CENTRAL ELECTROCHEMICAL RESEARCH INSTITUTE (CSIR) KARAIKUDI 1988 9 84.93 85.40 93.48 84.89 88.57 75.00 88.57 78.57 8 4945 VINS CHRISTIAN WOMEN'S COLLEGE OF ENGINEERING 2009 9 84.47 83.20 91.78 87.75 87.50 80.53 86.26 74.24 9 2622 V.S.B. ENGINEERING COLLEGE 2002 9 83.47 80.56 93.42 82.28 80.11 83.21 82.59 82.12 10 1309 MEENAKSHI SUNDARARAJAN ENGINEERING COLLEGE 2001 9 82.93 81.73 81.57 85.18 84.57 76.24 83.53 87.67 11 5986 VELAMMAL COLLEGE OF ENGINEERING AND TECHNOLOGY 2007 9 82.80 79.55 85.42 80.54 87.30 78.22 86.98 81.62 12 4974 GOVERNMENT COLLEGE OF ENGINEERING - TIRUNELVELI 1981 9 82.65 81.88 85.09 82.12 82.46 85.08 81.84 80.05 13 1112 R.M.D. ENGINEERING COLLEGE 2001 9 82.49 87.91 84.68 80.39 87.92 75.40 81.18 79.93 14 1128 R.M.K. COLLEGE OF ENGINEERING AND TECHNOLOGY 2008 9 82.41 85.55 83.97 81.51 89.43 73.73 81.21 81.45 15 1401 ADHIPARASAKTHI ENGINEERING COLLEGE 1984 9 81.46 76.95 86.16 81.46 89.23 73.69 90.29 72.46 16 1113 R.M.K. ENGINEERING COLLEGE 1995 9 81.09 81.92 85.32 78.85 87.26 73.46 81.24 79.56 17 3701 K.RAMAKRISHNAN COLLEGE OF TECHNOLOGY 2010 9 80.08 82.25 87.96 77.08 79.42 83.79 80.84 69.25 18 1237 VELAMMAL INSTITUTE OF TECHNOLOGY 2008 9 80.04 82.84 86.36 79.93 85.80 68.77 78.86 77.73 19 1414 PRINCE SHRI VENKATESHWARA PADMAVATHY ENGINEERING COLLEGE 2001 9 80.02 76.92 84.86 89.10 84.42 73.02 81.72 70.11 20 4944 ARUNACHALA COLLEGE OF ENGINEERING FOR WOMEN 2009 8 79.10 81.01 87.61 82.09 84.98 75.41 78.16 64.44 21 3819 SARANATHAN COLLEGE OF ENGINEERING 1998 8 78.82 74.63 83.96 73.82 82.22 82.30 82.63 72.17 22 3826 KONGUNADU COLLEGE OF ENGINEERING AND TECHNOLOGY 2007 8 77.45 78.06 83.07 76.60 71.09 76.62 82.36 74.34 23 1120 VELAMMAL ENGINEERING COLLEGE 1995 8 77.32 79.68 79.02 75.23 85.18 66.23 79.13 76.76 24 2603 GOVERNMENT COLLEGE OF ENGINEERING - BARGUR 1994 8 77.21 76.54 84.74 69.93 86.16 71.88 82.80 68.39 25 2357 V.S.B. COLLEGE OF ENGINEERING TECHNICAL CAMPUS 2012 8 77.20 80.22 81.52 79.78 64.40 65.69 89.03 79.75 26 2343 INDIAN INSTITUTE OF HANDLOOM TECHNOLOGY 2015 8 76.92 76.92 NA NA NA NA NA NA 27 4934 HOLY CROSS ENGINEERING COLLEGE 2009 8 75.80 84.31 79.44 90.84 83.73 72.38 60.60 59.33 28 4981 PONJESLY COLLEGE OF ENGINEERING 2004 8 75.71 75.21 83.27 78.43 80.36 76.37 74.29 62.01 29 1231 PANIMALAR INSTITUTE OF TECHNOLOGY 2008 8 75.44 69.85 76.22 81.55 84.04 68.10 76.58 71.71 30 1210 PANIMALAR ENGINEERING COLLEGE 2000 8 75.38 70.96 74.84 81.48 83.10 69.12 77.82 70.34 31 2741 P A COLLEGE OF ENGINEERING AND TECHNOLOGY 2008 8 74.87 71.25 83.08 73.15 73.71 69.14 78.22 75.56 32 2709 INSTITUTE OF ROAD AND TRANSPORT TECHNOLOGY 1984 8 74.24 70.26 80.73 66.69 72.06 79.21 83.69 67.01 33 4995 P.S.R.RENGASAMY COLLEGE OF ENGINEERING FOR WOMEN 2008 8 74.07 73.15 79.68 72.23 76.60 77.07 66.29 73.45 34 5851 VEERAMMAL ENGINEERING COLLEGE 2009 8 73.87 61.15 85.93 65.69 72.92 77.00 86.96 67.45 35 1442 PRINCE Dr.K.VASUDEVAN COLLEGE OF ENGINEERING AND TECHNOLOGY 2009 8 73.71 72.48 78.18 84.45 79.38 65.93 72.00 63.54 36 4024 UNIVERSITY VOC COLLEGE OF ENGINEERING, THOOTHUKUDI 2009 8 73.48 70.53 68.75 76.24 76.54 70.59 72.04 79.65 37 4954 DR.SIVANTHI ADITANAR COLLEGE OF ENGINEERING 1995 8 73.32 75.90 73.95 81.48 77.07 70.87 69.44 64.55 38 1304 EASWARI ENGINEERING COLLEGE 1996 8 72.91 66.55 73.49 76.96 77.61 63.55 73.68 78.54 39 2739 SRI ESHWAR COLLEGE OF ENGINEERING 2008 8 72.72 76.66 79.94 70.49 68.71 66.18 75.03 72.01 40 1211 RAJALAKSHMI ENGINEERING COLLEGE 1997 8 71.99 68.49 71.26 76.65 78.31 64.61 75.64 68.99 41 5942 ULTRA COLLEGE OF ENGINEERING AND TECHNOLOGY FOR WOMEN 2009 8 71.58 71.65 78.84 71.02 76.79 61.32 70.25 71.19 42 2764 K P R INSTITUTE OF ENGINEERING AND TECHNOLOGY 2009 8 71.42 72.86 77.04 70.46 67.54 72.84 80.86 58.36 43 1408 IFET COLLEGE OF ENGINEERING 1998 8 71.01 86.90 76.74 68.56 81.03 54.36 77.25 52.24 44 3803 ANJALAI AMMAL MAHALINGAM ENGINEERING COLLEGE 1995 8 71.00 63.00 79.31 73.35 77.00 63.45 65.15 75.77 45 1216 SAVEETHA ENGINEERING COLLEGE 2001 8 70.79 64.34 70.17 78.77 79.32 57.99 77.56 67.36 SL. NO. TNEA CODE NAME OF THE COLLEGE YEAR ESTD. RATING AVERAGE PASS % PASS PERCENTAGE BY SEMESTER
- 2. 2015/11 2015/05 2014/11 2014/05 2013/11 2013/05 2012/11 SL. NO. TNEA CODE NAME OF THE COLLEGE YEAR ESTD. RATING AVERAGE PASS % PASS PERCENTAGE BY SEMESTER 46 4959 KAMARAJ COLLEGE OF ENGINEERING AND TECHNOLOGY 1998 8 70.74 69.77 73.09 66.84 70.69 70.78 75.09 68.93 47 1140 JEPPIAAR INSTITUTE OF TECHNOLOGY 2011 8 70.44 69.87 71.18 76.14 79.67 59.41 71.43 65.38 48 1432 RAJALAKSHMI INSTITUTE OF TECHNOLOGY 2008 8 70.41 65.59 73.13 80.25 79.21 58.86 71.64 64.21 49 1317 St.JOSEPH'S COLLEGE OF ENGINEERING 1994 8 70.06 67.45 68.71 74.24 72.99 60.40 71.26 75.35 50 1605 IDHAYA ENGINEERING COLLEGE FOR WOMEN 2001 7 69.99 73.63 75.67 62.11 63.33 68.70 81.82 64.68 51 1516 THANTHAI PERIYAR GOVT INSTITUTE OF TECHNOLOGY 1990 7 69.84 61.31 73.56 75.39 79.71 62.98 70.63 65.27 52 1501 ADHIPARASAKTHI COLLEGE OF ENGINEERING 2001 7 69.71 65.98 78.74 85.29 86.75 64.70 59.11 47.37 53 2727 SRI SHAKTHI INSTITUTE OF ENGINEERING AND TECHNOLOGY 2006 7 69.37 69.08 71.13 67.63 66.75 70.17 79.62 61.23 54 5904 K.L.N.COLLEGE OF ENGINEERING 1994 7 69.33 65.69 75.24 68.65 76.56 59.60 71.70 67.87 55 4023 UNIVERSITY COLLEGE OF ENGINEERING, NAGERCOIL 2009 7 69.07 57.33 68.76 62.60 71.76 66.96 80.24 75.86 56 1520 KINGSTON ENGINEERING COLLEGE 2008 7 68.92 65.57 71.69 75.95 73.66 59.74 67.98 67.82 57 4864 V V COLLEGE OF ENGINEERING 2010 7 68.65 73.32 72.59 76.57 72.59 66.64 58.93 59.93 58 1106 JAYA ENGINEERING COLLEGE 1995 7 68.21 65.33 72.89 74.15 77.30 55.60 67.85 64.34 59 1219 SRI VENKATESWARA COLLEGE OF ENGINEERING 1985 7 68.14 64.37 65.74 69.88 73.82 61.30 74.98 66.91 60 2610 MUTHAYAMMAL ENGINEERING COLLEGE 2000 7 68.10 59.20 69.42 49.92 62.08 69.76 86.67 79.65 61 5022 UNIVERSITY COLLEGE OF ENGINEERING, DINDIGUL 2009 7 68.06 58.82 78.85 61.91 60.64 71.56 79.55 65.11 62 2757 TEJAA SHAKTHI INSTITUTE OF TECHNOLOGY FOR WOMEN 2008 7 67.87 67.18 69.16 69.08 71.23 76.53 76.97 44.96 63 5910 PSNA COLLEGE OF ENGINEERING AND TECHNOLOGY 1984 7 67.72 58.80 75.38 62.51 65.98 69.77 74.09 67.51 64 1306 JEPPIAAR ENGINEERING COLLEGE 2001 7 67.69 64.80 67.61 72.58 69.75 60.40 66.40 72.32 65 1320 JEPPIAAR SRR ENGINEERING COLLEGE 2002 7 67.58 65.20 68.98 73.26 69.63 57.74 66.62 71.66 66 2302 SRI SHANMUGHA COLLEGE OF ENGINEERING AND TECHNOLOGY 2011 7 67.58 68.35 78.13 61.58 54.48 70.71 79.50 60.33 67 1450 LOYOLA - ICAM COLLEGE OF ENGINEERING AND TECHNOLOGY 2010 7 67.40 66.67 73.58 73.35 70.55 62.10 60.50 65.04 68 2653 KNOWLEDGE INSTITUTE OF TECHNOLOGY 2009 7 67.32 68.53 74.05 61.04 78.15 55.04 71.16 63.25 69 1321 CENTRAL INSTITUTE OF PLASTICS ENGINEERING AND TECHNOLOGY 2008 7 67.07 63.24 69.79 68.57 71.60 61.40 62.01 72.86 70 1118 VEL TECH MULTI TECH DR.RANGARAJAN DR.SAKUNTHALA ENGINEERING COLLEGE 2000 7 66.65 72.29 72.42 66.26 77.77 52.26 64.65 60.90 71 2349 DHAANISH AHMED INSTITUTE OF TECHNOLOGY 2013 7 66.49 71.49 60.74 60.95 72.58 66.67 NA NA 72 3795 TRP ENGINEERING COLLEGE 2010 7 66.45 73.82 77.32 67.31 77.99 56.17 66.64 45.88 73 1303 ANAND INSTITUTE OF HIGHER TECHNOLOGY 2000 7 66.36 60.22 66.67 74.10 69.50 55.70 64.60 73.73 74 2621 ER.PERUMAL MANIMEKALAI COLLEGE OF ENGINEERING 2002 7 66.21 72.12 73.65 58.83 74.12 52.63 70.53 61.56 75 4971 St.XAVIER'S CATHOLIC COLLEGE OF ENGINEERING 1998 7 66.09 59.47 72.00 66.60 70.05 61.75 72.57 60.21 76 2626 VIVEKANANDHA INSTITUTE OF ENGINEERING & TECHNOLOGY FOR WOMEN 2006 7 66.06 67.76 65.66 51.02 80.69 59.22 76.49 61.60 77 2742 MAHARAJA ENGINEERING COLLEGE FOR WOMEN 2008 7 66.03 61.74 81.08 56.64 72.48 71.43 70.52 48.33 78 1114 S.A. ENGINEERING COLLEGE 1998 7 65.94 68.40 69.62 72.52 72.56 47.80 66.80 63.91 79 2707 ERODE SENGUNTHAR ENGINEERING COLLEGE 1996 7 65.86 62.38 74.83 53.34 66.74 69.32 76.84 57.56 80 1026 UNIVERSITY COLLEGE OF ENGINEERING, KANCHIPURAM 2010 7 65.82 62.54 71.71 73.83 77.36 56.06 56.35 62.90 81 2639 NARASU'S SARATHY INSTITUTE OF TECHNOLOGY 2008 7 65.47 53.47 69.51 57.05 78.29 57.71 78.16 64.12 82 2630 CHETTINAD COLLEGE OF ENGINEERING AND TECHNOLOGY 2007 7 65.31 57.77 73.92 58.81 63.44 69.19 67.59 66.48 83 1015 UNIVERSITY COLLEGE OF ENGINEERING, ARNI 2009 7 65.29 53.68 69.46 72.58 76.50 57.74 68.19 58.90 84 3011 UNIVERSITY COLLEGE OF ENGINEERING, TIRUCHIRAPPALLI 1999 7 65.01 55.64 72.55 55.76 64.42 68.69 78.49 59.51 85 2725 SRI RAMAKRISHNA INSTITUTE OF TECHNOLOGY 2002 7 64.79 64.65 67.54 64.78 64.44 66.13 72.00 54.02 86 2723 VELALAR COLLEGE OF ENGINEERING AND TECHNOLOGY 2001 7 64.35 68.32 76.10 60.78 62.66 66.35 67.02 49.23 87 1310 MISRIMAL NAVAJEE MUNOTH JAIN ENGINEERING COLLEGE 1994 7 64.29 63.67 67.23 70.86 65.83 52.07 60.88 69.46 88 2762 JANSONS INSTITUTE OF TECHNOLOGY 2009 7 64.22 62.90 69.85 61.52 60.30 71.53 70.05 53.38 89 1013 UNIVERSITY COLLEGE OF ENGINEERING, VILLUPURAM 2008 7 64.14 70.12 59.76 54.33 67.42 52.98 81.97 62.38 90 1110 PRATHYUSHA ENGINEERING COLLEGE 2001 7 64.11 63.33 68.44 69.70 69.74 48.48 65.23 63.83
- 3. 2015/11 2015/05 2014/11 2014/05 2013/11 2013/05 2012/11 SL. NO. TNEA CODE NAME OF THE COLLEGE YEAR ESTD. RATING AVERAGE PASS % PASS PERCENTAGE BY SEMESTER 91 5530 SSM INSTITUTE OF ENGINEERING AND TECHNOLOGY 2011 7 64.09 56.68 78.67 64.98 56.63 64.54 68.73 58.41 92 2642 P.S.V.COLLEGE OF ENGINEERING AND TECHNOLOGY 2008 7 63.97 72.35 70.02 56.85 71.46 54.86 66.59 55.67 93 2735 KARPAGAM INSTITUTE OF TECHNOLOGY 2008 7 63.73 60.79 74.67 60.57 60.67 56.01 69.54 63.89 94 2656 ERODE BUILDER EDUCATIONAL TRUST'S GROUP OF INSTITUTIONS 2009 7 63.60 63.48 75.54 55.37 61.01 64.84 71.53 53.46 95 3852 SRI BHARATHI ENGINEERING COLLEGE FOR WOMEN 2009 7 63.58 54.71 66.67 62.38 76.23 50.25 66.88 67.94 96 3801 A.V.C COLLEGE OF ENGINEERING 1996 7 63.20 53.18 72.85 62.63 70.73 55.03 57.62 70.38 97 1311 K.C.G. COLLEGE OF TECHNOLOGY 1998 7 62.79 52.88 60.90 66.80 67.33 56.44 65.86 69.34 98 2733 ANGEL COLLEGE OF ENGINEERING AND TECHNOLOGY 2007 7 62.69 57.71 64.23 60.06 62.16 64.65 73.67 56.34 99 5907 MOHAMED SATHAK ENGINEERING COLLEGE 1984 7 62.68 63.59 73.81 63.58 73.32 47.97 62.75 53.73 100 1504 ARUNAI ENGINEERING COLLEGE 1993 7 62.59 53.29 62.90 67.97 74.02 53.93 65.11 60.89 101 1014 UNIVERSITY COLLEGE OF ENGINEERING, TINDIVANAM 2008 7 62.58 51.90 62.77 55.24 65.67 53.73 81.42 67.31 102 2734 S N S COLLEGE OF ENGINEERING 2007 7 62.47 62.40 65.88 60.59 59.17 66.10 73.10 50.06 103 5921 SYED AMMAL ENGINEERING COLLEGE 1998 7 62.44 59.29 67.09 61.75 70.52 51.32 64.41 62.67 104 1416 JAYA SAKTHI ENGINEERING COLLEGE 2001 7 62.41 54.49 72.82 69.72 70.58 48.72 58.84 61.71 105 2661 VIVEKANANDHA COLLEGE OF TECHNOLOGY FOR WOMEN 2009 7 62.38 61.82 61.04 49.27 75.00 57.09 72.11 60.35 106 2654 S V S COLLEGE OF ENGINEERING 2009 7 62.23 61.86 75.27 61.47 60.91 53.07 65.23 57.78 107 5903 K.L.N.COLLEGE OF INFORMATION TECHNOLOGY 2001 7 62.02 58.66 69.80 61.82 70.07 49.55 62.70 61.55 108 1405 DHANALAKSHMI COLLEGE OF ENGINEERING 2001 7 61.86 49.63 63.06 74.02 61.91 52.60 70.35 61.44 109 1122 VEL TECH HIGH TECH DR.RANGARAJAN DR.SAKUNTHALA ENGINEERING COLLEGE 2002 7 61.66 59.32 67.62 60.61 70.28 48.72 66.54 58.54 110 3804 ARASU ENGINEERING COLLEGE 2001 7 61.53 46.70 72.64 62.10 72.61 56.87 52.88 66.91 111 5017 UNIVERSITY COLLEGE OF ENGINEERING, RAMANATHAPURAM 2008 7 61.34 54.51 64.87 57.55 72.38 50.12 66.92 63.04 112 2345 DHIRAJLAL GANDHI COLLEGE OF TECHNOLOGY 2011 7 61.06 59.75 66.38 56.19 65.67 56.27 66.02 57.14 113 2640 JAYALAKSHMI INSTITUTE OF TECHNOLOGY 2008 7 60.88 63.51 70.19 57.42 70.16 43.21 66.77 54.88 114 1241 T.J.S. ENGINEERING COLLEGE 2009 7 60.85 57.61 60.49 57.56 72.68 51.68 64.29 61.63 115 1512 S.K.P. ENGINEERING COLLEGE 1999 7 60.77 59.12 63.71 67.60 73.18 56.64 57.31 47.82 116 2638 MAHENDRA ENGINEERING COLLEGE FOR WOMEN 2008 7 60.73 48.29 60.32 45.74 75.52 56.89 76.68 61.67 117 3843 M R K INSTITUTE OF TECHNOLOGY 2009 7 60.71 70.49 73.28 49.11 66.97 50.44 49.14 65.55 118 3465 GOVERNMENT COLLEGE OF ENGINEERING - SRIRANGAM 2013 7 60.49 56.22 70.91 54.23 60.62 NA NA NA 119 1131 VEL TECH 2009 7 60.30 58.60 65.50 64.45 71.51 47.52 59.30 55.24 120 4979 V.P.MUTHAIAH PILLAI MEENAKSHI AMMAL ENGINEERING COLLEGE FOR WOMEN 2002 7 60.28 64.32 63.27 52.92 55.65 61.26 61.13 63.41 121 1149 St. JOSEPH'S INSTITUTE OF TECHNOLOGY 2011 7 60.26 64.74 62.90 70.72 57.87 51.04 52.68 61.90 122 2716 PARK COLLEGE OF ENGINEERING AND TECHNOLOGY 1997 7 60.23 57.48 65.62 58.71 59.59 62.16 68.87 49.15 123 4980 EINSTEIN COLLEGE OF ENGINEERING 2004 7 60.20 58.80 67.85 62.14 60.53 60.49 57.86 53.72 124 2328 K S R INSTITUTE FOR ENGINEERING AND TECHNOLOGY 2011 6 59.88 56.21 72.89 47.07 52.85 66.77 71.23 52.11 125 4953 CAPE INSTITUTE OF TECHNOLOGY 2001 6 59.86 58.16 60.42 70.56 68.85 51.95 63.75 45.34 126 2651 JAY SHRIRAM GROUP OF INSTITUTIONS 2009 6 59.80 58.28 67.41 65.88 56.59 64.99 66.77 38.70 127 5832 N P R COLLEGE OF ENGINEERING AND TECHNOLOGY 2008 6 59.64 48.93 70.87 54.20 58.70 54.63 69.01 61.12 128 3018 UNIVERSITY COLLEGE OF ENGINEERING, THIRUKKUVALAI 2008 6 59.62 45.76 67.48 54.12 68.96 56.32 54.42 70.27 129 2736 DR.N G P INSTITUTE OF TECHNOLOGY 2007 6 59.53 64.50 66.67 59.56 52.07 60.83 68.50 44.56 130 4955 FRANCIS XAVIER ENGINEERING COLLEGE 2000 6 59.50 60.42 57.90 54.65 56.16 58.69 65.54 63.14 131 5922 VICKRAM COLLEGE OF ENGINEERING 2001 6 59.45 50.84 68.07 57.35 71.33 53.04 60.20 55.30 132 3850 VETRI VINAYAHA COLLEGE OF ENGINEERING AND TECHNOLOGY 2009 6 59.33 57.56 73.38 51.00 51.05 63.04 66.58 52.69 133 2704 COIMBATORE INSTITUTE OF ENGINEERING AND TECHNOLOGY 2001 6 59.14 50.54 59.44 57.28 55.34 62.77 77.21 51.38 134 4993 LOYOLA INSTITUTE OF TECHNOLOGY AND SCIENCE 2008 6 59.06 61.80 65.69 60.98 64.90 51.91 63.76 44.41 135 2338 ASIAN COLLEGE OF ENGINEERING AND TECHNOLOGY 2013 6 59.04 67.32 61.08 47.72 63.16 55.93 NA NA
- 4. 2015/11 2015/05 2014/11 2014/05 2013/11 2013/05 2012/11 SL. NO. TNEA CODE NAME OF THE COLLEGE YEAR ESTD. RATING AVERAGE PASS % PASS PERCENTAGE BY SEMESTER 136 1209 PALLAVAN COLLEGE OF ENGINEERING 1997 6 58.85 40.47 58.92 64.09 73.87 51.50 63.66 59.47 137 3019 UNIVERSITY COLLEGE OF ENGINEERING, PANRUTI 2008 6 58.83 63.68 61.48 44.98 63.36 46.99 77.29 54.00 138 1207 KINGS ENGINEERING COLLEGE 2001 6 58.39 54.71 69.57 72.50 64.87 43.75 58.62 44.68 139 1399 CHENNAI INSTITUTE OF TECHNOLOGY 2010 6 58.34 72.48 72.66 69.66 68.05 37.93 50.16 37.41 140 2708 HINDUSTHAN COLLEGE OF ENGINEERING AND TECHNOLOGY 2000 6 58.23 51.25 63.73 58.79 55.15 53.25 64.49 60.95 141 2327 N.S.N. COLLEGE OF ENGINEERING AND TECHNOLOGY 2011 6 58.21 71.45 78.82 61.61 40.00 55.01 57.38 43.22 142 2617 SENGUNTHAR ENGINEERING COLLEGE 2001 6 58.15 58.11 67.78 45.89 67.57 46.27 64.63 56.77 143 3833 PARISUTHAM INSTITUTE OF TECHNOLOGY AND SCIENCE 2008 6 58.14 53.24 73.51 62.41 71.35 49.73 39.90 56.86 144 2768 PARK COLLEGE OF TECHNOLOGY 2009 6 58.04 51.93 67.02 54.73 58.31 56.43 66.88 51.01 145 5988 THENI KAMMAVAR SANGAM COLLEGE OF TECHNOLOGY 2007 6 57.90 45.44 78.58 52.38 53.34 55.22 67.50 52.81 146 1307 JERUSALEM COLLEGE OF ENGINEERING 1995 6 57.55 56.84 56.84 65.74 54.65 47.11 56.83 64.81 147 3464 GOVERNMENT COLLEGE OF ENGINEERING - THANJAVUR 2013 6 57.54 48.56 62.60 60.00 75.53 41.00 NA NA 148 1316 AGNI COLLEGE OF TECHNOLOGY 2001 6 57.43 52.59 57.59 62.83 59.71 44.22 56.86 68.22 149 4991 KALASALINGAM INSTITUTE OF TECHNOLOGY 2008 6 57.27 50.75 61.51 51.93 54.06 57.71 60.34 64.60 150 2732 INFO INSTITUTE OF ENGINEERING 2007 6 57.01 53.35 59.38 56.30 49.05 58.43 71.12 51.42 151 1126 JNN INSTITUTE OF ENGINEERING 2008 6 56.91 58.82 58.09 50.17 70.10 38.92 60.59 61.70 152 2721 TAMILNADU COLLEGE OF ENGINEERING 1984 6 56.90 54.76 63.62 57.22 54.36 57.27 66.27 44.81 153 1411 MADHA ENGINEERING COLLEGE 1998 6 56.63 53.24 63.80 61.44 67.43 42.51 59.54 48.44 154 2746 KTVR KNOWLEDGE PARK FOR ENGINEERING AND TECHNOLOGY 2008 6 56.63 51.46 67.75 54.17 60.64 58.16 65.44 38.79 155 1421 V.R.S. COLLEGE OF ENGINEERING AND TECHNOLOGY 1994 6 56.60 64.57 63.45 53.43 57.53 41.46 71.55 44.21 156 2752 NANDHA COLLEGE OF TECHNOLOGY 2008 6 56.46 52.94 64.68 43.95 58.16 64.33 66.46 44.67 157 4946 DMI ENGINEERING COLLEGE 2009 6 56.40 56.53 60.66 69.64 67.55 48.23 55.98 36.18 158 1115 SRIRAM ENGINEERING COLLEGE 1993 6 56.39 52.14 58.13 59.14 66.69 42.52 59.84 56.30 159 2751 KGISL INSTITUTE OF TECHNOLOGY 2008 6 56.38 53.92 63.36 54.16 55.46 54.49 64.99 48.26 160 1213 S.K.R. ENGINEERING COLLEGE 2001 6 56.36 46.24 55.17 67.75 67.83 45.57 61.27 50.68 161 2643 BHARATHIYAR INSTITUTE OF ENGINEERING FOR WOMEN 2008 6 56.25 44.43 56.21 41.96 53.92 61.69 71.68 63.89 162 2747 SHREE VENKATESHWARA HI-TECH ENGINEERING COLLEGE 2008 6 56.23 59.23 74.81 46.04 54.15 59.14 64.87 35.35 163 4941 UNNAMALAI INSTITUTE OF TECHNOLOGY 2009 6 56.18 54.03 65.18 56.81 61.83 57.84 46.36 51.22 164 1412 MAILAM ENGINEERING COLLEGE 1998 6 55.99 52.91 61.48 51.69 61.21 47.47 70.86 46.32 165 2367 ARJUN COLLEGE OF TECHNOLOGY 2013 6 55.91 58.50 57.43 43.13 61.54 58.97 NA NA 166 4982 VINS CHRISTIAN COLLEGE OF ENGINEERING 2004 6 55.81 48.90 61.76 50.99 64.76 50.59 65.62 48.03 167 4948 RAJAS INTERNATIONAL INSTITUTE OF TECHNOLOGY FOR WOMEN 2009 6 55.74 56.30 63.19 64.97 59.13 47.02 56.46 43.12 168 1230 APOLLO ENGINEERING COLLEGE 2007 6 55.59 70.55 64.38 66.90 65.90 33.75 50.58 37.05 169 1424 DHAANISH AHMED COLLEGE OF ENGINEERING 2002 6 55.56 48.50 60.42 66.25 60.75 43.21 56.46 53.36 170 1505 C.ABDUL HAKEEM COLLEGE OF ENGINEERING AND TECHNOLOGY 1998 6 55.44 45.06 57.98 62.35 65.85 47.73 57.25 51.83 171 1422 VALLIAMMAI ENGINEERING COLLEGE 1999 6 55.41 52.95 59.78 66.02 58.05 45.91 54.55 50.61 172 2750 KIT - KALAIGNAR KARUNANIDHI INSTITUTE OF TECHNOLOGY 2008 6 55.41 57.81 59.51 52.25 48.62 56.99 67.10 45.61 173 2763 AKSHAYA COLLEGE OF ENGINEERING & TECHNOLOGY 2009 6 55.15 49.17 64.76 53.40 54.25 43.66 62.22 58.61 174 1206 JEPPIAAR MAAMALLAN INSTITUTE OF TECHNOLOGY 2001 6 55.08 47.93 54.82 61.67 65.50 44.72 62.39 48.50 175 1218 SRI MUTHUKUMARAN INSTITUTE OF TECHNOLOGY 1996 6 55.07 50.31 54.90 61.45 64.22 44.52 60.73 49.33 176 2369 GOVERNMENT COLLEGE OF ENGINEERING - DHARMAPURI 2013 6 54.94 58.37 55.21 39.51 66.67 NA NA NA 177 3814 P.R.ENGINEERING COLLEGE 2000 6 54.80 34.02 66.70 43.44 69.64 53.57 52.20 64.04 178 3831 INDRA GANESAN COLLEGE OF ENGINEERING 2008 6 54.38 56.10 66.00 46.97 56.43 58.77 59.94 36.48 179 1509 MEENAKSHI COLLEGE OF ENGINEERING 2001 6 54.22 49.53 51.51 58.71 55.62 45.52 53.26 65.42 180 2765 SRIGURU INSTITUTE OF TECHNOLOGY 2009 6 53.90 48.02 60.06 49.54 45.27 59.55 73.84 41.03
- 5. 2015/11 2015/05 2014/11 2014/05 2013/11 2013/05 2012/11 SL. NO. TNEA CODE NAME OF THE COLLEGE YEAR ESTD. RATING AVERAGE PASS % PASS PERCENTAGE BY SEMESTER 181 3905 KINGS COLLEGE OF ENGINEERING 2001 6 53.86 40.75 68.37 50.73 63.50 47.35 47.60 58.72 182 2731 R V S COLLEGE OF ENGINEERING AND TECHNOLOGY 2007 6 53.78 53.79 55.93 49.45 49.17 56.03 67.15 44.95 183 2629 SENGUNTHAR COLLEGE OF ENGINEERING 2007 6 53.75 63.77 59.78 42.86 59.10 40.00 60.33 50.41 184 1508 ARUNAI COLLEGE OF ENGINEERING 2001 6 53.44 30.14 54.66 56.48 69.69 47.46 61.67 53.97 185 3810 M.A.M COLLEGE OF ENGINEERING 1998 6 53.27 58.17 59.22 47.42 62.42 49.07 58.13 38.43 186 4968 SARDAR RAJA COLLEGE OF ENGINEERING 2000 6 53.13 47.14 57.58 49.28 59.16 54.22 55.22 49.32 187 4680 AAA COLLEGE OF ENGINEERING AND TECHNOLOGY 2013 6 53.02 52.45 53.40 53.93 49.80 55.51 NA NA 188 2740 HINDUSTHAN INSTITUTE OF TECHNOLOGY 2007 6 53.01 53.12 58.43 49.70 47.19 49.53 58.29 54.79 189 1507 GANADIPATHY TULSI'S JAIN ENGINEERING COLLEGE 2000 6 52.98 42.76 54.80 57.96 66.18 44.20 54.32 50.64 190 1221 JAYA COLLEGE OF ENGINEERING AND TECHNOLOGY 2000 6 52.92 43.11 65.69 54.68 64.96 37.15 59.39 45.47 191 2609 MAHENDRA ENGINEERING COLLEGE 1995 6 52.71 53.27 64.38 38.36 61.03 NA 57.97 41.26 192 4969 SCAD COLLEGE OF ENGINEERING AND TECHNOLOGY 2001 6 52.68 52.36 56.10 50.74 52.39 50.68 54.73 51.79 193 1420 TAGORE ENGINEERING COLLEGE 1998 6 52.05 42.18 55.44 65.58 57.73 43.97 55.72 43.76 194 1427 SRI KRISHNA ENGINEERING COLLEGE 2000 6 51.87 27.41 42.51 61.68 66.79 56.46 58.30 49.94 195 1322 DHANALAKSHMI SRINIVASAN COLLEGE OF ENGINEERING AND TECHNOLOGY 2001 6 51.74 40.92 49.32 53.73 56.28 42.30 54.37 65.28 196 2633 VIDYAA VIKAS COLLEGE OF ENGINEERING AND TECHNOLOGY 2007 6 51.58 42.62 66.14 38.39 55.73 60.67 60.79 36.75 197 4996 SRI VIDYA COLLEGE OF ENGINEERING & TECHNOLOGY 2008 6 51.46 44.27 52.61 49.62 57.06 52.22 58.98 45.45 198 1522 S.K.P. INSTITUTE OF TECHNOLOGY 2009 6 51.45 44.40 49.43 55.90 64.30 42.71 55.96 47.48 199 1431 NEW PRINCE SHRI BHAVANI COLLEGE OF ENGINEERING AND TECHNOLOGY 2008 6 51.44 44.04 58.10 60.19 58.77 43.09 51.77 44.10 200 2358 SCAD INSTITUTE OF TECHNOLOGY 2012 6 51.44 48.63 44.49 52.63 39.25 45.45 77.12 52.54 201 2729 NEHRU INSTITUTE OF ENGINEERING AND TECHNOLOGY 2006 6 51.25 44.48 56.86 51.18 50.00 44.69 57.23 54.29 202 1242 SREE SASTHA COLLEGE OF ENGINEERING 2009 6 51.15 35.56 57.06 62.57 64.33 37.45 57.01 44.09 203 5919 St.MICHAEL COLLEGE OF ENGINEERING & TECHNOLOGY 1998 6 51.12 45.56 58.89 52.23 66.59 37.47 52.65 44.48 204 1202 D M I COLLEGE OF ENGINEERING 2001 6 51.01 43.46 50.45 58.75 59.51 38.47 56.85 49.55 205 5532 VAIGAI COLLEGE OF ENGINEERING 2012 6 51.00 51.30 51.94 46.25 57.72 35.58 56.67 57.52 206 1528 KRS COLLEGE OF ENGINEERING 2009 6 50.79 47.00 60.43 37.96 63.52 35.61 71.37 39.64 207 4970 SREE SOWDAMBIKA COLLEGE OF ENGINEERING 2000 6 50.76 50.54 56.41 44.09 51.72 48.16 59.84 44.56 208 2628 PAAVAI COLLEGE OF ENGINEERING 2006 6 50.73 35.72 53.35 38.74 48.29 53.99 65.78 59.21 209 3016 UNIVERSITY COLLEGE OF ENGINEERING, ARIYALUR 2008 6 50.62 46.46 54.52 35.73 65.05 47.35 64.95 40.29 210 3844 SHIVANI ENGINEERING COLLEGE 2009 6 50.60 36.52 63.42 40.55 55.73 59.49 63.78 34.74 211 3021 UNIVERSITY COLLEGE OF ENGINEERING, PATTUKKOTTAI 2009 6 50.59 35.01 67.73 45.39 58.98 45.41 43.33 58.25 212 4676 RENGANAYAGI VARATHARAJ COLLEGE OF ENGINEERING 2011 6 50.54 57.30 55.58 52.71 47.24 51.75 42.65 46.55 213 1127 St. PETER'S COLLEGE OF ENGINEERING AND TECHNOLOGY 2008 6 50.44 42.07 51.86 47.09 60.04 37.89 59.75 54.38 214 2738 SASURIE ACADEMY OF ENGINEERING 2007 6 50.33 43.04 52.08 45.75 55.93 57.87 59.45 38.18 215 2624 GNANAMANI COLLEGE OF TECHNOLOGY 2006 6 50.16 39.92 56.32 35.04 43.60 50.93 63.76 61.58 216 2612 P G P COLLEGE OF ENGINEERING AND TECHNOLOGY 1999 6 50.12 39.49 62.02 32.91 45.15 49.61 63.21 58.46 217 1436 A.R. ENGINEERING COLLEGE 2008 6 50.09 64.52 52.27 41.49 60.91 37.69 63.06 30.68 218 2744 ADITHYA INSTITUTE OF TECHNOLOGY 2008 6 50.07 48.54 54.24 46.91 44.50 53.11 63.02 40.20 219 4966 PET ENGINEERING COLLEGE 1998 5 49.84 49.10 54.41 60.78 60.33 39.57 50.23 34.43 220 2770 KALAIVANI COLLEGE OF TECHNOLOGY 2009 5 49.71 50.10 63.10 51.09 43.94 39.24 51.53 48.96 221 3459 DHANALAKSHMI SRINIVASAN INSTITUTE OF TECHNOLOGY 2012 5 49.60 55.60 46.63 40.87 63.53 34.14 59.36 47.06 222 2636 A V S ENGINEERING COLLEGE 2008 5 49.53 48.50 53.90 37.84 46.02 53.77 59.28 47.40 223 1238 GRT INSTITUTE OF ENGINEERING AND TECHNOLOGY 2008 5 49.35 56.70 56.93 57.81 59.52 32.02 42.07 40.41 224 4933 St.MOTHER THERESA ENGINEERING COLLEGE 2009 5 49.32 61.75 52.01 60.86 49.47 45.49 37.78 37.91 225 2713 M.P. NACHIMUTHU M. JAGANATHAN ENGINEERING COLLEGE 2001 5 49.29 41.72 64.91 35.50 55.44 55.35 57.66 34.44
- 6. 2015/11 2015/05 2014/11 2014/05 2013/11 2013/05 2012/11 SL. NO. TNEA CODE NAME OF THE COLLEGE YEAR ESTD. RATING AVERAGE PASS % PASS PERCENTAGE BY SEMESTER 226 4957 JAYARAJ ANNAPACKIAM CSI COLLEGE OF ENGINEERING 2001 5 49.23 44.92 40.49 54.67 52.93 47.67 54.46 49.48 227 5990 LATHA MATHAVAN ENGINEERING COLLEGE 2007 5 49.10 39.77 56.69 47.41 56.54 36.62 51.70 54.97 228 1116 SRI VENKATESWARA COLLEGE OF ENGINEERING AND TECHNOLOGY 2000 5 49.04 39.96 52.14 52.18 60.71 34.12 52.58 51.60 229 4976 INFANT JESUS COLLEGE OF ENGINEERING 2002 5 49.02 40.90 48.69 49.37 52.26 43.52 53.90 54.52 230 1229 INDIRA INSTITUTE OF ENGINEERING AND TECHNOLOGY 2007 5 48.88 45.12 56.26 49.15 62.90 31.92 52.34 44.48 231 2354 POLLACHI INSTITUTE OF ENGINEERING AND TECHNOLOGY 2012 5 48.84 43.25 55.92 55.76 40.89 35.55 50.89 59.65 232 2652 AL-AMEEN ENGINEERING COLLEGE 2009 5 48.74 48.45 62.80 36.31 51.72 55.59 53.16 33.12 233 5865 NADAR SARASWATHI COLLEGE OF ENGINEERING & TECHNOLOGY 2010 5 48.56 53.50 84.53 63.58 53.32 48.03 19.14 17.82 234 1217 SREE SASTHA INSTITUTE OF ENGINEERING AND TECHNOLOGY 1999 5 48.45 40.01 49.89 54.50 58.93 34.51 56.16 45.15 235 1407 G.K.M. COLLEGE OF ENGINEERING AND TECHNOLOGY 1996 5 48.39 40.23 52.95 56.56 48.21 36.95 58.09 45.77 236 5009 GOVERNMENT COLLEGE OF ENGINEERING, BODIYANAYAKKANUR 2012 5 48.33 51.71 64.77 47.35 36.01 45.94 50.94 41.57 237 1108 MAGNA COLLEGE OF ENGINEERING 1999 5 48.30 42.03 57.89 44.39 61.27 32.86 49.95 49.72 238 2360 SUGUNA COLLEGE OF ENGINEERING 2012 5 48.21 42.35 37.55 41.33 45.16 50.69 71.05 49.35 239 1331 AKSHEYAA COLLEGE OF ENGINEERING 2009 5 48.15 44.74 56.05 48.84 60.17 35.16 61.11 30.98 240 4672 STELLA MARY'S COLLEGE OF ENGINEERING 2012 5 48.12 50.11 52.53 52.83 54.89 30.22 NA NA 241 3806 E.G.S.PILLAY ENGINEERING COLLEGE 1995 5 48.06 45.73 51.92 40.92 56.30 44.34 42.78 54.43 242 5913 R.V.S. COLLEGE OF ENGINEERING 1985 5 48.02 33.74 60.81 38.47 47.58 53.30 57.74 44.53 243 1235 J E I MATHAAJEE COLLEGE OF ENGINEERING 2008 5 47.99 40.13 50.00 57.74 58.18 38.70 44.79 46.38 244 3908 MOUNT ZION COLLEGE OF ENGINEERING AND TECHNOLOGY 2001 5 47.87 47.91 61.09 45.82 60.08 33.11 45.48 41.63 245 5902 BHARATH NIKETAN ENGINEERING COLLEGE 1998 5 47.87 35.94 69.04 44.84 45.91 48.40 53.88 37.08 246 3805 DHANALAKSHMI SRINIVASAN ENGINEERING COLLEGE 2001 5 47.73 43.70 49.87 40.17 59.26 41.59 60.78 38.73 247 2657 PAVAI COLLEGE OF TECHNOLOGY 2009 5 47.62 30.02 56.53 33.02 47.80 47.22 61.97 56.81 248 3410 KRISHNASAMY COLLEGE OF ENGINEERING AND TECHNOLOGY 2001 5 47.61 57.39 54.06 37.80 57.39 31.78 62.19 32.63 249 2745 KATHIR COLLEGE OF ENGINEERING 2008 5 47.59 42.61 51.41 46.32 47.19 52.11 55.58 37.88 250 2748 SURYA ENGINEERING COLLEGE 2008 5 47.51 48.41 63.32 38.79 51.51 52.95 50.65 26.92 251 2355 CHERAN COLLEGE OF ENGINEERING 2012 5 47.49 36.76 64.11 42.62 36.87 37.98 62.35 51.72 252 1101 AALIM MUHAMMED SALEGH COLLEGE OF ENGINEERING 2000 5 47.45 41.16 50.55 52.41 58.42 30.63 50.32 48.66 253 3425 C.K. COLLEGE OF ENGINEERING AND TECHNOLOGY 2002 5 47.32 60.56 57.21 41.57 53.45 31.95 56.32 30.17 254 3807 J.J.COLLEGE OF ENGINEERING AND TECHNOLOGY 1994 5 47.24 31.74 49.36 37.30 50.93 55.33 62.63 43.37 255 1212 RAJIV GANDHI COLLEGE OF ENGINEERING 2001 5 47.18 38.96 52.30 53.02 57.31 34.37 52.32 41.95 256 2714 MAHARAJA ENGINEERING COLLEGE 1994 5 47.13 48.14 67.23 36.02 48.65 52.24 47.66 29.94 257 2635 CMS COLLEGE OF ENGINEERING 2007 5 46.91 30.82 48.78 29.06 43.31 48.42 64.10 63.91 258 2627 SELVAM COLLEGE OF TECHNOLOGY 2006 5 46.88 46.14 51.47 33.36 39.46 42.75 60.24 54.73 259 1228 ALPHA COLLEGE OF ENGINEERING 2006 5 46.76 40.73 49.16 55.71 63.91 31.45 50.32 36.03 260 2772 C M S COLLEGE OF ENGINEERING AND TECHNOLOGY 2009 5 46.73 37.76 53.43 43.37 45.78 41.15 54.27 51.34 261 2761 UNITED INSTITUTE OF TECHNOLOGY 2009 5 46.67 50.14 53.83 51.95 42.12 44.26 53.21 31.18 262 2614 S.S.M. COLLEGE OF ENGINEERING 1998 5 46.63 45.50 65.34 36.22 49.80 48.19 50.39 30.97 263 3847 ROEVER COLLEGE OF ENGINEERING AND TECHNOLOGY 2009 5 46.57 43.32 54.92 36.50 62.02 36.08 62.65 30.50 264 2314 MUTHAYAMMAL COLLEGE OF ENGINEERING 2011 5 46.51 42.02 52.67 30.78 30.99 48.12 64.88 56.08 265 2646 TAGORE INSTITUTE OF ENGINEERING AND TECHNOLOGY 2008 5 46.45 33.22 54.50 28.48 49.84 45.04 61.53 52.54 266 5703 CHRISTIAN COLLEGE OF ENGINEERING AND TECHNOLOGY 2001 5 46.11 30.83 57.17 41.01 48.64 44.70 56.09 44.31 267 1150 SRI JAYARAM INSTITUTE OF ENGINEERING AND TECHNOLOGY 2014 5 46.10 54.20 25.00 59.09 NA NA NA NA 268 3454 SRI RAMAKRISHNA COLLEGE OF ENGINEERING 2012 5 46.05 73.04 58.84 46.69 63.39 23.25 50.00 7.14 269 2673 SREE SAKTHI ENGINEERING COLLEGE 2010 5 46.04 40.69 58.03 49.96 45.45 43.72 52.16 32.30 270 3811 M.I.E.T ENGINEERING COLLEGE 1998 5 45.94 35.08 57.06 35.56 48.54 51.21 56.26 37.87
- 7. 2015/11 2015/05 2014/11 2014/05 2013/11 2013/05 2012/11 SL. NO. TNEA CODE NAME OF THE COLLEGE YEAR ESTD. RATING AVERAGE PASS % PASS PERCENTAGE BY SEMESTER 271 4961 NATIONAL COLLEGE OF ENGINEERING 2000 5 45.86 44.93 44.89 49.75 49.32 43.55 45.02 43.58 272 1123 GOJAN SCHOOL OF BUSINESS AND TECHNOLOGY 2005 5 45.82 38.90 46.59 35.04 63.44 32.26 51.46 53.02 273 4978 UDAYA SCHOOL OF ENGINEERING 2002 5 45.70 29.89 46.58 34.73 55.45 48.27 56.92 48.03 274 5935 FATIMA MICHAEL COLLEGE OF ENGINEERING AND TECHNOLOGY 2009 5 45.59 39.96 56.15 43.03 59.18 31.87 50.20 38.75 275 3808 JAYARAM COLLEGE OF ENGINEERING AND TECHNOLOGY 1994 5 45.55 30.02 58.44 32.40 46.42 52.59 60.60 38.35 276 2650 CHRIST THE KING ENGINEERING COLLEGE 2010 5 45.32 56.30 61.40 57.74 47.20 42.93 34.99 16.67 277 1417 SHRI ANDAL ALAGAR COLLEGE OF ENGINEERING 2001 5 45.20 36.24 53.11 54.20 49.01 32.31 53.75 37.81 278 3825 St. JOSEPH'S COLLEGE OF ENGINEERING AND TECHNOLOGY 2007 5 45.19 30.11 55.59 40.05 58.87 42.13 36.87 52.70 279 1121 SRI VENKATESWARA INSTITUTE OF SCIENCE AND TECHNOLOGY 2002 5 45.15 36.53 57.26 51.10 59.16 26.17 44.69 41.15 280 5930 SBM COLLEGE OF ENGINEERING AND TECHNOLOGY 2009 5 45.03 39.79 65.57 44.08 41.46 43.46 46.96 33.89 281 4984 MARTHANDAM COLLEGE OF ENGINEERING AND TECHNOLOGY 2006 5 45.02 33.76 55.34 37.04 58.16 46.92 51.12 32.80 282 1301 MOHAMED SATHAK A.J.COLLEGE OF ENGINEERING 2001 5 45.01 34.67 42.50 47.77 50.21 35.36 47.69 56.87 283 2625 THE KAVERY ENGINEERING COLLEGE 2006 5 45.00 40.40 51.98 27.93 58.29 35.61 56.11 44.66 284 2632 MAHENDRA INSTITUTE OF TECHNOLOGY 2007 5 44.90 29.71 41.00 31.71 62.06 37.25 63.86 48.71 285 2683 SHREENIVASA ENGINEERING COLLEGE 2010 5 44.69 37.15 56.49 27.14 46.33 46.60 49.55 49.57 286 1517 THIRUMALAI ENGINEERING COLLEGE 1999 5 44.68 28.10 49.43 49.11 64.99 36.65 44.04 40.44 287 2717 SASURIE COLLEGE OF ENGINEERING 2001 5 44.66 41.27 60.99 33.59 46.60 47.68 52.82 29.68 288 4994 J P COLLEGE OF ENGINEERING 2008 5 44.51 45.96 50.96 35.54 50.53 44.31 42.09 42.15 289 2604 A.S.L. PAULS COLLEGE OF ENGINEERING AND TECHNOLOGY 2010 5 44.48 33.11 59.84 45.96 61.52 45.07 34.42 31.44 290 3829 M.A.M COLLEGE OF ENGINEERING AND TECHNOLOGY 2008 5 44.47 43.31 53.12 40.62 57.89 36.08 47.31 32.98 291 5912 PANDIAN SARASWATHI YADAV ENGINEERING COLLEGE 2000 5 44.46 41.63 57.99 45.88 49.38 29.02 46.60 40.73 292 2602 ANNAI MATHAMMAL SHEELA ENGINEERING COLLEGE 1996 5 44.31 27.29 55.94 31.15 42.51 42.81 60.26 50.21 293 3812 MOOKAMBIGAI COLLEGE OF ENGINEERING 1985 5 44.18 30.10 54.55 34.71 46.40 48.41 56.10 38.98 294 1523 GLOBAL INSTITUTE OF ENGINEERING AND TECHNOLOGY 2009 5 44.17 43.67 44.64 58.45 54.14 36.43 37.59 34.28 295 1325 St. JOSEPH COLLEGE OF ENGINEERING 2008 5 44.11 36.48 42.98 53.40 54.76 30.52 50.72 39.92 296 5915 SACS M.A.V.M.M ENGINEERING COLLEGE 1998 5 44.07 33.15 54.75 40.85 52.56 33.63 49.77 43.80 297 1222 P.B. COLLEGE OF ENGINEERING 2002 5 43.84 37.73 48.18 54.55 53.75 29.66 48.22 34.76 298 1137 ANNAI MIRA COLLEGE OF ENGINEERING AND TECHNOLOGY 2012 5 43.83 55.22 49.86 53.58 53.00 23.77 35.56 35.79 299 2660 GNANAMANI COLLEGE OF ENGINEERING 2009 5 43.80 30.63 59.46 22.59 39.48 40.24 57.09 57.09 300 3918 SHANMUGANATHAN ENGINEERING COLLEGE 2001 5 43.71 40.25 53.38 45.31 50.65 28.07 47.63 40.66 301 1208 KANCHI PALLAVAN ENGINEERING COLLEGE 2001 5 43.69 30.83 54.94 51.95 59.64 33.97 38.16 36.31 302 1102 BHAJARANG ENGINEERING COLLEGE 2001 5 43.66 35.09 54.66 46.97 56.53 28.75 46.95 36.65 303 2737 RANGANATHAN ENGINEERING COLLEGE 2007 5 43.61 38.39 57.45 38.13 41.64 42.39 57.83 29.43 304 5909 ODAIYAPPA COLLEGE OF ENGINEERING AND TECHNOLOGY 1999 5 43.58 2.86 78.79 31.00 61.65 NA NA NA 305 2606 JAYAM COLLEGE OF ENGINEERING AND TECHNOLOGY 1997 5 43.57 39.42 51.18 34.00 54.31 27.20 52.33 46.54 306 4931 CHANDY COLLEGE OF ENGINEERING 2009 5 43.54 44.68 41.91 55.88 53.43 36.98 37.60 34.30 307 2705 CSI COLLEGE OF ENGINEERING 1998 5 43.51 38.58 54.12 45.36 38.89 42.02 55.07 30.54 308 3802 SHRI ANGALAMMAN COLLEGE OF ENGINEERING AND TECHNOLOGY 1991 5 43.49 39.02 51.28 38.20 60.42 34.45 52.50 28.53 309 2755 NEHRU INSTITUTE OF TECHNOLOGY 2008 5 43.47 40.08 51.45 41.77 43.01 33.91 46.57 47.52 310 1409 KARPAGA VINAYAGA COLLEGE OF ENGINEERING AND TECHNOLOGY 2001 5 43.13 45.71 47.09 39.42 50.14 31.02 56.56 31.95 311 1313 SMK FOMRA INSTITUTE OF TECHNOLOGY 2001 5 42.87 38.92 46.21 48.39 44.53 31.15 43.58 47.28 312 2664 EXCEL COLLEGE OF ENGINEERING AND TECHNOLOGY 2009 5 42.79 43.07 56.51 34.50 46.28 49.65 43.96 25.53 313 2769 J C T COLLEGE OF ENGINEERING AND TECHNOLOGY 2009 5 42.76 43.45 55.67 48.20 42.57 33.00 40.95 35.47 314 4967 S.VEERASAMY CHETTIAR COLLEGE OF ENGINEERING AND TECHNOLOGY 2001 5 42.72 40.06 51.74 40.96 46.07 43.23 37.06 39.90 315 2753 PPG INSTITUTE OF TECHNOLOGY 2008 5 42.66 42.60 48.25 36.66 45.08 42.87 51.96 31.21
- 8. 2015/11 2015/05 2014/11 2014/05 2013/11 2013/05 2012/11 SL. NO. TNEA CODE NAME OF THE COLLEGE YEAR ESTD. RATING AVERAGE PASS % PASS PERCENTAGE BY SEMESTER 316 1107 JAYA INSTITUTE OF TECHNOLOGY 2001 5 42.56 29.17 53.17 55.34 61.63 28.82 34.02 35.78 317 3820 TRICHY ENGINEERING COLLEGE 1998 5 42.43 40.24 54.33 38.04 58.13 31.27 47.54 27.46 318 2623 MAHENDRA COLLEGE OF ENGINEERING 2005 5 42.32 25.86 45.56 29.84 42.25 44.99 57.45 50.26 319 5533 KIT & KIM TECHNICAL CAMPUS 2011 5 42.30 46.37 65.77 58.49 54.30 28.26 22.22 20.69 320 2724 MAHARAJA PRITHVI ENGINEERING COLLEGE 2002 5 42.24 45.62 66.62 29.17 43.23 41.84 46.89 22.31 321 1319 THANGAVELU ENGINEERING COLLEGE 1995 5 42.09 33.67 43.11 42.65 44.16 28.39 46.15 56.50 322 5862 R.V.S. SCHOOL OF ENGINEERING AND TECHNOLOGY 2009 5 41.97 35.91 59.65 39.29 37.68 40.12 43.44 37.68 323 1234 INDIRA GANDHI COLLEGE OF ENGINEERING AND TECHNOLOGY FOR WOMEN 2008 5 41.71 18.04 32.61 57.58 55.92 36.84 51.02 39.93 324 2659 SALEM COLLEGE OF ENGINEERING AND TECHNOLOGY 2009 5 41.70 35.69 53.94 26.83 38.70 40.48 52.47 43.78 325 1510 PRIYADARSHINI ENGINEERING COLLEGE 1995 5 41.37 30.57 46.48 48.60 52.31 31.49 44.43 35.70 326 1214 SAKTHI MARIAMMAN ENGINEERING COLLEGE 2001 5 41.13 29.45 43.14 49.14 49.68 30.65 51.46 34.40 327 3457 DHANALAKSHMI SRINIVASAN COLLEGE OF ENGINEERING 2012 5 41.12 51.84 40.32 39.73 51.55 27.76 51.11 25.54 328 1511 RANIPPETTAI ENGINEERING COLLEGE 1999 5 41.04 30.53 44.49 44.08 54.23 34.10 40.13 39.71 329 5911 P.T.R.COLLEGE OF ENGINEERING AND TECHNOLOGY 2001 5 40.85 33.24 56.91 42.77 51.13 27.29 39.07 35.53 330 4938 SIVAJI COLLEGE OF ENGINEERING AND TECHNOLOGY 2009 5 40.82 36.52 51.04 38.63 52.05 35.68 44.61 27.19 331 4928 MAR EPHRAEM COLLEGE OF ENGINEERING AND TECHNOLOGY 2009 5 40.78 43.79 58.98 43.25 45.23 31.45 38.59 24.19 332 4972 SUN COLLEGE OF ENGINEERING AND TECHNOLOGY 1999 5 40.01 16.12 43.36 27.80 53.65 44.61 57.18 37.35 333 2356 ARULMURUGAN COLLEGE OF ENGINEERING 2012 4 39.89 38.52 56.56 36.96 29.32 27.27 45.31 45.31 334 1225 LOYOLA INSTITUTE OF TECHNOLOGY 2003 4 39.88 30.79 37.45 47.36 46.93 26.82 50.26 39.55 335 1430 MAHA BARATHI ENGINEERING COLLEGE 2008 4 39.87 36.02 39.57 23.01 37.71 40.56 56.58 45.67 336 3823 SRINIVASAN ENGINEERING COLLEGE 2006 4 39.80 44.12 53.01 31.64 51.02 27.58 45.56 25.70 337 3817 ROEVER ENGINEERING COLLEGE 2001 4 39.78 38.61 48.26 28.88 51.19 27.83 53.94 29.74 338 2749 EASA COLLEGE OF ENGINEERING AND TECHNOLOGY 2008 4 39.70 35.84 52.22 35.74 41.41 31.12 39.68 41.88 339 3809 KURINJI COLLEGE OF ENGINEERING AND TECHNOLOGY 2001 4 39.67 26.15 57.10 26.88 41.77 45.65 51.54 28.62 340 4956 JAYAMATHA ENGINEERING COLLEGE 1995 4 39.58 35.45 49.16 45.90 53.30 28.27 42.59 22.41 341 1125 PMR ENGINEERING COLLEGE 2008 4 39.52 41.40 43.43 39.49 52.68 17.83 42.31 39.47 342 3813 OXFORD ENGINEERING COLLEGE 1998 4 39.47 19.53 44.26 23.90 46.03 48.83 56.88 36.83 343 2631 KING COLLEGE OF TECHNOLOGY 2007 4 39.21 28.07 40.94 23.16 36.69 34.02 57.95 53.65 344 3786 M.A.M. SCHOOL OF ENGINEERING 2010 4 39.16 47.63 55.88 34.05 51.31 29.08 37.84 18.31 345 1426 SRI RAMANUJAR ENGINEERING COLLEGE 2002 4 39.14 30.46 42.07 52.28 40.97 31.84 44.04 32.35 346 5842 MADURAI INSTITUTE OF ENGINEERING AND TECHNOLOGY 2009 4 39.14 28.02 52.58 32.86 46.19 25.05 44.70 44.61 347 5536 MANGAYARKARASI COLLEGE OF ENGINEERING 2013 4 38.76 25.89 36.48 39.81 42.86 48.74 NA NA 348 4670 ROHINI COLLEGE OF ENGINEERING AND TECHNOLOGY 2012 4 38.58 37.69 33.03 49.82 43.25 27.84 35.23 43.18 349 2730 MAHARAJA INSTITUTE OF TECHNOLOGY 2006 4 38.50 36.30 48.11 34.87 37.78 41.99 48.88 21.54 350 3920 SUDHARSAN ENGINEERING COLLEGE 2000 4 38.47 22.88 48.44 29.08 40.85 45.29 51.97 30.75 351 3760 SIR ISSAC NEWTON COLLEGE OF ENGINEERING AND TECHNOLOGY 2010 4 38.45 49.02 60.16 41.50 44.68 25.50 18.79 29.51 352 2337 VIDHYA MANDHIR INSTITUTE OF TECHNOLOGY 2011 4 38.16 35.06 60.89 30.19 33.03 43.38 42.52 22.08 353 3926 CHENDHURAN COLLEGE OF ENGINEERING AND TECHNOLOGY 2008 4 38.08 43.13 51.46 37.45 42.08 24.67 35.17 32.59 354 1333 VI INSTITUTE OF TECHNOLOGY 2009 4 38.03 23.99 30.54 49.68 41.40 36.98 46.35 37.24 355 3853 SHIVANI COLLEGE OF ENGINEERING AND TECHNOLOGY 2009 4 37.92 26.67 50.86 29.83 41.52 45.17 48.32 23.10 356 1232 ARM COLLEGE OF ENGINEERING AND TECHNOLOGY 2008 4 37.88 31.08 47.62 53.48 47.21 31.20 34.66 19.94 357 1452 PERI INSTITUTE OF TECHNOLOGY 2010 4 37.76 30.47 38.88 44.53 40.93 32.67 38.17 38.70 358 2743 DHANALAKSHMI SRINIVASAN COLLEGE OF ENGINEERING 2008 4 37.63 28.11 45.38 34.69 35.65 31.72 43.25 44.60 359 2666 THE KAVERY COLLEGE OF ENGINEERING 2009 4 37.40 29.45 39.40 26.42 49.90 27.95 47.61 41.09 360 2655 V K S COLLEGE OF ENGINEERING AND TECHNOLOGY 2009 4 37.34 24.82 57.63 31.02 32.90 37.93 41.67 35.42
- 9. 2015/11 2015/05 2014/11 2014/05 2013/11 2013/05 2012/11 SL. NO. TNEA CODE NAME OF THE COLLEGE YEAR ESTD. RATING AVERAGE PASS % PASS PERCENTAGE BY SEMESTER 361 1513 SRI BALAJI CHOCKALINGAM ENGINEERING COLLEGE 1999 4 37.24 25.61 43.18 47.37 52.38 26.65 35.57 29.90 362 2641 VARUVAN VADIVELAN INSTITUTE OF TECHNOLOGY 2008 4 36.96 36.11 42.26 33.69 47.69 25.40 44.94 28.62 363 1428 E.S ENGINEERING COLLEGE 2007 4 36.85 50.07 45.44 25.60 43.12 22.80 51.18 19.75 364 1434 SURYA GROUP OF INSTITUTIONS 2008 4 36.74 43.76 36.77 25.70 39.55 23.40 56.94 31.04 365 5720 SRI SUBRAMANYA COLLEGE OF ENGINEERING AND TECHNOLOGY 2000 4 36.57 26.33 56.52 29.90 35.28 39.43 38.23 30.32 366 3821 A.R.J COLLEGE OF ENGINEERING AND TECHNOLOGY 2002 4 36.56 24.40 50.76 32.98 45.13 32.63 27.48 42.56 367 4943 SATYAM COLLEGE OF ENGINEERING AND TECHNOLOGY 2009 4 36.50 25.04 48.31 47.70 41.01 27.59 41.30 24.55 368 1441 A.K.T. MEMORIAL COLLEGE OF ENGINEERING AND TECHNOLOGY 2009 4 36.48 44.93 39.58 25.86 48.11 25.99 51.14 19.73 369 4992 BETHLAHEM INSTITUTE OF ENGINEERING 2008 4 36.44 35.03 46.74 32.59 42.88 30.94 42.27 24.66 370 3841 C.A.R.E. GROUP OF INSTITUTIONS 2009 4 36.40 30.08 48.57 31.16 39.95 36.84 45.06 23.14 371 1515 SARASWATHI VELU COLLEGE OF ENGINEERING 2001 4 36.15 13.77 32.23 28.07 57.50 33.57 46.66 41.23 372 3815 PAVENDAR BHARATHIDASAN COLLEGE OF ENGINEERING AND TECHNOLOGY 1998 4 35.40 20.89 46.53 22.74 39.68 39.84 50.11 28.03 373 1243 MADHA INSTITUTE OF ENGINEERING AND TECHNOLOGY 2009 4 35.34 25.83 43.65 34.33 52.23 20.74 39.54 31.06 374 5914 RAJA COLLEGE OF ENGINEERING AND TECHNOLOGY 1995 4 35.12 28.31 45.79 30.82 41.55 19.64 41.96 37.77 375 3846 MOTHER TERASA COLLEGE OF ENGINEERING AND TECHNOLOGY 2009 4 34.97 41.75 45.86 30.01 41.75 16.85 35.64 32.95 376 1525 PODHIGAI COLLEGE OF ENGINEERING AND TECHNOLOGY 2009 4 34.94 22.76 36.55 42.19 54.37 29.91 32.05 26.75 377 2342 SRI RANGANATHAR INSTITUTE OF ENGINEERING & TECHNOLOGY 2011 4 34.82 43.81 52.99 41.97 22.50 29.72 36.47 16.28 378 4949 PSN INSTITUTE OF TECHNOLOGY AND SCIENCE 2009 4 34.54 45.89 45.15 36.66 41.12 30.27 23.96 18.71 379 4977 NARAYANAGURU COLLEGE OF ENGINEERING 2002 4 34.46 33.08 38.52 29.44 40.79 31.92 41.62 25.82 380 3923 MNSK COLLEGE OF ENGINEERING 2002 4 34.40 22.48 46.33 29.04 45.01 22.81 35.39 39.71 381 5502 SRI RAAJA RAAJAN COLLEGE OF ENGINEERING AND TECHNOLOGY 2010 4 34.29 37.86 54.01 40.69 42.69 21.12 23.42 20.26 382 2682 PROFESSIONAL GROUP OF INSTITUTIONS 2010 4 34.12 35.11 40.33 31.50 36.41 35.82 41.76 17.90 383 4983 LORD JEGANNATH COLLEGE OF ENGINEERING AND TECHNOLOGY 2006 4 34.09 25.60 37.88 26.21 45.28 34.58 40.25 28.84 384 3403 MAHALAKSHMI ENGINEERING COLLEGE 2011 4 34.05 29.25 63.75 32.71 22.17 31.20 41.32 17.92 385 2758 J K K MUNIRAJAH COLLEGE OF TECHNOLOGY 2008 4 33.82 33.77 52.42 23.25 36.18 35.83 35.83 19.49 386 4975 DR.G.U.POPE COLLEGE OF ENGINEERING 2002 4 33.76 27.75 25.32 35.29 38.13 32.62 38.17 39.04 387 2776 RVS TECHNICAL CAMPUS - COIMBATORE 2009 4 33.75 31.79 42.81 30.84 33.11 33.76 41.67 22.29 388 2665 MAHENDRA INSTITUTE OF ENGINEERING AND TECHNOLOGY 2009 4 33.65 23.16 35.37 26.15 43.49 23.52 47.53 36.30 389 1335 SRI KRISHNA INSTITUTE OF TECHNOLOGY 2009 4 33.59 13.70 30.39 40.65 44.31 29.42 44.77 31.88 390 2362 HOSUR INSTITUTE OF TECHNOLOGY AND SCIENCE 2012 4 33.49 21.37 25.68 19.07 44.68 14.56 81.82 27.27 391 1521 SHRI SAPTHAGIRI INSTITUTE OF TECHNOLOGY 2009 4 33.39 23.44 46.36 44.13 44.67 24.28 27.49 23.37 392 2634 EXCEL ENGINEERING COLLEGE 2007 4 33.14 36.50 48.13 19.50 33.61 35.33 38.69 20.22 393 1318 T.J. INSTITUTE OF TECHNOLOGY 2001 4 33.05 22.43 38.88 35.36 37.82 18.85 35.31 42.70 394 4675 UNIVERSAL COLLEGE OF ENGINEERING & TECHNOLOGY 2011 4 33.05 41.95 37.40 50.97 30.92 20.17 29.85 20.10 395 3855 AS-SALAM COLLEGE OF ENGINEERING AND TECHNOLOGY 2009 4 32.97 20.10 45.45 28.78 44.35 29.01 24.53 38.56 396 1503 ARULMIGU MEENAKSHI AMMAN COLLEGE OF ENGINEERING 1985 4 32.96 26.56 36.58 35.92 43.73 27.14 33.06 27.74 397 3460 SUREYA COLLEGE OF ENGINEERING 2012 4 32.88 35.38 42.86 30.00 45.88 28.24 29.03 18.75 398 2663 S R S COLLEGE OF ENGINEERING AND TECHNOLOGY 2009 4 32.71 16.48 37.66 12.96 40.73 31.70 47.27 42.15 399 3860 St. ANNE'S COLLEGE OF ENGINEERING AND TECHNOLOGY 2009 4 32.56 40.06 33.07 22.39 42.07 20.11 46.33 23.86 400 4669 THAMIRABHARANI ENGINEERING COLLEGE 2011 4 32.38 34.15 36.54 33.02 31.94 33.55 28.47 29.00 401 1429 GOPAL RAMALINGAM MEMORIAL ENGINEERING COLLEGE 2008 4 32.16 12.32 23.38 35.32 50.98 33.33 42.13 27.67 402 4973 RAJAS ENGINEERING COLLEGE 1984 4 31.92 32.22 34.88 37.66 41.58 23.01 34.11 20.01 403 3845 IMAYAM COLLEGE OF ENGINEERING 2009 4 31.90 13.56 38.53 17.58 39.31 38.33 49.92 26.04 404 4985 K N S K COLLEGE OF ENGINEERING 2007 4 31.75 19.93 50.21 27.08 42.78 29.30 33.76 19.18 405 3925 M.A.R. COLLEGE OF ENGINEERING AND TECHNOLOGY 2008 4 31.71 21.65 44.02 26.24 37.58 37.15 37.63 17.71
- 10. 2015/11 2015/05 2014/11 2014/05 2013/11 2013/05 2012/11 SL. NO. TNEA CODE NAME OF THE COLLEGE YEAR ESTD. RATING AVERAGE PASS % PASS PERCENTAGE BY SEMESTER 406 1423 ASAN MEMORIAL COLLEGE OF ENGINEERING AND TECHNOLOGY 2002 4 31.37 20.25 38.00 41.77 36.06 23.30 36.37 23.83 407 4952 C.S.I. INSTITUTE OF TECHNOLOGY 1995 4 31.35 25.35 39.26 26.85 37.56 28.16 38.31 23.95 408 3456 K.S.K COLLEGE OF ENGINEERING AND TECHNOLOGY 2011 4 31.31 31.19 46.03 30.70 40.12 26.57 17.06 27.49 409 1438 SREE KRISHNA COLLEGE OF ENGINEERING 2010 4 31.04 20.86 34.52 40.37 44.08 28.41 27.41 21.60 410 1447 JAWAHAR ENGINEERING COLLEGE 2010 4 30.83 23.15 41.83 43.21 28.43 21.80 19.80 37.59 411 2658 V S A EDUCATIONAL AND CHARITABLE TRUST'S GROUP OF INSTITUTIONS 2009 4 30.78 23.35 34.09 16.77 29.49 29.36 47.28 35.13 412 1418 SRI LAKSHMI AMMAL ENGINEERING COLLEGE 2001 4 30.71 19.48 39.57 43.63 36.59 23.90 32.38 19.41 413 4989 PSN ENGINEERING COLLEGE 2007 4 30.70 32.76 36.59 25.89 36.18 30.80 28.51 24.20 414 1124 SAMS COLLEGE OF ENGINEERING AND TECHNOLOGY 2006 4 30.63 25.35 38.73 24.50 41.39 17.17 35.54 31.73 415 3859 SEMBODAI RUKMANI VARATHARAJAN ENGINEERING COLLEGE 2009 4 30.35 19.27 41.51 22.62 44.06 27.27 24.65 33.07 416 1435 BALAJI INSTITUTE OF ENGINEERING AND TECHNOLOGY 2008 4 30.24 16.22 35.86 28.75 35.94 18.14 36.36 40.41 417 4999 ANNAI VAILANKANNI COLLEGE OF ENGINEERING 2008 4 30.19 22.20 44.56 28.78 36.19 23.52 34.33 21.78 418 1406 DR. PAULS ENGINEERING COLLEGE 1998 4 30.15 20.87 30.95 23.39 39.42 19.67 48.24 28.50 419 2649 KARUR COLLEGE OF ENGINEERING 2010 4 30.11 24.67 51.73 26.88 19.56 28.37 35.87 23.68 420 1519 BHARATHIDASAN ENGINEERING COLLEGE 2002 4 30.02 28.57 34.41 39.34 42.51 18.58 27.53 19.19 421 1524 ANNAMALAIAR COLLEGE OF ENGINEERING 2009 3 29.71 15.18 38.73 37.67 41.97 25.00 26.92 22.48 422 1233 ADHI COLLEGE OF ENGINEERING AND TECHNOLOGY 2008 3 29.45 31.04 31.42 46.98 36.02 17.63 26.08 16.97 423 3462 ARIYALUR ENGINEERING COLLEGE 2013 3 29.04 26.80 31.34 27.88 49.51 9.65 NA NA 424 1245 JOHN BOSCO ENGINEERING COLLEGE 2009 3 28.94 22.69 46.30 33.07 41.54 11.29 24.96 22.73 425 3458 DHANALAKSHMI SRINIVASAN INSTITUTE OF RESEARCH AND TECHNOLOGY 2012 3 28.91 34.44 31.17 28.11 42.92 24.72 27.91 13.08 426 2347 AVS COLLEGE OF TECHNOLOGY 2013 3 28.61 33.85 35.32 26.67 20.00 27.20 NA NA 427 1201 ARIGNAR ANNA INSTITUTE OF SCIENCE AND TECHNOLOGY 2000 3 28.46 16.79 37.37 29.78 42.86 14.99 32.93 24.50 428 3822 DR.NAVALAR NEDUNCHEZHIYAN COLLEGE OF ENGINEERING 1995 3 28.35 28.25 33.33 20.19 40.29 23.67 35.85 16.89 429 2329 RATHINAM TECHNICAL CAMPUS 2011 3 28.32 34.69 44.77 34.98 14.15 17.69 30.18 21.80 430 4927 MARIA COLLEGE OF ENGINEERING AND TECHNOLOGY 2008 3 28.15 19.69 34.38 23.71 33.77 28.55 33.62 23.36 431 2771 DR.NALLINI INSTITUTE OF ENGINEERING AND TECHNOLOGY 2009 3 28.06 13.81 39.84 21.11 39.57 37.24 30.97 13.89 432 4987 JAMES COLLEGE OF ENGINEERING AND TECHNOLOGY 2007 3 27.87 22.72 35.51 25.63 31.34 18.56 38.16 23.20 433 1413 SRI VENKATESWARAA COLLEGE OF TECHNOLOGY 2010 3 27.61 27.46 39.27 44.37 28.25 13.72 21.97 18.20 434 1526 SRI KRISHNA COLLEGE OF ENGINEERING 2009 3 26.69 20.43 33.39 29.45 37.64 12.94 25.92 27.07 435 1514 SRI NANDHANAM COLLEGE OF ENGINEERING AND TECHNOLOGY 2001 3 26.64 11.06 34.85 30.57 41.25 19.38 26.28 23.11 436 3782 OAS INSTITUTE OF TECHNOLOGY AND MANAGEMENT, GROUP OF INSTITUTIONS 2010 3 26.43 14.09 42.25 20.80 23.44 29.44 38.70 16.32 437 3856 PAVENDAR BHARATHIDASAN INSTITUTE OF INFORMATION TECHNOLOGY 2009 3 26.13 10.07 43.46 13.97 30.67 30.33 40.00 14.42 438 1444 CHENDU COLLEGE OF ENGINEERING AND TECHNOLOGY 2010 3 25.74 24.95 30.09 20.66 36.05 16.88 37.46 14.06 439 2648 ANNAPOORANA ENGINEERING COLLEGE 2010 3 25.39 28.79 36.42 16.60 39.20 19.88 23.14 13.68 440 1433 SRI ARAVINDAR ENGINEERING COLLEGE 2008 3 25.36 18.35 26.76 19.92 34.56 19.54 43.15 15.26 441 1323 A.C.T. COLLEGE OF ENGINEERING AND TECHNOLOGY 2008 3 25.28 23.47 26.73 11.96 34.29 18.01 42.49 20.00 442 3828 CAUVERY COLLEGE OF ENGINEERING AND TECHNOLOGY 2008 3 25.26 9.66 41.69 7.07 35.57 27.45 35.84 19.52 443 3848 VANDAYAR ENGINEERING COLLEGE 2009 3 25.21 21.99 43.80 21.39 29.91 18.91 18.05 22.44 444 4929 M.E.T ENGINEERING COLLEGE 2009 3 25.17 21.18 30.90 31.86 37.44 20.02 23.17 11.61 445 2754 SRI RAMANATHAN ENGINEERING COLLEGE 2008 3 25.09 22.78 49.15 17.28 34.09 26.07 16.41 9.83 446 1455 APOLLO PRIYADARSHANAM INSTITUTE OF TECHNOLOGY 2010 3 24.91 19.17 33.63 40.86 32.11 15.99 14.03 18.57 447 1518 THIRUVALLUVAR COLLEGE OF ENGINEERING AND TECHNOLOGY 1998 3 24.79 18.78 26.46 17.15 36.30 17.23 41.54 16.08 448 2346 SHREE SATHYAM COLLEGE OF ENGINEERING AND TECHNOLOGY 2011 3 24.69 34.57 31.19 21.76 31.33 12.14 29.06 12.78 449 3461 HAJI SHEIK ISMAIL ENGINEERING COLLEGE 2013 3 24.59 20.20 29.66 29.35 27.27 16.46 NA NA 450 3849 ANNAI COLLEGE OF ENGINEERING AND TECHNOLOGY 2009 3 24.58 10.01 30.82 16.46 37.16 22.49 22.86 32.26
- 11. 2015/11 2015/05 2014/11 2014/05 2013/11 2013/05 2012/11 SL. NO. TNEA CODE NAME OF THE COLLEGE YEAR ESTD. RATING AVERAGE PASS % PASS PERCENTAGE BY SEMESTER 451 5540 ARINGER ANNA COLLEGE OF ENGINEERING AND TECHNOLOGY 2014 3 24.49 5.15 27.78 40.54 NA NA NA NA 452 5531 C.R. ENGINEERING COLLEGE 2011 3 24.37 22.86 39.77 23.22 21.99 10.71 24.57 27.45 453 4932 IMMANUEL ARASAR J J COLLEGE OF ENGINEERING 2009 3 24.23 25.58 35.54 21.20 34.13 19.77 22.53 10.83 454 3766 STAR LION COLLEGE OF ENGINEERING AND TECHNOLOGY 2010 3 24.05 13.94 33.54 19.51 36.00 21.59 10.26 33.51 455 2647 J.K.K. NATTRAJA COLLEGE OF ENGINEERING AND TECHNOLOGY 2008 3 23.98 23.54 37.07 11.28 24.81 22.59 31.89 16.71 456 1226 P.T. LEE CHENGALVARAYA NAICKER COLLEGE OF ENGINEERING AND TECHNOLOGY 2001 3 23.89 16.09 31.30 31.07 36.20 16.48 18.94 17.17 457 1439 S.R.I COLLEGE OF ENGINEERING AND TECHNOLOGY 2010 3 23.71 32.65 36.13 22.84 34.73 10.90 22.43 6.29 458 4677 LOURDES MOUNT COLLEGE OF ENGINEERING AND TECHNOLOGY 2013 3 22.79 20.98 24.24 23.64 30.50 14.58 NA NA 459 4998 MAHAKAVI BHARATHIYAR COLLEGE OF ENGINEERING AND TECHNOLOGY 2008 3 22.74 20.79 29.21 15.32 30.02 20.95 23.57 19.31 460 2767 SRG ENGINEERING COLLEGE 2009 3 22.18 7.18 32.68 8.46 21.52 23.47 30.76 31.16 461 1415 T.S.M. JAIN COLLEGE OF TECHNOLOGY 2010 3 21.90 15.70 30.23 11.75 30.80 18.65 27.99 18.15 462 1104 PALLAVA RAJA COLLEGE OF ENGINEERING 2011 3 21.59 19.28 32.26 29.10 28.07 10.82 14.71 16.87 463 5535 VPV COLLEGE OF ENGINEERING 2011 3 21.25 17.45 41.15 17.94 11.54 13.00 30.43 17.24 464 2662 DR.NAGARATHINAM'S COLLEGE OF ENGINEERING 2009 3 20.73 8.64 13.83 10.07 33.05 17.07 42.17 20.26 465 4937 A.R. COLLEGE OF ENGINEERING AND TECHNOLOGY 2009 3 20.63 14.47 17.58 15.37 25.00 18.95 27.48 25.54 466 1437 RRASE COLLEGE OF ENGINEERING 2008 3 20.56 11.96 24.59 30.41 29.54 15.30 19.61 12.50 467 4950 TAMIZHAN COLLEGE OF ENGINEERING AND TECHNOLOGY 2008 3 20.42 13.89 23.50 26.50 26.16 15.58 23.91 13.40 468 3854 MAHATH AMMA INSTITUTE OF ENGINEERING AND TECHNOLOGY 2009 3 20.38 18.25 29.28 13.23 28.55 8.90 26.00 18.48 469 1449 SARASWATHY COLLEGE OF ENGINEERING & TECHNOLOGY 2010 3 20.16 13.28 39.71 17.73 27.21 10.19 25.12 7.86 470 1440 JAYA SURIYA ENGINEERING COLLEGE 2010 2 19.67 16.14 20.77 18.41 37.64 10.36 14.86 19.52 471 5924 GANAPATHY CHETTIAR COLLEGE OF ENGINEERING AND TECHNOLOGY 2008 2 19.42 15.96 28.74 14.04 27.30 7.75 23.99 18.15 472 3857 MEENAKSHI RAMASWAMY ENGINEERING COLLEGE 2009 2 19.08 20.00 21.78 13.11 29.59 12.56 28.35 8.19 473 4958 JOE SURESH ENGINEERING COLLEGE 2001 2 18.39 4.65 18.55 17.74 34.60 17.81 18.35 17.04 474 2616 SAPTHAGIRI COLLEGE OF ENGINEERING 1993 2 18.35 6.87 19.35 6.20 33.14 13.64 30.01 19.25 475 1445 SRI RANGAPOOPATHI COLLEGE OF ENGINEERING 2009 2 17.60 13.35 21.63 8.81 26.43 10.88 32.41 9.66 476 1141 R.V.S. PADHMAVATHY COLLEGE OF ENGINEERING & TECHNOLOGY 2011 2 17.52 14.39 20.30 16.92 25.24 8.48 18.53 18.75 477 1402 ANNAI TERESA COLLEGE OF ENGINEERING 1998 2 17.37 19.05 16.80 9.26 21.47 7.87 34.37 12.78 478 3466 NELLIANDAVAR INSTITUTE OF TECHNOLOGY 2013 2 16.45 14.63 18.98 12.66 27.85 8.14 NA NA 479 1205 LORD VENKATESHWARAA ENGINEERING COLLEGE 2001 2 15.98 6.15 13.34 16.87 21.05 13.86 23.92 16.68 480 1133 ANNAI VEILANKANNI'S COLLEGE OF ENGINEERING 2012 2 14.82 13.79 15.15 31.88 18.32 7.41 6.52 10.64 481 2332 AISHWARYA COLLEGE OF ENGINEERING AND TECHNOLOGY 2011 2 14.48 23.98 36.61 6.23 11.80 10.61 9.17 2.94 482 1334 ARS COLLEGE OF ENGINEERING 2009 2 13.96 2.77 12.98 9.87 30.14 10.50 20.08 11.40 483 1448 SRI RAMANA MAHARISHI COLLEGE OF ENGINEERING 2010 2 13.89 7.67 17.19 18.64 22.33 8.72 8.67 14.04 484 5916 PANNAI COLLEGE OF ENGINEERING AND TECHNOLOGY 2001 2 13.75 6.56 15.63 6.57 21.65 6.21 21.55 18.11 485 2350 JAIRUPAA COLLEGE OF ENGINEERING 2012 2 13.11 9.86 22.17 12.10 7.51 12.95 10.77 16.42 486 2341 GANESH COLLEGE OF ENGINEERING 2011 2 12.07 8.83 20.61 7.79 6.47 12.46 20.18 8.15 487 5537 JAINEE COLLEGE OF ENGINEERING AND TECHNOLOGY 2013 2 11.90 9.76 31.58 8.62 4.76 4.76 NA NA 488 4685 NARAYANAGURU SIDDHARTHA COLLEGE OF ENGINEERING 2014 2 11.87 10.42 7.81 17.39 NA NA NA NA 489 3781 K.K.C COLLEGE OF ENGINEERING AND TECHNOLOGY 2010 2 11.27 12.96 20.39 8.88 19.28 5.79 8.59 2.98 490 1529 OXFORD COLLEGE OF ENGINEERING 2009 2 11.07 0.38 10.93 7.87 17.74 7.85 20.81 11.93 491 2340 SRI VENKATESHWARA INSTITUTE OF ENGINEERING 2011 2 11.07 11.09 16.88 8.67 14.93 6.55 13.66 5.74 492 3463 ELIZABETH COLLEGE OF ENGINEERING AND TECHNOLOGY 2013 2 10.91 20.21 14.46 8.24 9.80 1.82 NA NA 493 1443 LORD AYYAPPA INSTITUTE OF ENGINEERING AND TECHNOLOGY 2009 2 10.54 2.83 14.36 10.00 18.35 7.13 13.53 7.59 494 1506 G.G.R. COLLEGE OF ENGINEERING 2001 1 9.52 5.76 11.83 10.27 22.15 5.05 5.46 6.15 495 2368 VISHNU LAKSHMI COLLEGE OF ENGINEERING AND TECHNOLOGY 2013 1 6.94 3.08 5.00 9.52 9.09 8.00 NA NA
- 12. 2015/11 2015/05 2014/11 2014/05 2013/11 2013/05 2012/11 SL. NO. TNEA CODE NAME OF THE COLLEGE YEAR ESTD. RATING AVERAGE PASS % PASS PERCENTAGE BY SEMESTER 496 1136 VEDHANTHA INSTITUTE OF TECHNOLOGY 2012 1 6.43 18.85 2.80 6.06 11.94 0.00 1.82 3.51 497 3451 SMR EAST COAST COLLEGE OF ENGINEERING AND TECHNOLOGY 2010 1 4.72 1.80 12.06 3.02 4.58 2.50 2.80 6.25 497 279 308 183 284 216 320 193 298 56% 62% 37% 57% 43% 64% 39% 60% 77 131 42 111 45 137 64 130 15% 26% 8% 22% 9% 28% 13% 26% Version 1.00 Few Statistics: Colleges with less than 50% academic performance Colleges with less than 30% academic performance Number of colleges rated * This table is distributed in the hope that it will be useful, but WITHOUT WARRANTY OF ANY KIND. We strive to provide the accurate information possible. However, this table may have typos or defects - use it at your own risk and discretion. We encourage to report any issues found or suggestions to tnea.helper@outlook.com. * Table based on ACADEMIC PERFORMANCE OF NON-AUTONOMOUS AFFILIATED COLLEGES data released by Anna University for semesters 2012/11 through 2015/11. * “Price is what you pay. Value is what you get.” - Warren Buffett. Do your research before investing hard-earned money and precious time, especially when the probablity of success is less than 50%. Notes: * RATING is based on 1 - 10 scale where 10 represents "best" and 1 represents "worst" in terms of academic performance. * NA means "No data Available" likely due to the college established after 2012 (shaded) or data not released for unknown reasons. * Autonomous and B.Arch. Colleges are not rated due to ACADEMIC PERFORMANCE data unavailable.