
Recommended
Recommended
More Related Content
What's hot
What's hot (20)
Similar to Sample Techno commercial proposal for rooftop solar plant using The Solar Labs
Similar to Sample Techno commercial proposal for rooftop solar plant using The Solar Labs (20)
Recently uploaded
Recently uploaded (20)
Sample Techno commercial proposal for rooftop solar plant using The Solar Labs
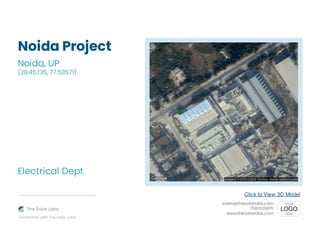
- 1. Noida Project Noida, UP (28.45735, 77.53571) Click to View 3D Model Electrical Dept The Solar Labs Generated with The Solar Labs sales@thesolarlabs.com 7581029615 www.thesolarlabs.com
- 2. About Us Our SAAS solar design tool help solar installers and developers design more optimized solar systems to increase energy and reduce the cost of installations, it enables installer to create a data driven quotation and report for clients within 20 minutes, drastically reducing their turnaround time. It is currently being used to design over 400 systems per week by our customers. Our City scale analysis product uses drone data to help governments and individuals identify potential of each building in the area and know the energy, financial and environmental potential impact of it. It helps government target areas for solar transition. The Solar Labs Generated with The Solar Labs
- 3. System Metrics ANNUAL PRODUCTION 90.71 x 1000 kWh (Units) PERFORMANCE RATIO 73.50% SPECIFIC GENERATION 1424.1 kWh/kWp/year 63.70 kWp 60.00 kW 1.06 Meteonorm Module DC Nameplate AC Nameplate Load Ratio Weather Dataset The Solar Labs Generated with The Solar Labs
- 4. Estimated Savings The estimated savings using solar for the next 25 years along with Total Savings, Payback Period and IRR TOTAL SAVINGS 6857740 INR PAYBACK PERIOD 2 yrs. 12 mos. INTERNAL RATE OF RETURN 30.82% 40000.0 ₹/kW 8.9% 25 Years 40.0% 3.0 Years Price Tax Expected Life Years AD Percentage AD Years The Solar Labs Generated with The Solar Labs
- 5. Components Your installation uses latest technology in solar RenewSys DESERV 3S6 350 182 No. Sungrow 60 KTL-M 1 No. Premium Walkways 115.12 m Premium Structure Modules Inverters Walkways Structure The Solar Labs Generated with The Solar Labs
- 6. Components Your installation uses latest technology in solar DC Distribution Box AC Distribution Box Earthing Lightning Arrestor BOS The Solar Labs Generated with The Solar Labs
- 7. Monthly Production During first year of operation, your system will produce 90.71 x 1000 units over the year Expected average generation of the system 7559.32 kWh/month Yearly degradation rate 1.5%/year
- 8. Monthly Table January 114.3 48.7 128.18 7029.33 6352.12 99.72 77.8 February 138.83 47.8 146.35 7760.87 7013.19 110.1 75.23 March 171.61 63.7 190.56 9842.45 8894.23 139.63 73.27 April 171.1 75.0 204.53 10253.44 9265.62 145.46 71.12 May 139.93 97.8 201.73 10031.8 9065.33 142.31 70.54 June 104.75 102.9 178.83 9029.76 8159.83 128.1 71.63 July 76.2 97.4 152.24 7786.55 7036.39 110.46 72.56 August 83.2 93.1 155.02 7961.27 7194.28 112.94 72.86 September 101.46 79.3 155.21 7972.46 7204.39 113.1 72.87 October 136.79 63.5 164.77 8489.32 7671.46 120.43 73.09 November 131.33 47.4 137.53 7229.36 6532.88 102.56 74.57 December 133.95 40.6 129.76 6996.06 6322.06 99.25 76.49 Annual 1503.45 857.2 1944.71 100382.67 90711.78 1424.06 73.5 Months GlobDirect (kWh/m2) GlobDiffuse (kWh/m2) GlobEff (kWh/m2) EArray (kWh) EGrid (kWh) Spec Gen PR The Solar Labs Generated with The Solar Labs
- 9. Field Segments Landscape 15 147.48 1.5 m 1x1 182 63.70 KW Orientation Tilt Azimuth Row Spacing Frame Size Modules Power The Solar Labs Generated with The Solar Labs
- 10. Shadow Analysis June 21 9:00 AM June 21 05:00 PM The Solar Labs Generated with The Solar Labs
- 11. Shadow Analysis December 22 9:00 AM December 22 05:00 PM Conclusion: Panels are shadow free for 99.4% of solar time throughout the year. The Solar Labs Generated with The Solar Labs
- 12. Heat Map Solar Access The Solar Labs Generated with The Solar Labs
- 13. Losses Loss in generation predicted due to environmental and electrical factors
- 14. Cost of Not Going Solar Your estimated annual electricity bill with and without solar for next 25 years
- 15. Impact on Environment You are contributing to solve Earth's biggest problem - Global Warming. CARBON DIOXIDE OFFSET 1345.3 metric tons EQUIVALENT ACRES OF FOREST 1579.4 acres/year COAL BURN AVOIDED 667 metric tons 22264 trees 573810.2 litres 5290046.1 kms Equivalent Number of Trees Planted Petrol Consumption Avoided Equivalent Kilometers Driven The Solar Labs Generated with The Solar Labs
- 16. Thank you The Solar Labs Design Software sales@thesolarlabs.com 7581029615 www.thesolarlabs.com The Solar Labs Generated with The Solar Labs